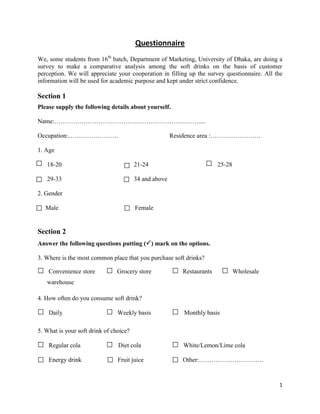
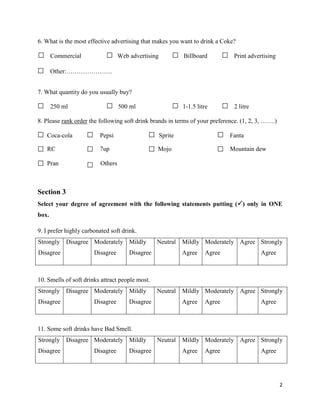
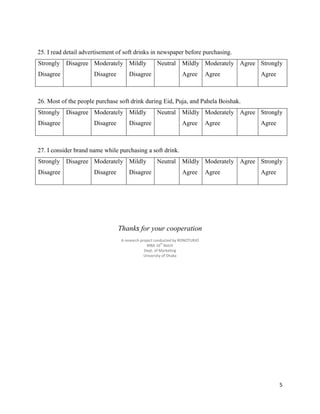
Students from the University of Dhaka's Department of Marketing are conducting a survey to compare customer perceptions of soft drinks. They have provided a questionnaire to gather information about respondents' soft drink preferences, purchasing behaviors, and opinions. The questionnaire collects demographic information and asks participants to rate their level of agreement with various statements about soft drinks. It aims to understand where people typically buy soft drinks, which brands they prefer, and what factors influence their purchases.
Major Project Report on “STUDY ON BUYING BEHAVIOUR OF CONSUMERS FOR DIFFERENT...Mayanksng07
In this report, we began with distribution of a questionnaire to participants of a different age and profile of Delhi city. We analyze the industry profile so that we get reliable data concerning the business climate. Then we use secondary data to analyze the companies profile more deeply such as research papers. To show the calculated data of primary research we use graphs and pie charts, which is the easiest way to represent the data and are easy to understand.
This project is an extensive research on the buying behavior of consumers for different brands of chocolates. It covers facts and figures and depicts all graphs of the companies. It begins with the introduction of industries. It covers some of the major strategies adopted by the companies like their pricing policy, sales promotion and advertising policy, distribution policy etc. The project has been made interesting with the inclusion of the topics, which covers the 4P’s of marketing.
The major players in the sweet confectionary industry in India are Amul, Campo, Cadbury and Nestle. They have a cut throat competition between themselves. Whatever strategy is followed by one company, it is copied by the other to make themselves popular among the market too.
Sample of the brands were selected on the basis of their uses and noticeciability.
Academic Project Summarized Below:
• Concept of Energy Drinks
• Profile of Red Bull as a pioneer in energy drinks
• Energy Drink market in India
• Created and conducted an online survey and captured responses of 100 respondents and conducted Secondary research to determine the following objectives:
- To understand and identify the energy drink market in India
- To understand consumer preference and their consuming habits
- To analyze the market opportunities and drawbacks
• Analysis & Recommendations
The project is completed by Pritam Mukherjee of PIBM, Pune pursuing MBA and contains the data of different products of Coca- Cola, their variants and the prices of those variants and distribution methods. The product mix of Coca- cola for both international and Indian market and the pricing methods adopted by the company, the report also contains different prices for different types of market namely, Kirana stores, retail outlets and online. Inventory Turnover Ration of Coca-Cola 2019. The data is of 2020.
This document was written for The Happiness Alliance, home of the Happiness Initiative and Gross National Happiness Index. It may be used for non-commercial purposes and with the understanding that you will share the data you collect. The Happiness Alliance issues unique codes to communities, cities, campuses, companies and others to gather aggregate data for groups in a grassroots effort to contribute to the happiness movement. We also work with pollsters to conduct random samples. Please contact info@happycounts.org for more information.
The Happiness Alliance, home of the Happiness Initiative and Gross National Happiness Index requests that you use the following form of words to cite this document:
Gross National Happiness Index, (2013). GNH Index Round 2. Seattle: The Happiness Initiative, Developed by Howell, R.T., Musikanski, L., & Goldenberg, E.
ER(Entity Relationship) Diagram for online shopping - TAEHimani415946
https://bit.ly/3KACoyV
The ER diagram for the project is the foundation for the building of the database of the project. The properties, datatypes, and attributes are defined by the ER diagram.
This 7-second Brain Wave Ritual Attracts Money To You.!nirahealhty
Discover the power of a simple 7-second brain wave ritual that can attract wealth and abundance into your life. By tapping into specific brain frequencies, this technique helps you manifest financial success effortlessly. Ready to transform your financial future? Try this powerful ritual and start attracting money today!
Multi-cluster Kubernetes Networking- Patterns, Projects and GuidelinesSanjeev Rampal
Talk presented at Kubernetes Community Day, New York, May 2024.
Technical summary of Multi-Cluster Kubernetes Networking architectures with focus on 4 key topics.
1) Key patterns for Multi-cluster architectures
2) Architectural comparison of several OSS/ CNCF projects to address these patterns
3) Evolution trends for the APIs of these projects
4) Some design recommendations & guidelines for adopting/ deploying these solutions.
1.Wireless Communication System_Wireless communication is a broad term that i...JeyaPerumal1
Wireless communication involves the transmission of information over a distance without the help of wires, cables or any other forms of electrical conductors.
Wireless communication is a broad term that incorporates all procedures and forms of connecting and communicating between two or more devices using a wireless signal through wireless communication technologies and devices.
Features of Wireless Communication
The evolution of wireless technology has brought many advancements with its effective features.
The transmitted distance can be anywhere between a few meters (for example, a television's remote control) and thousands of kilometers (for example, radio communication).
Wireless communication can be used for cellular telephony, wireless access to the internet, wireless home networking, and so on.
1. 1
Questionnaire
We, some students from 16th
batch, Department of Marketing, University of Dhaka, are doing a
survey to make a comparative analysis among the soft drinks on the basis of customer
perception. We will appreciate your cooperation in filling up the survey questionnaire. All the
information will be used for academic purpose and kept under strict confidence.
Section 1
Please supply the following details about yourself.
Name:……………………………………………………………....
Occupation:…………………… Residence area :……………………
1. Age
18-20 21-24 25-28
29-33 34 and above
2. Gender
Male Female
Section 2
Answer the following questions putting () mark on the options.
3. Where is the most common place that you purchase soft drinks?
Convenience store Grocery store Restaurants Wholesale
warehouse
4. How often do you consume soft drink?
Daily Weekly basis Monthly basis
5. What is your soft drink of choice?
Regular cola Diet cola White/Lemon/Lime cola
Energy drink Fruit juice Other:………………………….
2. 2
6. What is the most effective advertising that makes you want to drink a Coke?
Commercial Web advertising Billboard Print advertising
Other:………………….
7. What quantity do you usually buy?
250 ml 500 ml 1-1.5 litre 2 litre
8. Please rank order the following soft drink brands in terms of your preference. (1, 2, 3, …….)
Coca-cola Pepsi Sprite Fanta
RC 7up Mojo Mountain dew
Pran Others
Section 3
Select your degree of agreement with the following statements putting () only in ONE
box.
9. I prefer highly carbonated soft drink.
Strongly
Disagree
Disagree Moderately
Disagree
Mildly
Disagree
Neutral Mildly
Agree
Moderately
Agree
Agree Strongly
Agree
10. Smells of soft drinks attract people most.
Strongly
Disagree
Disagree Moderately
Disagree
Mildly
Disagree
Neutral Mildly
Agree
Moderately
Agree
Agree Strongly
Agree
11. Some soft drinks have Bad Smell.
Strongly
Disagree
Disagree Moderately
Disagree
Mildly
Disagree
Neutral Mildly
Agree
Moderately
Agree
Agree Strongly
Agree
3. 3
12. Some soft drinks taste bitter.
Strongly
Disagree
Disagree Moderately
Disagree
Mildly
Disagree
Neutral Mildly
Agree
Moderately
Agree
Agree Strongly
Agree
13. People like sweetened soft drinks.
Strongly
Disagree
Disagree Moderately
Disagree
Mildly
Disagree
Neutral Mildly
Agree
Moderately
Agree
Agree Strongly
Agree
14. All ingredients (Sugar, calorie, protein, carbohydrate, fat etc.) should be well balanced.
Strongly
Disagree
Disagree Moderately
Disagree
Mildly
Disagree
Neutral Mildly
Agree
Moderately
Agree
Agree Strongly
Agree
15. People think that soft drinks cause harmful diseases.
Strongly
Disagree
Disagree Moderately
Disagree
Mildly
Disagree
Neutral Mildly
Agree
Moderately
Agree
Agree Strongly
Agree
16. Black Color Cola contains harmful & contaminated elements.
Strongly
Disagree
Disagree Moderately
Disagree
Mildly
Disagree
Neutral Mildly
Agree
Moderately
Agree
Agree Strongly
Agree
17. People think that soft drink in a van (mobile vendor) is contaminated and improperly
balanced.
Strongly
Disagree
Disagree Moderately
Disagree
Mildly
Disagree
Neutral Mildly
Agree
Moderately
Agree
Agree Strongly
Agree
4. 4
18. I want to buy soft drink of tk.12.
Strongly
Disagree
Disagree Moderately
Disagree
Mildly
Disagree
Neutral Mildly
Agree
Moderately
Agree
Agree Strongly
Agree
19. Most people will like to by soft drink of tk. 10.
Strongly
Disagree
Disagree Moderately
Disagree
Mildly
Disagree
Neutral Mildly
Agree
Moderately
Agree
Agree Strongly
Agree
20. I want 150 ml soft drink bottle.
Strongly
Disagree
Disagree Moderately
Disagree
Mildly
Disagree
Neutral Mildly
Agree
Moderately
Agree
Agree Strongly
Agree
21. Most people preferred to buy 250 ml bottle.
Strongly
Disagree
Disagree Moderately
Disagree
Mildly
Disagree
Neutral Mildly
Agree
Moderately
Agree
Agree Strongly
Agree
22. I want a soft, colored, and artistic bottle of soft drink.
Strongly
Disagree
Disagree Moderately
Disagree
Mildly
Disagree
Neutral Mildly
Agree
Moderately
Agree
Agree Strongly
Agree
23. Soft drink bottle must be easily disposable and not be reusable.
Strongly
Disagree
Disagree Moderately
Disagree
Mildly
Disagree
Neutral Mildly
Agree
Moderately
Agree
Agree Strongly
Agree
24. Television ads influence me to buy soft drink.
Strongly
Disagree
Disagree Moderately
Disagree
Mildly
Disagree
Neutral Mildly
Agree
Moderately
Agree
Agree Strongly
Agree
5. 5
25. I read detail advertisement of soft drinks in newspaper before purchasing.
Strongly
Disagree
Disagree Moderately
Disagree
Mildly
Disagree
Neutral Mildly
Agree
Moderately
Agree
Agree Strongly
Agree
26. Most of the people purchase soft drink during Eid, Puja, and Pahela Boishak.
Strongly
Disagree
Disagree Moderately
Disagree
Mildly
Disagree
Neutral Mildly
Agree
Moderately
Agree
Agree Strongly
Agree
27. I consider brand name while purchasing a soft drink.
Strongly
Disagree
Disagree Moderately
Disagree
Mildly
Disagree
Neutral Mildly
Agree
Moderately
Agree
Agree Strongly
Agree
Thanks for your cooperation
A research project conducted by RONOTURJO
MBA 16th
Batch
Dept. of Marketing
University of Dhaka