This document describes a study of 16 massive galaxies at z ~ 2 selected from the 3D-HST spectroscopic survey based on the detection of a strong 4000 Angstrom break in their spectra. Spectroscopy and imaging from HST/WFC3 are used to determine accurate redshifts, stellar population properties, and structural parameters. The sample significantly increases the number of spectroscopically confirmed evolved galaxies at z ~ 2 with robust size measurements. The analysis populates the mass-size relation and finds it is consistent with local relations but with smaller sizes by a factor of 2-3. A model is presented where the observed size evolution is explained by quenching of increasingly larger star-forming galaxies at a rate set by
We present deep optical images of the Large and Small Magellanic Clouds (LMC and SMC) using
a low cost telephoto lens with a wide field of view to explore stellar substructure in the outskirts
of the stellar disk of the LMC (r < 10 degrees from the center). These data have higher resolution
than existing star count maps, and highlight the existence of stellar arcs and multiple spiral arms in
the northern periphery, with no comparable counterparts in the South. We compare these data to
detailed simulations of the LMC disk outskirts, following interactions with its low mass companion,
the SMC. We consider interaction in isolation and with the inclusion of the Milky Way tidal field.
The simulations are used to assess the origin of the northern structures, including also the low density
stellar arc recently identified in the DES data by Mackey et al. (2015) at ∼ 15 degrees. We conclude
that repeated close interactions with the SMC are primarily responsible for the asymmetric stellar
structures seen in the periphery of the LMC. The orientation and density of these arcs can be used to
constrain the LMC’s interaction history with and impact parameter of the SMC. More generally, we
find that such asymmetric structures should be ubiquitous about pairs of dwarfs and can persist for
1-2 Gyr even after the secondary merges entirely with the primary. As such, the lack of a companion
around a Magellanic Irregular does not disprove the hypothesis that their asymmetric structures are
driven by dwarf-dwarf interactions.
On some structural_features_of_the_metagalaxySérgio Sacani
Progress in a group of investigations designed
to discover some of the structural details in individual galaxies and in the
Metagalaxy is reported in the following pages.
(a) The first section is concerned with the distribution of cluster-type
Cepheids in high galactic latitude. To the 169 already known in latitudes,
greater than or equal to ± 20o
, the systematic variable star programme carried
on at Harvard has added 312, mostly fainter than magnitude 13-0. With
allowance for absorption and for uncertainties yet remaining in the mean
absolute magnitude of these stars, the thickness of the Milky Way, so far
as this type of star is concerned, is not less than twenty-five kiloparsecs ;
he extent of the Milky Way in its own plane, by the same criterion, is more
than thirty kiloparsecs, perhaps much more.
(b) The extent of the Milky Way in the anti-centre quadrant is considered
on the basis of classical and cluster-type Cepheids ; provisionally
it is found that the galactic system reaches to a distance of at least ten
kiloparsecs in longitude 150o
.
(r) More than six hundred new variables have been found in the Large
Magellanic Cloud and measured for position, ranges and median magnitudes ;
the frequency of periods is not unlike that for the classical Cepheids in the
galactic system ; the light curves also are comparable in all details. The
Magellanic Cepheids, like the galactic classical Cepheids, are concentrated
in regions of high star-density.
(d) Further study of the period-luminosity relation in the Large Magellanic
Cloud permits its revision and strengthening for the Cepheids of
highest absolute magnitude. An observed deviation from the relation
that had previously been found for the Small Cloud is probably to be
attributed to scale error in the magnitude system. No seriously disturbing
A 2 4_determination_of_the_local_value_of_the_hubble_constantSérgio Sacani
We use the Wide Field Camera 3 (WFC3) on the Hubble Space Telescope (HST) to
reduce the uncertainty in the local value of the Hubble constant from 3.3% to 2.4%.
The bulk of this improvement comes from new, near-infrared observations of Cepheid
variables in 11 host galaxies of recent type Ia supernovae (SNe Ia), more than doubling
the sample of reliable SNe Ia having a Cepheid-calibrated distance to a total of 19; these
in turn leverage the magnitude-redshift relation based on 300 SNe Ia at z <0.15. All
19 hosts as well as the megamaser system NGC4258 have been observed with WFC3
in the optical and near-infrared, thus nullifying cross-instrument zeropoint errors in the
relative distance estimates from Cepheids. Other noteworthy improvements include a
33% reduction in the systematic uncertainty in the maser distance to NGC4258, a larger
sample of Cepheids in the Large Magellanic Cloud (LMC), a more robust distance to
the LMC based on late-type detached eclipsing binaries (DEBs), HST observations of
Cepheids in M31, and new HST-based trigonometric parallaxes for Milky Way (MW)
Cepheids.
We report the discovery of a new Kepler transiting circumbinary planet (CBP).
This latest addition to the still-small family of CBPs defies the current trend of known
short-period planets orbiting near the stability limit of binary stars. Unlike the previous
discoveries, the planet revolving around the eclipsing binary system Kepler-1647 has
a very long orbital period ( 1100 days) and was at conjunction only twice during
the Kepler mission lifetime. Due to the singular configuration of the system, Kepler-
1647b is not only the longest-period transiting CBP at the time of writing, but also one
of the longest-period transiting planets. With a radius of 1:060:01 RJup it is also the
largest CBP to date. The planet produced three transits in the light-curve of Kepler-
1647 (one of them during an eclipse, creating a syzygy) and measurably perturbed the
times of the stellar eclipses, allowing us to measure its mass to be 1:520:65 MJup.
The planet revolves around an 11-day period eclipsing binary consisting of two Solarmass
stars on a slightly inclined, mildly eccentric (ebin = 0:16), spin-synchronized
orbit. Despite having an orbital period three times longer than Earth’s, Kepler-1647b is
in the conservative habitable zone of the binary star throughout its orbit.
The canarias einstein_ring_a_newly_discovered_optical_einstein_ringSérgio Sacani
We report the discovery of an optical Einstein Ring in the Sculptor constellation,
IAC J010127-334319, in the vicinity of the Sculptor Dwarf Spheroidal Galaxy. It is
an almost complete ring ( 300◦) with a diameter of 4.5 arcsec. The discovery was
made serendipitously from inspecting Dark Energy Camera (DECam) archive imaging
data. Confirmation of the object nature has been obtained by deriving spectroscopic
redshifts for both components, lens and source, from observations at the 10.4 m Gran
Telescopio CANARIAS (GTC) with the spectrograph OSIRIS. The lens, a massive
early-type galaxy, has a redshift of z = 0.581 while the source is a starburst galaxy
with redshift of z = 1.165. The total enclosed mass that produces the lensing effect
has been estimated to be Mtot = (1.86 ± 0.23) · 1012M⊙.
Detection of solar_like_oscillations_in_relies_of_the_milk_way_asteroseismolo...Sérgio Sacani
Asteroseismic constraints on K giants make it possible to infer radii, masses and ages of tens
of thousands of field stars. Tests against independent estimates of these properties are however
scarce, especially in the metal-poor regime. Here, we report the detection of solar-like
oscillations in 8 stars belonging to the red-giant branch and red-horizontal branch of the globular
cluster M4. The detections were made in photometric observations from the K2 Mission
during its Campaign 2. Making use of independent constraints on the distance, we estimate
masses of the 8 stars by utilising different combinations of seismic and non-seismic inputs.
When introducing a correction to the Δν scaling relation as suggested by stellar models, for
RGB stars we find excellent agreement with the expected masses from isochrone fitting, and
with a distance modulus derived using independent methods. The offset with respect to independent
masses is lower, or comparable with, the uncertainties on the average RGB mass
(4 − 10%, depending on the combination of constraints used). Our results lend confidence to
asteroseismic masses in the metal poor regime. We note that a larger sample will be needed
to allow more stringent tests to be made of systematic uncertainties in all the observables
(both seismic and non-seismic), and to explore the properties of RHB stars, and of different
populations in the cluster.
O telescópio de rastreio VISTA do ESO encontrou uma horda de galáxias massivas anteriormente ocultas por poeira, que existiram quando o Universo era ainda bebê. Ao descobrir e estudar uma grande quantidade deste tipo de galáxias, os astrônomos descobriram, exatamente e pela primeira vez, quando é que tais monstros apareceram pela primeira vez no Universo.
O simples fato de contar o número de galáxias que existem em determinada área do céu permite aos astrônomos testar teorias de formação e evolução galática. No entanto, uma tarefa aparentemente tão fácil torna-se mais difícil quando tentamos contar galáxias cada vez mais distantes e tênues e é mais complicada ainda devido ao fato das galáxias mais brilhantes e fáceis de observar — as mais massivas no Universo — se tornarem mais raras à medida que os astrônomos observam o passado do Universo, enquanto que as galáxias menos brilhantes, mas muito mais numerosas, são ainda mais difíceis de detectar.
Uma equipe de astrônomos liderada por Karina Caputi do Instituto Astronômico Kapteyn da Universidade de Groningen, descobriu muitas galáxias distantes que não tinham sido detectadas anteriormente. A equipe utilizou imagens do rastreioUltraVISTA, um dos seis projetos que usam o VISTA para mapear o céu no infravermelho próximo, e fez um censo das galáxias tênues quando a idade do Universo estava compreendida entre 0,75 e 2,1 bilhões de anos.
The network of filaments with embedded clusters surrounding voids, which has been seen in maps derived from
redshift surveys and reproduced in simulations, has been referred to as the cosmic web. A complementary
description is provided by considering the shear in the velocity field of galaxies. The eigenvalues of the shear
provide information regarding whether or not a region is collapsing in three dimensions, which is the condition for
a knot, expanding in three dimensions, which is the condition for a void, or in the intermediate condition of a
filament or sheet. The structures that are quantitatively defined by the eigenvalues can be approximated by isocontours
that provide a visual representation of the cosmic velocity (V) web. The current application is based on
radial peculiar velocities from the Cosmicflows-2 collection of distances. The three-dimensional velocity field is
constructed using the Wiener filter methodology in the linear approximation. Eigenvalues of the velocity shear are
calculated at each point on a grid. Here, knots and filaments are visualized across a local domain of
diameter ~0.1c
A giant ring_like_structure_at_078_z_086_displayed_by_gr_bsSérgio Sacani
Uma equipe de astrônomos da Hungria e dos EUA descobriram o que parece ser a maior feição no universo observável: um anel de nove explosões de raios-gamma – e portanto, galáxias – com 5 bilhões de anos-luz de diâmetro. Os cientistas, liderados pelo Prof. Lajos Balazs, do Observatório Konkoloy, em Budapeste, reportou seu trabalho num artigo do Montlhy Notices of the Royal Astronomical Socitey.
Explosões de raios-Gamma as GRBs, são os eventos mais luminosos no universo, lançando o equivalente à energia que o Sol lança em 10 bilhões de anos em poucos segundos. Acredita-se que elas sejam o resultado do colapso de massivas estrelas em buracos negros. A grande luminosidade desses eventos, ajuda os astrônomos a mapearem o local de distantes galáxias, algo que a equipe explorou.
As GRBs que constituem o recém-descoberto anel foram observadas, usando uma grande variedade de telescópios, tanto em Terra como no espaço. Elas aparecem a uma distância muito similar de nós, cerca de 7 bilhões de anos-luz, num círculo de 36 graus através do nosso céu, ou o equivalente a mais de 70 vezes o diâmetro da Lua Cheia. Isso implica que o anel tem mais de 5 bilhões de anos-luz de diâmetro, e de acordo com o Professor Balazs, existe somente a probabilidade de 1 em 20000 das GRBs estarem nessa distribuição por coincidência.
First identification of_direct_collapse_black_holes_candidates_in_the_early_u...Sérgio Sacani
The first black hole seeds, formed when the Universe was younger than ⇠ 500Myr, are recognized
to play an important role for the growth of early (z ⇠ 7) super-massive black holes.
While progresses have been made in understanding their formation and growth, their observational
signatures remain largely unexplored. As a result, no detection of such sources has been
confirmed so far. Supported by numerical simulations, we present a novel photometric method
to identify black hole seed candidates in deep multi-wavelength surveys.We predict that these
highly-obscured sources are characterized by a steep spectrum in the infrared (1.6−4.5μm),
i.e. by very red colors. The method selects the only 2 objects with a robust X-ray detection
found in the CANDELS/GOODS-S survey with a photometric redshift z & 6. Fitting their
infrared spectra only with a stellar component would require unrealistic star formation rates
(& 2000M# yr−1). To date, the selected objects represent the most promising black hole seed
candidates, possibly formed via the direct collapse black hole scenario, with predicted mass
> 105M#. While this result is based on the best photometric observations of high-z sources
available to date, additional progress is expected from spectroscopic and deeper X-ray data.
Upcoming observatories, like the JWST, will greatly expand the scope of this work.
A population of faint low surface brightness galaxies in the Perseus cluster ...Sérgio Sacani
We present the detection of 89 low surface brightness (LSB), and thus low stellar
density galaxy candidates in the Perseus cluster core, of the kind named ‘ultra-diffuse
galaxies’, with mean effective V-band surface brightnesses 24.8–27.1 mag arcsec−2
, total
V-band magnitudes −11.8 to −15.5 mag, and half-light radii 0.7–4.1 kpc. The candidates
have been identified in a deep mosaic covering 0.3 deg2
, based on wide-field
imaging data obtained with the William Herschel Telescope. We find that the LSB
galaxy population is depleted in the cluster centre and only very few LSB candidates
have half-light radii larger than 3 kpc. This appears consistent with an estimate of
their tidal radius, which does not reach beyond the stellar extent even if we assume
a high dark matter content (M/L = 100). In fact, three of our candidates seem to
be associated with tidal streams, which points to their current disruption. Given that
published data on faint LSB candidates in the Coma cluster – with its comparable central
density to Perseus – show the same dearth of large objects in the core region, we
conclude that these cannot survive the strong tides in the centres of massive clusters.
The ASTRODEEP Frontier Fields catalogues II. Photometric redshifts and rest f...Sérgio Sacani
Aims. We present the first public release of photometric redshifts, galaxy rest frame properties and associated magnification values
in the cluster and parallel pointings of the first two Frontier Fields, Abell-2744 and MACS-J0416. The released catalogues aim to
provide a reference for future investigations of extragalactic populations in these legacy fields: from lensed high-redshift galaxies to
cluster members themselves.
Methods.We exploit a multiwavelength catalogue, ranging from Hubble Space Telescope (HST) to ground-based K and Spitzer IRAC,
which is specifically designed to enable detection and measurement of accurate fluxes in crowded cluster regions. The multiband
information is used to derive photometric redshifts and physical properties of sources detected either in the H-band image alone, or
from a stack of four WFC3 bands. To minimize systematics, median photometric redshifts are assembled from six dierent approaches
to photo-z estimates. Their reliability is assessed through a comparison with available spectroscopic samples. State-of-the-art lensing
models are used to derive magnification values on an object-by-object basis by taking into account sources positions and redshifts.
Results. We show that photometric redshifts reach a remarkable 3–5% accuracy. After accounting for magnification, the H-band
number counts are found to be in agreement at bright magnitudes with number counts from the CANDELS fields, while extending
the presently available samples to galaxies that, intrinsically, are as faint as H 32 33, thanks to strong gravitational lensing. The
Frontier Fields allow the galaxy stellar mass distribution to be probed, depending on magnification, at 0.5–1.5 dex lower masses with
respect to extragalactic wide fields, including sources at Mstar 107–108 M at z > 5. Similarly, they allow the detection of objects
with intrinsic star formation rates (SFRs) >1 dex lower than in the CANDELS fields reaching 0.1–1 M=yr at z 6–10.
Supermassive black holes in galaxy centres can grow by the accretion
of gas, liberating enormous amounts of energy that might
regulate star formation on galaxy-wide scales1–3
. The nature of
gaseous fuel reservoirs that power black hole growth is nevertheless
largely unconstrained by observations, and is instead routinely
simplified as a smooth, spherical inflow of very hot gas
in accordance with the Bondi solution4
. Recent theory5–7 and
simulations8–10 instead predict that accretion can be dominated by
a stochastic, clumpy distribution of very cold molecular clouds,
though unambiguous observational support for this prediction remains
elusive. Here we show observational evidence for a cold,
clumpy accretion flow toward a supermassive black hole fuel reservoir
in the nucleus of the Abell 2597 Brightest Cluster Galaxy
(BCG), a nearby (z = 0.0821) giant elliptical galaxy surrounded
by a dense halo of hot plasma11–13. Under the right conditions,
thermal instabilities can precipitate from this hot gas, producing a
rain of cold clouds that fall toward the galaxy’s centre14, sustaining
star formation amid a kiloparsec-scale molecular nebula that inhabits
its core15. New interferometric sub-millimetre observations
show that these cold clouds also fuel black hole accretion, revealing
“shadows” cast by molecular clouds as they move inward at ∼ 300
km s−1
toward the active supermassive black hole in the galaxy
centre, which serves as a bright backlight. Corroborating evidence
from prior observations16 of warmer atomic gas at extremely high
spatial resolution17, along with simple arguments based on geometry
and probability, indicates that these clouds are within the innermost
hundred parsecs of the black hole, and falling closer toward
it
The characterization of_the_gamma_ray_signal_from_the_central_milk_way_a_comp...Sérgio Sacani
Past studies have identified a spatially extended excess of ∼1-3 GeV gamma rays from the region
surrounding the Galactic Center, consistent with the emission expected from annihilating dark
matter. We revisit and scrutinize this signal with the intention of further constraining its characteristics
and origin. By applying cuts to the Fermi event parameter CTBCORE, we suppress the tails
of the point spread function and generate high resolution gamma-ray maps, enabling us to more
easily separate the various gamma-ray components. Within these maps, we find the GeV excess
to be robust and highly statistically significant, with a spectrum, angular distribution, and overall
normalization that is in good agreement with that predicted by simple annihilating dark matter
models. For example, the signal is very well fit by a 36-51 GeV dark matter particle annihilating to
b
¯b with an annihilation cross section of σv = (1−3)×10−26 cm3
/s (normalized to a local dark matter
density of 0.4 GeV/cm3
). Furthermore, we confirm that the angular distribution of the excess is
approximately spherically symmetric and centered around the dynamical center of the Milky Way
(within ∼0.05◦
of Sgr A∗
), showing no sign of elongation along the Galactic Plane. The signal is
observed to extend to at least ' 10◦
from the Galactic Center, disfavoring the possibility that this
emission originates from millisecond pulsars.
Chandra deep observation_of_xdcpj004402033_a_massive_galaxy_cluster_at_z_1_5Sérgio Sacani
Artigo apresenta os resultados obtidos pelo Chandra ao medir com precisão a massa do mais massivo aglomerado de galáxias do universo distante, o Aglomerado Gioiello.
Young remmants of_type_ia_supernovae_and_their_progenitors_a_study_of_snr_g19_03Sérgio Sacani
Type Ia supernovae, with their remarkably homogeneous light curves and spectra, have been used as
standardizable candles to measure the accelerating expansion of the Universe. Yet, their progenitors
remain elusive. Common explanations invoke a degenerate star (white dwarf) which explodes upon
reaching close to the Chandrasekhar limit, by either steadily accreting mass from a companion star
or violently merging with another degenerate star. We show that circumstellar interaction in young
Galactic supernova remnants can be used to distinguish between these single and double degenerate
progenitor scenarios. Here we propose a new diagnostic, the Surface Brightness Index, which can
be computed from theory and compared with Chandra and VLA observations. We use this method
to demonstrate that a double degenerate progenitor can explain the decades-long
ux rise and size
increase of the youngest known Galactic SNR G1.9+0.3. We disfavor a single degenerate scenario.
We attribute the observed properties to the interaction between a steep ejecta prole and a constant
density environment. We suggest using the upgraded VLA to detect circumstellar interaction in
the remnants of historical Type Ia supernovae in the Local Group of galaxies. This may settle the
long-standing debate over their progenitors.
Subject headings: ISM: supernova remnants | radio continuum: general | X-rays: general | bi-
naries: general | circumstellar matter | supernovae: general | ISM: individual
objects(SNR G1.9+0.3)
Detection of lyman_alpha_emission_from_a_triply_imaged_z_6_85_galaxy_behind_m...Sérgio Sacani
We report the detection of Ly emission at 9538A
in the Keck/DEIMOS and HST WFC3
G102 grism data from a triply-imaged galaxy at z = 6:846 0:001 behind galaxy cluster MACS
J2129.4 0741. Combining the emission line wavelength with broadband photometry, line ratio upper
limits, and lens modeling, we rule out the scenario that this emission line is [O II] at z = 1:57. After
accounting for magnication, we calculate the weighted average of the intrinsic Ly luminosity to be
1:31042 erg s 1 and Ly equivalent width to be 7415A. Its intrinsic UV absolute magnitude at
1600A
is 18:60:2 mag and stellar mass (1:50:3)107 M, making it one of the faintest (intrinsic
LUV 0:14 L
UV) galaxies with Ly detection at z 7 to date. Its stellar mass is in the typical range
for the galaxies thought to dominate the reionization photon budget at z & 7; the inferred Ly escape
fraction is high (& 10%), which could be common for sub-L z & 7 galaxies with Ly emission. This
galaxy oers a glimpse of the galaxy population that is thought to drive reionization, and it shows
that gravitational lensing is an important avenue to probe the sub-L galaxy population.
Beyond the Kuiper Belt Edge: New High Perihelion Trans-Neptunian Objects With...Sérgio Sacani
We are conducting a survey for distant solar system objects beyond the Kuiper
Belt edge ( 50 AU) with new wide-field cameras on the Subaru and CTIO tele-
scopes. We are interested in the orbits of objects that are decoupled from the
giant planet region in order to understand the structure of the outer solar sys-
tem, including whether a massive planet exists beyond a few hundred AU as first
reported in Trujillo and Sheppard (2014). In addition to discovering extreme
trans-Neptunian objects detailed elsewhere, we have found several objects with
high perihelia (q > 40 AU) that differ from the extreme and inner Oort cloud
objects due to their moderate semi-major axes (50 < a < 100 AU) and eccen-
tricities (e . 0.3). Newly discovered objects 2014 FZ71 and 2015 FJ345 have
the third and fourth highest perihelia known after Sedna and 2012 VP113, yet
their orbits are not nearly as eccentric or distant. We found several of these high
perihelion but moderate orbit objects and observe that they are mostly near Nep-
tune mean motion resonances and have significant inclinations (i > 20 degrees).
These moderate objects likely obtained their unusual orbits through combined
interactions with Neptune’s mean motion resonances and the Kozai resonance,
similar to the origin scenarios for 2004 XR190. We also find the distant 2008
ST291 has likely been modified by the MMR+KR mechanism through the 6:1
Neptune resonance. We discuss these moderately eccentric, distant objects along
with some other interesting low inclination outer classical belt objects like 2012
FH84 discovered in our ongoing survey.
Inverse Compton cooling limits the brightness temperature of the radiating plasma to a maximum of
1011.5 K. Relativistic boosting can increase its observed value, but apparent brightness temperatures
much in excess of 1013 K are inaccessible using ground-based very long baseline interferometry (VLBI)
at any wavelength. We present observations of the quasar 3C 273, made with the space VLBI mission
RadioAstron on baselines up to 171,000 km, which directly reveal the presence of angular structure as
small as 26 µas (2.7 light months) and brightness temperature in excess of 1013 K. These measurements
challenge our understanding of the non-thermal continuum emission in the vicinity of supermassive
black holes and require a much higher Doppler factor than what is determined from jet apparent
kinematics.
Keywords: galaxies: active — galaxies: jets — radio continuum: galaxies — techniques: interferometric
— quasars: individual (3C 273)
What is computer, computer structure and how its function with some application in aircraft
Slide for student who want to take EASA part66 exam
Other note you can get at
http://part66.blogspot.com
Star formation at the smallest scales; A JWST study of the clump populations ...Sérgio Sacani
We present the clump populations detected in 18 lensed galaxies at redshifts 1 to 8.5 within the lensing cluster field SMACS0723.
The recent JWST Early Release Observations of this poorly known region of the sky have revealed numerous point-like sources
within and surrounding their host galaxies, undetected in the shallower HST images. We use JWST multiband photometry and
the lensing model of this galaxy cluster to estimate the intrinsic sizes and magnitudes of the stellar clumps. We derive optical
restframe effective radii from <10 to hundreds pc and masses ranging from ∼ 105
to 109 M, overlapping with massive star
clusters in the local universe. Clump ages range from 1 Myr to 1 Gyr. We compare the crossing time to the age of the clumps
and determine that between 45 and 60 % of the detected clumps are consistent with being gravitationally bound. On average,
the dearth of Gyr old clumps suggests that the dissolution time scales are shorter than 1 Gyr. We see a significant increase in the
luminosity (mass) surface density of the clumps with redshift. Clumps in reionisation era galaxies have stellar densities higher
than star clusters in the local universe. We zoom in into single galaxies at redshift < 6 and find for two galaxies, the Sparkler and
the Firework, that their star clusters/clumps show distinctive colour distributions and location surrounding their host galaxy that
are compatible with being accredited or formed during merger events. The ages of some of the compact clusters are between
1 and 4 Gyr, e.g., globular cluster precursors formed around 9-12 Gyr ago. Our study, conducted on a small sample of galaxies,
shows the potential of JWST observations for understanding the conditions under which star clusters form in rapidly evolving
galaxies.
The massive relic galaxy NGC 1277 is dark matter deficient From dynamical mod...Sérgio Sacani
According to the Λ cold dark matter (ΛCDM) cosmology, present-day galaxies with stellar masses M? > 1011 M should contain
a sizable fraction of dark matter within their stellar body. Models indicate that in massive early-type galaxies (ETGs) with M? ≈
1.5 × 10¹¹ M, dark matter should account for ∼15% of the dynamical mass within one effective radius (1 Re) and for ∼60% within
5 Re
. Most massive ETGs have been shaped through a two-phase process: the rapid growth of a compact core was followed by the
accretion of an extended envelope through mergers. The exceedingly rare galaxies that have avoided the second phase, the so-called
relic galaxies, are thought to be the frozen remains of the massive ETG population at z & 2. The best relic galaxy candidate discovered
to date is NGC 1277, in the Perseus cluster. We used deep integral field George and Cynthia Mitchel Spectrograph (GCMS) data to
revisit NGC 1277 out to an unprecedented radius of 6 kpc (corresponding to 5 Re). By using Jeans anisotropic modelling, we find
a negligible dark matter fraction within 5 Re (fDM(5 Re) < 0.05; two-sigma confidence level), which is in tension with the ΛCDM
expectation. Since the lack of an extended envelope would reduce dynamical friction and prevent the accretion of an envelope, we
propose that NGC 1277 lost its dark matter very early or that it was dark matter deficient ab initio. We discuss our discovery in the
framework of recent proposals, suggesting that some relic galaxies may result from dark matter stripping as they fell in and interacted
within galaxy clusters. Alternatively, NGC 1277 might have been born in a high-velocity collision of gas-rich proto-galactic fragments,
where dark matter left behind a disc of dissipative baryons. We speculate that the relative velocities of ≈2000 km s−1
required for the
latter process to happen were possible in the progenitors of the present-day rich galaxy clusters.
An excess of_dusty_starbusts_related_to_the_spiderweb_galaxySérgio Sacani
Artigo que descreve as últimas observações do APEX revelando como se dá a formação de estrelas e a construção do Aglomerado de Galáxias da Teia de Aranha.
The first X-ray look at SMSS J114447.77-430859.3: the most luminous quasar in...Sérgio Sacani
SMSS J114447.77-430859.3 (z = 0.83) has been identified in the SkyMapper Southern Survey as the most luminous quasar in
the last ∼ 9 Gyr . In this paper, we report on the eROSITA/Spectrum–Roentgen–Gamma (SRG) observations of the source from
the eROSITA All Sky Survey, along with presenting results from recent monitoring performed using Swift, XMM-Newton, and
NuSTAR. The source shows a clear variability by factors of ∼10 and ∼2.7 overtime-scales of a year and of a few days,respectively.
When fit with an absorbed power law plus high-energy cutoff, the X-ray spectra reveal a = 2.2 ± 0.2 and Ecut = 23+26
−5 keV
. Assuming Comptonization, we estimate a coronal optical depth and electron temperature of τ = 2.5 − 5.3 (5.2 − 8) and
kT = 8 − 18 (7.5 − 14) keV , respectively, for a slab (spherical) geometry. The broadband SED is successfully modelled by
assuming either a standard accretion disc illuminated by a central X-ray source, or a thin disc with a slim disc emissivity profile.
The former model results in a black hole mass estimate of the order of 1010 M , slightly higher than prior optical estimates;
meanwhile, the latter model suggests a lower mass. Both models suggest sub-Eddington accretion when assuming a spinning
black hole, and a compact (∼ 10 rg ) X-ray corona. The measured intrinsic column density and the Eddington ratio strongly
suggest the presence of an outflow driven by radiation pressure. This is also supported by variation of absorption by an order of
magnitude over the period of ∼ 900 d .
The fornax deep_survey_with_vst_i_the_extended_and_diffuse_stellar_halo_of_ng...Sérgio Sacani
We have started a new deep, multi-imaging survey of the Fornax cluster, dubbed Fornax Deep
Survey (FDS), at the VLT Survey Telescope. In this paper we present the deep photometry inside
two square degrees around the bright galaxy NGC 1399 in the core of the cluster. We found that
the core of the Fornax cluster is characterised by a very extended and diffuse envelope surrounding
the luminous galaxy NGC 1399: we map the surface brightness out to 33 arcmin (∼ 192 kpc)
from the galaxy center and down to μg ∼ 31 mag arcsec−2 in the g band. The deep photometry
allows us to detect a faint stellar bridge in the intracluster region on the west side of NGC 1399
and towards NGC 1387. By analyzing the integrated colors of this feature, we argue that it
could be due to the ongoing interaction between the two galaxies, where the outer envelope of
NGC 1387 on its east side is stripped away. By fitting the light profile, we found that exists a
physical break radius in the total light distribution at R = 10 arcmin (∼ 58 kpc) that sets the
transition region between the bright central galaxy and the outer exponential halo, and that the
stellar halo contributes for 60% of the total light of the galaxy (Sec. 3.5). We discuss the main
implications of this work on the build-up of the stellar halo at the center of the Fornax cluster.
By comparing with the numerical simulations of the stellar halo formation for the most massive
BCGs (i.e. 13 < logM200/M⊙ < 14), we find that the observed stellar halo mass fraction is
consistent with a halo formed through the multiple accretion of progenitors with stellar mass in
the range 108 − 1011 M⊙. This might suggest that the halo of NGC 1399 has also gone through
a major merging event. The absence of a significant number of luminous stellar streams and
tidal tails out to 192 kpc suggests that the epoch of this strong interaction goes back to an early
formation epoch. Therefore, differently from the Virgo cluster, the extended stellar halo around
NGC 1399 is characterised by a more diffuse and well-mixed component, including the ICL.
A Chandra X-ray study of millisecond pulsars in the globular cluster Omega Ce...Sérgio Sacani
Millisecond pulsars (MSPs) are faint X-ray sources commonly observed in Galactic globular clusters (GCs). In this work, we
investigate 18 MSPs newly found in the GC Omega Centauri (𝜔 Cen) and search for their X-ray counterparts using Chandra
observations with a total exposure time of 290.9 ks. We identify confident X-ray counterparts for 11 of the MSPs, with 9 of
them newly identified in this work based on their positions, spectral properties, and X-ray colours. The X-ray spectra of 9 MSPs
are well described by a neutron star hydrogen atmosphere model, while 2 MSPs are well fitted by a power-law model. The
identified MSPs have X-ray luminosities ranging from 1.0 × 1030 erg s−1
to 1.4 × 1031 erg s−1
. Additionally, for population
comparison purposes, we study the X-ray counterpart to MSP E in the GC M71, and find its X-ray spectrum is well described
by blackbody-like models with a luminosity of 1.9 × 1030 erg s−1
. We investigate the empirical correlations between X-ray
luminosities and minimum companion masses, as well as mass functions, of spider pulsars. Clear correlations are observed, with
best-fit functions of log10 𝐿𝑋 = (1.0 ± 0.1) log10 𝑀𝑐,𝑚𝑖𝑛 + (32.5 ± 0.2) and log10 𝐿𝑋 = (0.35 ± 0.04) log10 MF + (32.71 ± 0.20),
respectively, with an intrinsic scatter of log10 𝐿𝑋 of ∼0.3, where 𝐿𝑋 is the 0.5–10 keV X-ray luminosity, 𝑀𝑐,𝑚𝑖𝑛 is the minimum
companion mass, and MF represents the mass function, in solar masses.
We report the discovery of spiral galaxies that are as optically luminous as elliptical brightest cluster
galaxies, with r-band monochromatic luminosity Lr = 8 14L (4:3 7:5 1044 erg s 1). These
super spiral galaxies are also giant and massive, with diameter D = 57 134 kpc and stellar mass
Mstars = 0:3 3:4 1011M. We nd 53 super spirals out of a complete sample of 1616 SDSS
galaxies with redshift z < 0:3 and Lr > 8L. The closest example is found at z = 0:089. We use
existing photometry to estimate their stellar masses and star formation rates (SFRs). The SDSS
and WISE colors are consistent with normal star-forming spirals on the blue sequence. However, the
extreme masses and rapid SFRs of 5 65M yr 1 place super spirals in a sparsely populated region
of parameter space, above the star-forming main sequence of disk galaxies. Super spirals occupy a
diverse range of environments, from isolation to cluster centers. We nd four super spiral galaxy
systems that are late-stage major mergers{a possible clue to their formation. We suggest that super
spirals are a remnant population of unquenched, massive disk galaxies. They may eventually become
massive lenticular galaxies after they are cut o from their gas supply and their disks fade.
The vvv survey_reveals_classical_cepheids_tracing_a_young_and_thin_stellar_di...Sérgio Sacani
Com o auxílio do telescópio VISTA instalado no Observatório do Paranal do ESO, astrônomos descobriram uma componente anteriormente desconhecida da Via Láctea. Ao mapear a localização de uma classe de estrelas que variam em brilho chamadas Cefeidas, foi descoberto um disco de estrelas jovens enterradas por trás de espessas nuvens de poeira no bojo central.
O rastreio público do ESO VISTA Variables in the Vía Láctea (VVV) [1] usa o telescópio VISTA instalado no Observatório do Paranal para obter imagens múltiplas em épocas diferentes das regiões centrais da nossa Galáxia nos comprimentos de onda do infravermelho [2]. O rastreio está descobrindo uma enorme quantidade de novos objetos, incluindo estrelas variáveis, aglomerados e estrelas em explosão (eso1101, eso1128, eso1141).
Uma equipe de astrônomos, liderada por Istvan Dékány da Pontificia Universidad Católica de Chile, utilizou dados deste rastreio, obtidos entre 2010 e 2014, para fazer uma descoberta notável — um componente anteriormente desconhecido da Via Láctea, a Galáxia que nos acolhe.
Hubble Space Telescope Observations of NGC 253 Dwarf Satellites: Three Ultra-...Sérgio Sacani
We present deep Hubble Space Telescope (HST) imaging of five faint dwarf galaxies associated with the nearby
spiral NGC 253 (D ≈ 3.5 Mpc). Three of these are newly discovered dwarf galaxies, while all five were found in
the Panoramic Imaging Survey of Centaurus and Sculptor, a Magellan+Megacam survey to identify faint dwarfs
and other substructures in resolved stellar light around massive galaxies outside of the Local Group. Our HST data
reach 3 magnitudes below the tip of the red giant branch for each dwarf, allowing us to derive their distances,
structural parameters, and luminosities. All five systems contain mostly old, metal-poor stellar populations
(age ∼12 Gyr, [M/H] −1.5) and have sizes (rh ∼ 110–3000 pc) and luminosities (MV ∼ −7 to −12 mag) largely
consistent with Local Group dwarfs. The three new NGC 253 satellites are among the faintest systems discovered
beyond the Local Group. We also use archival H I data to place limits on the gas content of our discoveries. Deep
imaging surveys such as our program around NGC 253 promise to elucidate the faint end of the satellite luminosity
function and its scatter across a range of galaxy masses, morphologies, and environments in the decade to come
Observation of Io’s Resurfacing via Plume Deposition Using Ground-based Adapt...Sérgio Sacani
Since volcanic activity was first discovered on Io from Voyager images in 1979, changes
on Io’s surface have been monitored from both spacecraft and ground-based telescopes.
Here, we present the highest spatial resolution images of Io ever obtained from a groundbased telescope. These images, acquired by the SHARK-VIS instrument on the Large
Binocular Telescope, show evidence of a major resurfacing event on Io’s trailing hemisphere. When compared to the most recent spacecraft images, the SHARK-VIS images
show that a plume deposit from a powerful eruption at Pillan Patera has covered part
of the long-lived Pele plume deposit. Although this type of resurfacing event may be common on Io, few have been detected due to the rarity of spacecraft visits and the previously low spatial resolution available from Earth-based telescopes. The SHARK-VIS instrument ushers in a new era of high resolution imaging of Io’s surface using adaptive
optics at visible wavelengths.
Earliest Galaxies in the JADES Origins Field: Luminosity Function and Cosmic ...Sérgio Sacani
We characterize the earliest galaxy population in the JADES Origins Field (JOF), the deepest
imaging field observed with JWST. We make use of the ancillary Hubble optical images (5 filters
spanning 0.4−0.9µm) and novel JWST images with 14 filters spanning 0.8−5µm, including 7 mediumband filters, and reaching total exposure times of up to 46 hours per filter. We combine all our data
at > 2.3µm to construct an ultradeep image, reaching as deep as ≈ 31.4 AB mag in the stack and
30.3-31.0 AB mag (5σ, r = 0.1” circular aperture) in individual filters. We measure photometric
redshifts and use robust selection criteria to identify a sample of eight galaxy candidates at redshifts
z = 11.5 − 15. These objects show compact half-light radii of R1/2 ∼ 50 − 200pc, stellar masses of
M⋆ ∼ 107−108M⊙, and star-formation rates of SFR ∼ 0.1−1 M⊙ yr−1
. Our search finds no candidates
at 15 < z < 20, placing upper limits at these redshifts. We develop a forward modeling approach to
infer the properties of the evolving luminosity function without binning in redshift or luminosity that
marginalizes over the photometric redshift uncertainty of our candidate galaxies and incorporates the
impact of non-detections. We find a z = 12 luminosity function in good agreement with prior results,
and that the luminosity function normalization and UV luminosity density decline by a factor of ∼ 2.5
from z = 12 to z = 14. We discuss the possible implications of our results in the context of theoretical
models for evolution of the dark matter halo mass function.
THE IMPORTANCE OF MARTIAN ATMOSPHERE SAMPLE RETURN.Sérgio Sacani
The return of a sample of near-surface atmosphere from Mars would facilitate answers to several first-order science questions surrounding the formation and evolution of the planet. One of the important aspects of terrestrial planet formation in general is the role that primary atmospheres played in influencing the chemistry and structure of the planets and their antecedents. Studies of the martian atmosphere can be used to investigate the role of a primary atmosphere in its history. Atmosphere samples would also inform our understanding of the near-surface chemistry of the planet, and ultimately the prospects for life. High-precision isotopic analyses of constituent gases are needed to address these questions, requiring that the analyses are made on returned samples rather than in situ.
Multi-source connectivity as the driver of solar wind variability in the heli...Sérgio Sacani
The ambient solar wind that flls the heliosphere originates from multiple
sources in the solar corona and is highly structured. It is often described
as high-speed, relatively homogeneous, plasma streams from coronal
holes and slow-speed, highly variable, streams whose source regions are
under debate. A key goal of ESA/NASA’s Solar Orbiter mission is to identify
solar wind sources and understand what drives the complexity seen in the
heliosphere. By combining magnetic feld modelling and spectroscopic
techniques with high-resolution observations and measurements, we show
that the solar wind variability detected in situ by Solar Orbiter in March
2022 is driven by spatio-temporal changes in the magnetic connectivity to
multiple sources in the solar atmosphere. The magnetic feld footpoints
connected to the spacecraft moved from the boundaries of a coronal hole
to one active region (12961) and then across to another region (12957). This
is refected in the in situ measurements, which show the transition from fast
to highly Alfvénic then to slow solar wind that is disrupted by the arrival of
a coronal mass ejection. Our results describe solar wind variability at 0.5 au
but are applicable to near-Earth observatories.
Gliese 12 b: A Temperate Earth-sized Planet at 12 pc Ideal for Atmospheric Tr...Sérgio Sacani
Recent discoveries of Earth-sized planets transiting nearby M dwarfs have made it possible to characterize the
atmospheres of terrestrial planets via follow-up spectroscopic observations. However, the number of such planets
receiving low insolation is still small, limiting our ability to understand the diversity of the atmospheric
composition and climates of temperate terrestrial planets. We report the discovery of an Earth-sized planet
transiting the nearby (12 pc) inactive M3.0 dwarf Gliese 12 (TOI-6251) with an orbital period (Porb) of 12.76 days.
The planet, Gliese 12 b, was initially identified as a candidate with an ambiguous Porb from TESS data. We
confirmed the transit signal and Porb using ground-based photometry with MuSCAT2 and MuSCAT3, and
validated the planetary nature of the signal using high-resolution images from Gemini/NIRI and Keck/NIRC2 as
well as radial velocity (RV) measurements from the InfraRed Doppler instrument on the Subaru 8.2 m telescope
and from CARMENES on the CAHA 3.5 m telescope. X-ray observations with XMM-Newton showed the host
star is inactive, with an X-ray-to-bolometric luminosity ratio of log 5.7 L L X bol » - . Joint analysis of the light
curves and RV measurements revealed that Gliese 12 b has a radius of 0.96 ± 0.05 R⊕,a3σ mass upper limit of
3.9 M⊕, and an equilibrium temperature of 315 ± 6 K assuming zero albedo. The transmission spectroscopy metric
(TSM) value of Gliese 12 b is close to the TSM values of the TRAPPIST-1 planets, adding Gliese 12 b to the small
list of potentially terrestrial, temperate planets amenable to atmospheric characterization with JWST.
Gliese 12 b, a temperate Earth-sized planet at 12 parsecs discovered with TES...Sérgio Sacani
We report on the discovery of Gliese 12 b, the nearest transiting temperate, Earth-sized planet found to date. Gliese 12 is a
bright (V = 12.6 mag, K = 7.8 mag) metal-poor M4V star only 12.162 ± 0.005 pc away from the Solar system with one of the
lowest stellar activity levels known for M-dwarfs. A planet candidate was detected by TESS based on only 3 transits in sectors
42, 43, and 57, with an ambiguity in the orbital period due to observational gaps. We performed follow-up transit observations
with CHEOPS and ground-based photometry with MINERVA-Australis, SPECULOOS, and Purple Mountain Observatory,
as well as further TESS observations in sector 70. We statistically validate Gliese 12 b as a planet with an orbital period of
12.76144 ± 0.00006 d and a radius of 1.0 ± 0.1 R⊕, resulting in an equilibrium temperature of ∼315 K. Gliese 12 b has excellent
future prospects for precise mass measurement, which may inform how planetary internal structure is affected by the stellar
compositional environment. Gliese 12 b also represents one of the best targets to study whether Earth-like planets orbiting cool
stars can retain their atmospheres, a crucial step to advance our understanding of habitability on Earth and across the galaxy.
The importance of continents, oceans and plate tectonics for the evolution of...Sérgio Sacani
Within the uncertainties of involved astronomical and biological parameters, the Drake Equation
typically predicts that there should be many exoplanets in our galaxy hosting active, communicative
civilizations (ACCs). These optimistic calculations are however not supported by evidence, which is
often referred to as the Fermi Paradox. Here, we elaborate on this long-standing enigma by showing
the importance of planetary tectonic style for biological evolution. We summarize growing evidence
that a prolonged transition from Mesoproterozoic active single lid tectonics (1.6 to 1.0 Ga) to modern
plate tectonics occurred in the Neoproterozoic Era (1.0 to 0.541 Ga), which dramatically accelerated
emergence and evolution of complex species. We further suggest that both continents and oceans
are required for ACCs because early evolution of simple life must happen in water but late evolution
of advanced life capable of creating technology must happen on land. We resolve the Fermi Paradox
(1) by adding two additional terms to the Drake Equation: foc
(the fraction of habitable exoplanets
with significant continents and oceans) and fpt
(the fraction of habitable exoplanets with significant
continents and oceans that have had plate tectonics operating for at least 0.5 Ga); and (2) by
demonstrating that the product of foc
and fpt
is very small (< 0.00003–0.002). We propose that the lack
of evidence for ACCs reflects the scarcity of long-lived plate tectonics and/or continents and oceans on
exoplanets with primitive life.
A Giant Impact Origin for the First Subduction on EarthSérgio Sacani
Hadean zircons provide a potential record of Earth's earliest subduction 4.3 billion years ago. Itremains enigmatic how subduction could be initiated so soon after the presumably Moon‐forming giant impact(MGI). Earlier studies found an increase in Earth's core‐mantle boundary (CMB) temperature due to theaccumulation of the impactor's core, and our recent work shows Earth's lower mantle remains largely solid, withsome of the impactor's mantle potentially surviving as the large low‐shear velocity provinces (LLSVPs). Here,we show that a hot post‐impact CMB drives the initiation of strong mantle plumes that can induce subductioninitiation ∼200 Myr after the MGI. 2D and 3D thermomechanical computations show that a high CMBtemperature is the primary factor triggering early subduction, with enrichment of heat‐producing elements inLLSVPs as another potential factor. The models link the earliest subduction to the MGI with implications forunderstanding the diverse tectonic regimes of rocky planets.
Climate extremes likely to drive land mammal extinction during next supercont...Sérgio Sacani
Mammals have dominated Earth for approximately 55 Myr thanks to their
adaptations and resilience to warming and cooling during the Cenozoic. All
life will eventually perish in a runaway greenhouse once absorbed solar
radiation exceeds the emission of thermal radiation in several billions of
years. However, conditions rendering the Earth naturally inhospitable to
mammals may develop sooner because of long-term processes linked to
plate tectonics (short-term perturbations are not considered here). In
~250 Myr, all continents will converge to form Earth’s next supercontinent,
Pangea Ultima. A natural consequence of the creation and decay of Pangea
Ultima will be extremes in pCO2 due to changes in volcanic rifting and
outgassing. Here we show that increased pCO2, solar energy (F⨀;
approximately +2.5% W m−2 greater than today) and continentality (larger
range in temperatures away from the ocean) lead to increasing warming
hostile to mammalian life. We assess their impact on mammalian
physiological limits (dry bulb, wet bulb and Humidex heat stress indicators)
as well as a planetary habitability index. Given mammals’ continued survival,
predicted background pCO2 levels of 410–816 ppm combined with increased
F⨀ will probably lead to a climate tipping point and their mass extinction.
The results also highlight how global landmass configuration, pCO2 and F⨀
play a critical role in planetary habitability.
Constraints on Neutrino Natal Kicks from Black-Hole Binary VFTS 243Sérgio Sacani
The recently reported observation of VFTS 243 is the first example of a massive black-hole binary
system with negligible binary interaction following black-hole formation. The black-hole mass (≈10M⊙)
and near-circular orbit (e ≈ 0.02) of VFTS 243 suggest that the progenitor star experienced complete
collapse, with energy-momentum being lost predominantly through neutrinos. VFTS 243 enables us to
constrain the natal kick and neutrino-emission asymmetry during black-hole formation. At 68% confidence
level, the natal kick velocity (mass decrement) is ≲10 km=s (≲1.0M⊙), with a full probability distribution
that peaks when ≈0.3M⊙ were ejected, presumably in neutrinos, and the black hole experienced a natal
kick of 4 km=s. The neutrino-emission asymmetry is ≲4%, with best fit values of ∼0–0.2%. Such a small
neutrino natal kick accompanying black-hole formation is in agreement with theoretical predictions.
Detectability of Solar Panels as a TechnosignatureSérgio Sacani
In this work, we assess the potential detectability of solar panels made of silicon on an Earth-like
exoplanet as a potential technosignature. Silicon-based photovoltaic cells have high reflectance in the
UV-VIS and in the near-IR, within the wavelength range of a space-based flagship mission concept
like the Habitable Worlds Observatory (HWO). Assuming that only solar energy is used to provide
the 2022 human energy needs with a land cover of ∼ 2.4%, and projecting the future energy demand
assuming various growth-rate scenarios, we assess the detectability with an 8 m HWO-like telescope.
Assuming the most favorable viewing orientation, and focusing on the strong absorption edge in the
ultraviolet-to-visible (0.34 − 0.52 µm), we find that several 100s of hours of observation time is needed
to reach a SNR of 5 for an Earth-like planet around a Sun-like star at 10pc, even with a solar panel
coverage of ∼ 23% land coverage of a future Earth. We discuss the necessity of concepts like Kardeshev
Type I/II civilizations and Dyson spheres, which would aim to harness vast amounts of energy. Even
with much larger populations than today, the total energy use of human civilization would be orders of
magnitude below the threshold for causing direct thermal heating or reaching the scale of a Kardashev
Type I civilization. Any extraterrrestrial civilization that likewise achieves sustainable population
levels may also find a limit on its need to expand, which suggests that a galaxy-spanning civilization
as imagined in the Fermi paradox may not exist.
Jet reorientation in central galaxies of clusters and groups: insights from V...Sérgio Sacani
Recent observations of galaxy clusters and groups with misalignments between their central AGN jets
and X-ray cavities, or with multiple misaligned cavities, have raised concerns about the jet – bubble
connection in cooling cores, and the processes responsible for jet realignment. To investigate the
frequency and causes of such misalignments, we construct a sample of 16 cool core galaxy clusters and
groups. Using VLBA radio data we measure the parsec-scale position angle of the jets, and compare
it with the position angle of the X-ray cavities detected in Chandra data. Using the overall sample
and selected subsets, we consistently find that there is a 30% – 38% chance to find a misalignment
larger than ∆Ψ = 45◦ when observing a cluster/group with a detected jet and at least one cavity. We
determine that projection may account for an apparently large ∆Ψ only in a fraction of objects (∼35%),
and given that gas dynamical disturbances (as sloshing) are found in both aligned and misaligned
systems, we exclude environmental perturbation as the main driver of cavity – jet misalignment.
Moreover, we find that large misalignments (up to ∼ 90◦
) are favored over smaller ones (45◦ ≤ ∆Ψ ≤
70◦
), and that the change in jet direction can occur on timescales between one and a few tens of Myr.
We conclude that misalignments are more likely related to actual reorientation of the jet axis, and we
discuss several engine-based mechanisms that may cause these dramatic changes.
The solar dynamo begins near the surfaceSérgio Sacani
The magnetic dynamo cycle of the Sun features a distinct pattern: a propagating
region of sunspot emergence appears around 30° latitude and vanishes near the
equator every 11 years (ref. 1). Moreover, longitudinal flows called torsional oscillations
closely shadow sunspot migration, undoubtedly sharing a common cause2. Contrary
to theories suggesting deep origins of these phenomena, helioseismology pinpoints
low-latitude torsional oscillations to the outer 5–10% of the Sun, the near-surface
shear layer3,4. Within this zone, inwardly increasing differential rotation coupled with
a poloidal magnetic field strongly implicates the magneto-rotational instability5,6,
prominent in accretion-disk theory and observed in laboratory experiments7.
Together, these two facts prompt the general question: whether the solar dynamo is
possibly a near-surface instability. Here we report strong affirmative evidence in stark
contrast to traditional models8 focusing on the deeper tachocline. Simple analytic
estimates show that the near-surface magneto-rotational instability better explains
the spatiotemporal scales of the torsional oscillations and inferred subsurface
magnetic field amplitudes9. State-of-the-art numerical simulations corroborate these
estimates and reproduce hemispherical magnetic current helicity laws10. The dynamo
resulting from a well-understood near-surface phenomenon improves prospects
for accurate predictions of full magnetic cycles and space weather, affecting the
electromagnetic infrastructure of Earth.
Extensive Pollution of Uranus and Neptune’s Atmospheres by Upsweep of Icy Mat...Sérgio Sacani
In the Nice model of solar system formation, Uranus and Neptune undergo an orbital upheaval,
sweeping through a planetesimal disk. The region of the disk from which material is accreted by
the ice giants during this phase of their evolution has not previously been identified. We perform
direct N-body orbital simulations of the four giant planets to determine the amount and origin of solid
accretion during this orbital upheaval. We find that the ice giants undergo an extreme bombardment
event, with collision rates as much as ∼3 per hour assuming km-sized planetesimals, increasing the
total planet mass by up to ∼0.35%. In all cases, the initially outermost ice giant experiences the
largest total enhancement. We determine that for some plausible planetesimal properties, the resulting
atmospheric enrichment could potentially produce sufficient latent heat to alter the planetary cooling
timescale according to existing models. Our findings suggest that substantial accretion during this
phase of planetary evolution may have been sufficient to impact the atmospheric composition and
thermal evolution of the ice giants, motivating future work on the fate of deposited solid material.
Exomoons & Exorings with the Habitable Worlds Observatory I: On the Detection...Sérgio Sacani
The highest priority recommendation of the Astro2020 Decadal Survey for space-based astronomy
was the construction of an observatory capable of characterizing habitable worlds. In this paper series
we explore the detectability of and interference from exomoons and exorings serendipitously observed
with the proposed Habitable Worlds Observatory (HWO) as it seeks to characterize exoplanets, starting
in this manuscript with Earth-Moon analog mutual events. Unlike transits, which only occur in systems
viewed near edge-on, shadow (i.e., solar eclipse) and lunar eclipse mutual events occur in almost every
star-planet-moon system. The cadence of these events can vary widely from ∼yearly to multiple events
per day, as was the case in our younger Earth-Moon system. Leveraging previous space-based (EPOXI)
lightcurves of a Moon transit and performance predictions from the LUVOIR-B concept, we derive
the detectability of Moon analogs with HWO. We determine that Earth-Moon analogs are detectable
with observation of ∼2-20 mutual events for systems within 10 pc, and larger moons should remain
detectable out to 20 pc. We explore the extent to which exomoon mutual events can mimic planet
features and weather. We find that HWO wavelength coverage in the near-IR, specifically in the 1.4 µm
water band where large moons can outshine their host planet, will aid in differentiating exomoon signals
from exoplanet variability. Finally, we predict that exomoons formed through collision processes akin
to our Moon are more likely to be detected in younger systems, where shorter orbital periods and
favorable geometry enhance the probability and frequency of mutual events.
Emergent ribozyme behaviors in oxychlorine brines indicate a unique niche for...Sérgio Sacani
Mars is a particularly attractive candidate among known astronomical objects
to potentially host life. Results from space exploration missions have provided
insights into Martian geochemistry that indicate oxychlorine species, particularly perchlorate, are ubiquitous features of the Martian geochemical landscape. Perchlorate presents potential obstacles for known forms of life due to
its toxicity. However, it can also provide potential benefits, such as producing
brines by deliquescence, like those thought to exist on present-day Mars. Here
we show perchlorate brines support folding and catalysis of functional RNAs,
while inactivating representative protein enzymes. Additionally, we show
perchlorate and other oxychlorine species enable ribozyme functions,
including homeostasis-like regulatory behavior and ribozyme-catalyzed
chlorination of organic molecules. We suggest nucleic acids are uniquely wellsuited to hypersaline Martian environments. Furthermore, Martian near- or
subsurface oxychlorine brines, and brines found in potential lifeforms, could
provide a unique niche for biomolecular evolution.
Continuum emission from within the plunging region of black hole discsSérgio Sacani
The thermal continuum emission observed from accreting black holes across X-ray bands has the potential to be leveraged as a
powerful probe of the mass and spin of the central black hole. The vast majority of existing ‘continuum fitting’ models neglect
emission sourced at and within the innermost stable circular orbit (ISCO) of the black hole. Numerical simulations, however,
find non-zero emission sourced from these regions. In this work, we extend existing techniques by including the emission
sourced from within the plunging region, utilizing new analytical models that reproduce the properties of numerical accretion
simulations. We show that in general the neglected intra-ISCO emission produces a hot-and-small quasi-blackbody component,
but can also produce a weak power-law tail for more extreme parameter regions. A similar hot-and-small blackbody component
has been added in by hand in an ad hoc manner to previous analyses of X-ray binary spectra. We show that the X-ray spectrum
of MAXI J1820+070 in a soft-state outburst is extremely well described by a full Kerr black hole disc, while conventional
models that neglect intra-ISCO emission are unable to reproduce the data. We believe this represents the first robust detection of
intra-ISCO emission in the literature, and allows additional constraints to be placed on the MAXI J1820 + 070 black hole spin
which must be low a• < 0.5 to allow a detectable intra-ISCO region. Emission from within the ISCO is the dominant emission
component in the MAXI J1820 + 070 spectrum between 6 and 10 keV, highlighting the necessity of including this region. Our
continuum fitting model is made publicly available.
WASP-69b’s Escaping Envelope Is Confined to a Tail Extending at Least 7 RpSérgio Sacani
Studying the escaping atmospheres of highly irradiated exoplanets is critical for understanding the physical
mechanisms that shape the demographics of close-in planets. A number of planetary outflows have been observed
as excess H/He absorption during/after transit. Such an outflow has been observed for WASP-69b by multiple
groups that disagree on the geometry and velocity structure of the outflow. Here, we report the detection of this
planet’s outflow using Keck/NIRSPEC for the first time. We observed the outflow 1.28 hr after egress until the
target set, demonstrating the outflow extends at least 5.8 × 10⁵ km or 7.5 Rp This detection is significantly longer
than previous observations, which report an outflow extending ∼2.2 planet radii just 1 yr prior. The outflow is
blueshifted by −23 km s−1 in the planetary rest frame. We estimate a current mass-loss rate of 1 M⊕ Gyr−1
. Our
observations are most consistent with an outflow that is strongly sculpted by ram pressure from the stellar wind.
However, potential variability in the outflow could be due to time-varying interactions with the stellar wind or
differences in instrumental precision.
X-rays from a Central “Exhaust Vent” of the Galactic Center ChimneySérgio Sacani
Using deep archival observations from the Chandra X-ray Observatory, we present an analysis of
linear X-ray-emitting features located within the southern portion of the Galactic center chimney,
and oriented orthogonal to the Galactic plane, centered at coordinates l = 0.08◦
, b = −1.42◦
. The
surface brightness and hardness ratio patterns are suggestive of a cylindrical morphology which may
have been produced by a plasma outflow channel extending from the Galactic center. Our fits of the
feature’s spectra favor a complex two-component model consisting of thermal and recombining plasma
components, possibly a sign of shock compression or heating of the interstellar medium by outflowing
material. Assuming a recombining plasma scenario, we further estimate the cooling timescale of this
plasma to be on the order of a few hundred to thousands of years, leading us to speculate that a
sequence of accretion events onto the Galactic Black Hole may be a plausible quasi-continuous energy
source to sustain the observed morphology
We all have good and bad thoughts from time to time and situation to situation. We are bombarded daily with spiraling thoughts(both negative and positive) creating all-consuming feel , making us difficult to manage with associated suffering. Good thoughts are like our Mob Signal (Positive thought) amidst noise(negative thought) in the atmosphere. Negative thoughts like noise outweigh positive thoughts. These thoughts often create unwanted confusion, trouble, stress and frustration in our mind as well as chaos in our physical world. Negative thoughts are also known as “distorted thinking”.
How to Create Map Views in the Odoo 17 ERPCeline George
The map views are useful for providing a geographical representation of data. They allow users to visualize and analyze the data in a more intuitive manner.
Welcome to TechSoup New Member Orientation and Q&A (May 2024).pdfTechSoup
In this webinar you will learn how your organization can access TechSoup's wide variety of product discount and donation programs. From hardware to software, we'll give you a tour of the tools available to help your nonprofit with productivity, collaboration, financial management, donor tracking, security, and more.
The French Revolution, which began in 1789, was a period of radical social and political upheaval in France. It marked the decline of absolute monarchies, the rise of secular and democratic republics, and the eventual rise of Napoleon Bonaparte. This revolutionary period is crucial in understanding the transition from feudalism to modernity in Europe.
For more information, visit-www.vavaclasses.com
The Roman Empire A Historical Colossus.pdfkaushalkr1407
The Roman Empire, a vast and enduring power, stands as one of history's most remarkable civilizations, leaving an indelible imprint on the world. It emerged from the Roman Republic, transitioning into an imperial powerhouse under the leadership of Augustus Caesar in 27 BCE. This transformation marked the beginning of an era defined by unprecedented territorial expansion, architectural marvels, and profound cultural influence.
The empire's roots lie in the city of Rome, founded, according to legend, by Romulus in 753 BCE. Over centuries, Rome evolved from a small settlement to a formidable republic, characterized by a complex political system with elected officials and checks on power. However, internal strife, class conflicts, and military ambitions paved the way for the end of the Republic. Julius Caesar’s dictatorship and subsequent assassination in 44 BCE created a power vacuum, leading to a civil war. Octavian, later Augustus, emerged victorious, heralding the Roman Empire’s birth.
Under Augustus, the empire experienced the Pax Romana, a 200-year period of relative peace and stability. Augustus reformed the military, established efficient administrative systems, and initiated grand construction projects. The empire's borders expanded, encompassing territories from Britain to Egypt and from Spain to the Euphrates. Roman legions, renowned for their discipline and engineering prowess, secured and maintained these vast territories, building roads, fortifications, and cities that facilitated control and integration.
The Roman Empire’s society was hierarchical, with a rigid class system. At the top were the patricians, wealthy elites who held significant political power. Below them were the plebeians, free citizens with limited political influence, and the vast numbers of slaves who formed the backbone of the economy. The family unit was central, governed by the paterfamilias, the male head who held absolute authority.
Culturally, the Romans were eclectic, absorbing and adapting elements from the civilizations they encountered, particularly the Greeks. Roman art, literature, and philosophy reflected this synthesis, creating a rich cultural tapestry. Latin, the Roman language, became the lingua franca of the Western world, influencing numerous modern languages.
Roman architecture and engineering achievements were monumental. They perfected the arch, vault, and dome, constructing enduring structures like the Colosseum, Pantheon, and aqueducts. These engineering marvels not only showcased Roman ingenuity but also served practical purposes, from public entertainment to water supply.
The Art Pastor's Guide to Sabbath | Steve ThomasonSteve Thomason
What is the purpose of the Sabbath Law in the Torah. It is interesting to compare how the context of the law shifts from Exodus to Deuteronomy. Who gets to rest, and why?
Students, digital devices and success - Andreas Schleicher - 27 May 2024..pptxEduSkills OECD
Andreas Schleicher presents at the OECD webinar ‘Digital devices in schools: detrimental distraction or secret to success?’ on 27 May 2024. The presentation was based on findings from PISA 2022 results and the webinar helped launch the PISA in Focus ‘Managing screen time: How to protect and equip students against distraction’ https://www.oecd-ilibrary.org/education/managing-screen-time_7c225af4-en and the OECD Education Policy Perspective ‘Students, digital devices and success’ can be found here - https://oe.cd/il/5yV
Basic phrases for greeting and assisting costumers
A spectroscopic sample_of_massive_galaxies
1. Submitted to ApJ September 6, 2013
A
Preprint typeset using L TEX style emulateapj v. 5/2/11
A SPECTROSCOPIC SAMPLE OF MASSIVE, EVOLVED z ∼ 2 GALAXIES: IMPLICATIONS FOR THE
EVOLUTION OF THE MASS–SIZE RELATION1
J.-K. Krogager2,3 , A. W. Zirm2 , S. Toft2 , A. Man2 , G. Brammer3,4
arXiv:1309.6316v1 [astro-ph.CO] 24 Sep 2013
Submitted to ApJ September 6, 2013
ABSTRACT
We present deep, near-infrared HST/WFC3 grism spectroscopy and imaging for a sample of 16
galaxies at z ≈ 2 in the COSMOS field selected by the presence of the 4000 ˚ break. This sample
A
significantly increases the number of spectroscopically confirmed evolved galaxies at this redshift
with accurate structural measurements. Moreover, this sample is the first representative sample of
spectroscopically confirmed galaxies at z ∼ 2. By combining the grism observations with photometry
in 30 bands, we derive accurate constraints on their redshifts, stellar masses, ages, dust extinction
and formation redshifts. We fit the rest-frame optical surface brightness profiles, and show that these
are well described by compact, high-n S´rsic models. We show that the slope and scatter of the z ∼ 2
e
mass–size relation of quiescent galaxies is consistent with the local relation, and confirm previous
findings that the sizes for a given mass are smaller by a factor of two to three. Finally, we show that
the observed evolution of the mass–size relation of quiescent galaxies between z = 2 and 0 can be
explained by quenching of increasingly larger star-forming galaxies, at a rate dictated by the increase
in the number density of quiescent galaxies with decreasing redshift. However, we find that the scatter
in the mass–size relation should increase in the quenching-driven scenario in contrast to what is seen
in the data. This suggests that merging is not needed to explain the evolution of the mean mass–size
relation of massive galaxies, but may still be required to tighten its scatter, and explain the size growth
of individual z = 2 galaxies quiescent galaxies.
Subject headings: galaxies: formation — galaxies: high-redshift — cosmology: observations
1. INTRODUCTION
Over the past decade, studies of the z ∼ 2 Universe have been revolutionized by the availability of deep
near-infrared (NIR) imaging surveys. One of the primary early results was the discovery of a population of
optically-faint, massive galaxies which are missed in optical (rest-frame UV) surveys (Franx et al. 2003; Daddi
et al. 2004; Wuyts et al. 2007). Large photometric surveys have since shown that at z = 2, roughly half of the
most massive (log M/M > 11) galaxies are dusty and
star-forming, and half are old, quiescent systems (e.g.
Franx et al. 2008; Toft et al. 2009; Williams et al. 2010;
Brammer et al. 2011), a result that has been confirmed
through low resolution spectroscopy of a small sample of
the brightest examples (Kriek et al. 2008, 2009a,b).
Using high-resolution NIR imaging, it was shown that
most of the quiescent galaxies at z > 2 have effective
radii, re , a factor of 2 − 6 smaller than local elliptical
galaxies with the same stellar masses (e.g., Daddi et al.
2005; Trujillo et al. 2006; Zirm et al. 2007; Toft et al.
2007; van Dokkum et al. 2008; Szomoru et al. 2010; Cassata et al. 2011). Their inferred stellar mass densities
(within re ) therefore greatly exceed those of local galaxies at the same stellar mass. However, recent studies
show that if one compares the stellar densities within
1 Based on observations carried out under programs #12177,
12328 with the Wide Field Camera 3 installed on the Hubble
Space Telescope.
2 Dark Cosmology Centre, Niels Bohr Institute, University of
Copenhagen, Juliane Maries Vej 30, DK-2100 Copenhagen O
3 European Southern Observatory, Alonso de C´rdova 3107,
o
Casilla 19001, Vitacura, Santiago, Chile
4 Space Telescope Science Institute, 3700 San Martin Drive,
Baltimore, MD21210, USA
the inner 1 kpc the discrepancy is much less pronounced
(Bezanson et al. 2009; Patel et al. 2013). The discovery that the inner regions of these massive galaxies correspond well with their local counterparts supports the
so-called inside-out scenario, in which galaxies form at
high redshift as compact galaxies presumably from a gas
rich merger funneling the gas to the center and igniting
a massive, compact star burst (e.g., Hopkins et al. 2006;
Wuyts et al. 2010). These resulting compact stellar cores
subsequently grow by adding mass to their outer regions.
How this size growth is accomplished is the big question;
A cascade of merger events with smaller systems, known
as minor merging, is a plausible explanation as simulations have shown that it is possible to obtain the needed
mass increase in the outer regions while leaving the central core mostly intact (Oser et al. 2012). However, observations of the merger rate of massive galaxies between
z = 2 and 0 do not find as many mergers as required to
account for the observed size evolution (Man et al. 2012;
Newman et al. 2012).
Recently, studies of high-redshift galaxies have suggested that their structure may differ from that of local
elliptical galaxies when quantified using a S´rsic profile.
e
The high-z galaxies show lower S´rsic indices (n ∼ 2 on
e
average) than the local population of ellipticals (n ∼ 4).
This has motivated suggestions that the high-z population might be more disc-like and hence might contain a faint, extended stellar component which would be
undetected in present observations due to cosmological
surface-brightness dimming (van der Wel et al. 2011), but
deeper and higher resolution imaging, along with image
stacking, has confirmed that the massive, red galaxies indeed are compact, and has failed to detect any extended
2. 2
Krogager et al.
stellar haloes around these compact cores (van Dokkum
et al. 2008, 2010).
Now, with the advent of the next generation of NIR
spectrographs on 8-m class telescopes, we can study the
stellar populations via continuum detections and absorption line indices (Toft et al. 2012; Onodera et al. 2012; van
de Sande et al. 2013, Zirm et al. in prep); The quiescent
galaxies can be further sub-divided into post-starbursts
(those that show strong Balmer absorption lines) and
more evolved systems with metal absorption lines. However, even with state-of-the-art instrumentation, target
samples are limited to the rare and bright examples.
Grism spectroscopy from space with Hubble Space
Telescope (HST) allows us to obtain redshifts for fainter,
less massive examples of z ∼ 2 galaxies. While these data
have poor spectral resolution, they do not suffer from
the strong atmospheric emission lines, poor transmission
and bright background that limit ground-based observations. A near-infrared spectroscopy survey, 3D-HST, has
recently been carried out using the Wide Field Camera
3 (WFC3) onboard the HST. The survey provides imaging in the F140W-band and grism observations in the
G141 grism. In total the survey will provide rest-frame
optical spectra of ∼7000 galaxies in the redshift range
from z = 1 − 3.5. Moreover, the pointings cover approximately three quarters of the deep NIR survey, CANDELS
(Grogin et al. 2011; Koekemoer et al. 2011). The combination of imaging and spectroscopic data from 3D-HST
and CANDELS allows for powerful analysis of the redshift 1 < z < 3.5 Universe. For more details about the
3D-HST survey, see Brammer et al. (2012).
We have searched the public 3D-HST data in the COSMOS field to identify a sample of galaxies with indications of a strong 4000 ˚ break, redshifted to the waveA
length covered by the grism observations (corresponding
to 1.86 < z < 2.75). Our selection is motivated by the
correlation between population age and the strength of
the 4000 ˚ break, allowing us to select a population of
A
evolved, massive galaxies. The presence of the break
also serves as a direct indicator that enables us to derive accurate spectroscopic redshifts which in turn allow for stronger constraints on parameters of the stellar
populations than what is possible with broad-band photometry alone. Until now, spectroscopic samples of quiescent, high-redshift galaxies with structural parameter
data are sparse; van Dokkum et al. (2008) presented a
sample of nine galaxies at z ∼ 2, recently Gobat et al.
(2013) presented five quiescent galaxies from a protocluster at z = 2, and at slightly lower redshifts Onodera
et al. (2012) presented sample of 18 quiescent galaxies
at z ∼ 1.6. Samples of z ∼ 2 quiescent galaxies with
measured velocity dispersions and dynamical masses are
even smaller; so far only four examples have been published (van Dokkum et al. 2009; Onodera et al. 2010; van
de Sande et al. 2011; Toft et al. 2012). With our selection, we increase the sample size of z ∼ 2 galaxies with
spectroscopic redshifts significantly by adding 16 galaxies, and with these data, we are able to go deeper allowing us to get a more representative sample. By inferring
sizes, redshifts, and stellar population parameters including age, star-formation rate, and mass, we are able to
populate the mass–size relation using a mass-complete,
quiescent sample of galaxies at z ∼ 2. This provides
strong constraints on what drives the size evolution of
the massive galaxies. We explore different physical explanations for the apparent size growth. Specifically, we
create a simplistic model to investigate the effect of ”dilution”, i.e., addition of newly quenched, larger galaxies
to the mass–size relation, a mechanism proposed by previous studies (Cassata et al. 2011; Trujillo et al. 2012;
Poggianti et al. 2013) and recently investigated in detail
out to redshift z ∼ 1 by Carollo et al. (2013).
The paper is organized as follows: In section 2 we
present the data used in our analysis, in section 3 we describe the selection of our sample before presenting the
results of our analysis in section 4, in section 5 we investigate the mass–size relation and describe our model for
size evolution driven by quenching, and finally we discuss
the implications in section 6.
Throughout this paper, we assume a flat cosmology
with ΩΛ = 0.73, Ωm = 0.27 and a Hubble constant of
H0 = 71 km s−1 Mpc−1 .
2. DATA
The analysis is based on public grism spectroscopy
data from the 3D-HST survey from which we have used
25 pointings in the COSMOS field. We have combined
the spectroscopic data with photometric data in 30 bands
covering 0.15–24 µm from the latest Ks -selected catalog
by Muzzin et al. (2013).
The 25 pointings in COSMOS are covered by imaging in the F140W filter and by NIR spectroscopy using the G141 grism providing wavelength coverage from
1.1 µm to 1.6 µm with a spectral resolution of R ∼ 300
(for a point source) with a sampling of 46.5 ˚ per pixel.
A
Since these are slitless spectroscopic data the effective
resolution depends on the size and morphology of the
dispersed source. Furthermore, we have used the two
epochs of WFC3/F160W (H160 ) images from the public
CANDELS (Grogin et al. 2011; Koekemoer et al. 2011)
survey to constrain the structural parameters of our sample sources.
2.1. Data reduction
Each pointing was observed in a four-point dither pattern with half-pixel offsets in order to increase the resolution of the final image. Both the undispersed, direct
images and the dispersed grism images were observed
with this pattern for a total exposure of around 800 sec
and 4700 sec for undispersed and dispersed, respectively.
The data sets were reduced using the publicly available
pipeline threedhst 5 (Brammer et al. 2012). The pipeline
handles the combination and reduction of the dithered
exposures, source identification using SExtractor, and
extraction of the individual spectra. Since we are dealing
with slitless spectroscopy some sources will have spatially
overlapping spectra. This is handled in the pipeline and
each extracted spectrum is provided with an estimate of
the amount of contamination from nearby sources. For
our analysis, we have subtracted the contaminating flux
from the total extracted flux.
We have used the standard extraction parameters in
the pipeline except for the final pixel scale used in the
call to the iraf-task multidrizzle, where we chose
5
http://code.google.com/p/threedhst
3. 3
3. SAMPLE SELECTION
In total we ended up with 10 239 extracted spectra.
Many of these were very low signal-to-noise ratio (SNR)
spectra (SNR < 1.0, averaged over the entire spectrum),
corrupted extractions of objects near the CCD edge, or
low-redshift objects. Our first selection criterion was
therefore to quantify the significance of each spectrum using the method described by Pirzkal et al. (2004). They
define the net significance of a spectrum, N , as the maximum value of the cumulative sum of the sorted signalto-noise spectrum.
In order to cut down the sample size we invoked
a few quality cuts. For a source to be accepted in
our sample, its net significance had to be larger than
200. This corresponds roughly to a cut in terms of
H-band magnitude, H
24.5. We required that at
least 80per cent of the pixels were well-defined, i.e.,
non-zero and non-negative. In some cases where the
objects were located close to the edge of the CCD some
light was dispersed out over the edges, and hence the
spectral range was reduced in those cases. By only
allowing spectra with more than 80per cent well-defined
pixels, we ensured that our targets were fully covered
in the wavelength range from 1.1–1.6 µm. Moreover,
we computed the integrated amount of contaminating
flux and compared this to the integrated total flux and
removed sources for which the contamination was higher
than 50per cent. We then matched our extracted spectra
by coordinates to the photometry from the Ks -band
selected catalog. Photometric redshifts for targets in the
catalog were determined with the eazy code (Brammer
et al. 2008).
Our main selection criterion was to look for the 4000
˚ break in the spectra. We here followed the definition
A
of D(4000) from Bruzual A. (1983) using the broad 200
˚ bins to measure the blue and red continuum on either
A
side of the break (see also Hamilton 1985). We used this
broad definition due to the low resolution and low SNR.
In order to have sufficient quality data in the blue part
of the spectrum, where the targets are typically fainter,
we removed candidates with a SNR per pixel averaged
over the whole spectrum of less than 2. When searching
for detections of the break, i.e., more than 1 σ detections,
we implemented a third control bin red-wards of the red
continuum bin in order to sort out broadened emission
lines and spurious jumps in the data.
2.6
2.4
2.2
zphot
0. 09 px−1 instead of 0. 06 px−1 . This was chosen to
reduce the noise in the extracted spectra. For further
details about the observations and data reduction see
Brammer et al. (2012). We used a detection threshold of
4 σ to identify sources in the F140W images.
After the initial reduction we encountered some issues
with the background not being flat. We were not able to
correct this gradient sufficiently to recover a completely
flat background, which meant that some spectra were
disregarded due to background issues. However, when
we increased the pixel size from 0. 06 px−1 to 0. 09 px−1
the noise decreased and the background subtraction was
performed more successfully. In the process of selecting
our sample we removed two sources due to backgroundsubtraction issues. In these cases there were discontinuities in the background, that we could not correct for.
2.0
1.8
1.6
1.6
1.8
2.0
zspec
2.2
2.4
2.6
Figure 1. Spectroscopic redshift vs. photometric redshift for our
sample of galaxies. The dashed line indicates the one-to-one relation. Photometric redshifts have been obtained using the code
Eazy.
The galaxies in the sample with photometric redshifts
zphot < 1.5 were then thrown away since we were looking
for galaxies with breaks within our spectral range, corresponding to redshifts in the range of 1.86 < z < 2.75.
We made the cut in redshift at 1.5 in order not to discard galaxies with underestimated photometric redshifts.
The sources that showed a break in the spectrum were
then compared to their broad band spectral energy distributions (SEDs) by scaling the spectra to the J-band,
which is fully covered by G141. We scaled the spectra
to correct for possible over-subtraction of contamination
and to account for the loss of flux due to the limitations
of the spectral extraction aperture. Candidates with a
significant discrepancy (more than 1σ) between the Hband flux and the flux in the spectrum at the corresponding wavelengths were discarded. This discrepancy either
stems from unaccounted for contamination or an uneven
background subtraction. Finally, we checked how well
the contamination (if any) had been subtracted. We discarded the most heavily contaminated spectra and the
spectra where the contamination had been subtracted
incorrectly leaving gaps and holes in the extracted spectra. This was done by visual inspection as not only
the amount of contamination is important, but also the
shape of the contaminating flux. In some cases the contaminating flux can enhance or even create a break in the
spectrum, and this is difficult to quantify in a comparable
way for all targets.
The properties of the final sample consisting of 16
galaxies are summarized in Table 1.
4. RESULTS
4.1. Spectral fitting
All galaxies in our sample were fitted by the fast code
(Kriek et al. 2009b). The code performs template fitting
combining the photometric data with our grism spectra using exponentially declining star-formation histories, stellar population synthesis models by Bruzual &
Charlot (2003) and a Chabrier (2003) initial mass function. Before fitting the spectra we binned them into 20
bins with bin-sizes of ∼ 250 ˚. We did this to avoid
A
being affected by morphological broadening which arises
6. 6
Krogager et al.
due to the fact that we are using slitless spectroscopy
on extended objects. The resulting effective resolution is
R ∼ 50.
We fitted the galaxies two times using fast: The first
time we allowed the redshifts to vary and kept the parameter grid coarse. We did this to get a description
of the model spectrum for each target, which we then
used to improve the best fitting redshift. By shifting the
best fitting model in redshift with respect to the observed
spectrum, we were able to obtain a spectro-photometric
redshift with an error of σz /(z + 1) = 0.01, determined
by the break position or other visible features. Figure 1
shows the spectroscopic redshifts versus the photometric redshifts. The spectroscopic redshifts agree well with
the photometric redshifts from eazy, only one target is
significantly off the one-to-one relation (ID #125158).
In the second fit we fixed the redshift to the spectrophotometric redshift determined above and refined
the parameter grid in terms of age, which was constrained
to be less than the age of the Universe at the given redshift, star formation time-scale τ , and dust extinction,
AV . All fits were performed with variable metallicity
among four discrete values: Z = 0.004, 0.008, 0.02, 0.05.
The spectroscopic redshift, parameters from the fits and
the measurements of D(4000) are summarized in Table 2.
Figure 2 shows the individual spectra and SEDs along
with their best fitting template. In Fig. 3, we show the
distribution of stellar ages, masses, circularized effective
radii, and formation redshifts. In each panel, we show
an estimate of the probability density (indicated by the
solid line), which we calculated from the observed distribution of parameters smoothed by a Gaussian kernel (for
details, see Bashtannyk & Hyndman 2001). The density
estimate helps to show the distribution in a way that is
independent of binning.
Our sample is quite homogeneous in terms of age and
mass with an average age and stellar mass of, respectively, 1 Gyr and 1011 M . The size distribution shows
hints of bi-modality, which is most likely caused by the
few star-forming galaxies in our sample that are expected to, and indeed, have larger sizes at a given redshift (e.g., Newman et al. 2012). In Table 2, we give
the best-fit metallicities from fast. Although in many
cases the metallicity is unconstrained in the range from
Z = 0.004 − 0.050, we find that all galaxies except two
have metallicities consistent with solar (Z = 0.020). This
is also reflected in the average metallicity given in Table 2; Z = 0.024. As mentioned, only two galaxies have constraints on Z that are inconsistent with solar; #124686 has sub-solar metallicity, Z < 0.01, and
#134068 has super-solar metallicity, Z > 0.04.
4.2. Structural Fitting
We have obtained the structural parameters for the
galaxies with galfit (Peng et al. 2002) using a single
S´rsic component. This provides us with the paramee
ters S´rsic n, half-light major axis ae in pixels, and axis
e
ratio b/a. The sizes quoted in table 3 are circularized
(re = ae b/a) half-light radii in kpc, throughout the
rest of the paper, circularized radii will be used. We
used 8 × 8 arcsec2 cutouts in the fit and adjacent objects
were fitted simultaneously by either a S´rsic profile or as
e
point sources. In two cases the fit was not able to con-
Table 3
Structural parameters from GALFIT.
ID
121761
122398
124482
124666
124686
125158
127466
128061
128093
128790
129022
134068
134082
134713
137561
140122
Stack
∗
S´rsic n
e
5.8 ± 1.6
6.3 ± 2.2
2.8 ± 0.6
1.00∗
7.2 ± 2.1
5.0 ± 1.1
7.8 ± 2.1
5.2 ± 1.2
4.00∗
2.0 ± 0.1
3.5 ± 0.8
–
1.5 ± 0.2
5.0 ± 1.1
1.5 ± 0.4
5.3 ± 1.6
6.3 ± 0.7
re
(kpc)
1.2 ± 0.2
1.5 ± 0.2
0.8 ± 0.2
3.7 ± 0.4
1.7 ± 0.2
2.9 ± 0.2
1.1 ± 0.2
2.8 ± 0.2
1.4 ± 0.1
1.1 ± 0.1
1.4 ± 0.1
–
1.3 ± 0.2
3.9 ± 0.5
0.7 ± 0.1
1.6 ± 0.2
1.6 ± 0.1
b/a
0.81 ± 0.07
0.67 ± 0.08
0.79 ± 0.08
0.72 ± 0.04
0.85 ± 0.08
0.79 ± 0.06
0.76 ± 0.15
0.85 ± 0.05
0.55 ± 0.06
0.86 ± 0.07
0.83 ± 0.08
–
0.81 ± 0.05
0.87 ± 0.05
0.52 ± 0.12
0.75 ± 0.09
0.8 ± 0.1
Sources where n was fixed to get the fit to converge.
verge with the nearby objects being fit simultaneously
(objects #124666 and #128061). We therefore used the
SExtractor segmentation map to mask out the nearby
objects. For each source we simulated the PSF at every
position of the dither pattern using tinytim (Krist et al.
2011). We then combined these ”raw” PSFs in the same
way as the data images using the multidrizzle algorithm. The PSF for some of the sources were not able
to be simulated in this way because the object was located at the edge of the CCD in one or more exposures.
For these sources we used a PSF from a target with similar CCD coordinates, i.e., within 100 pixels. In two cases
(see the caption of table. 3) the fit did not converge when
we allowed all parameters to vary. We therefore fixed n
at either 1, 2, 3 or 4 and picked the best-fitting model
out of these four.
In order to estimate the effect of the chosen PSF on
the parameters we fitted all sources with all the available
PSFs. This gave us a measure of the robustness of the fit.
The parameters from the fits are summarized in Table 3.
The quoted parameters and their errors are given as the
best fit and standard deviation of all the different fits
for each source. We have also computed the stellar mass
density within the half-light radius from the fit given by:
Σ50 =
0.5M
.
2
π re
(1)
The densities are listed in Table 2.
4.3. Stacking of Data
We now investigate the sample in more detail by stacking the spectra and the H160 images in order to look for
weak features in the sample, e.g., faint outskirts of the
galaxies missed in the individual S´rsic fits.
e
7. 7
3.0
14
Normalized Distribution
2.5
N =4
Hδ
12
2.0
Hγ
Star Forming
Hβ
10
8
1.5
6
4
0.5
2
8.6 8.8 9.0 9.2 9.4
log(age / yr)
log(M
M
Normalized Distribution
1.0
10.6 10.8 11.0 11.2 11.4 11.6
⋆ / ⊙)
0.8
0.6
0.4
0.2
0.0
0
fλ [10−19 erg s−1 cm−2
0.0
Å−1 ]
1.0
0
14
2
3
size / kpc
4
5 2
3
z4
form
5
6
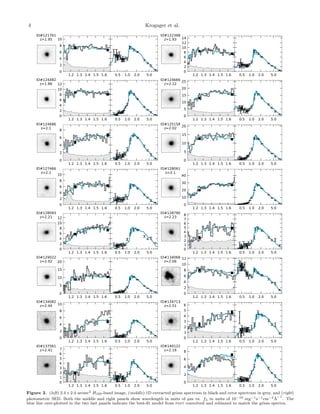
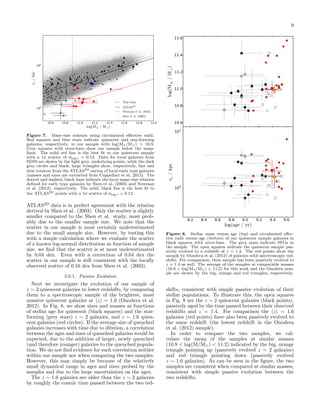
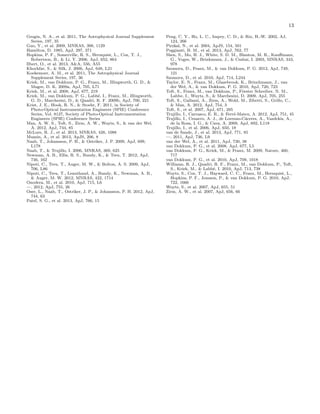
Figure 3. Histograms of the population parameters for our sample. The solid line shows the kernel density estimate of the given
parameter. The top row shows the logarithm of stellar ages in units
or years and the logarithm of stellar masses in units of M . The
bottom row shows circularized effective radii in units of kpc and
formation redshifts.
4.3.1. Spectral Stacking
For the spectral stacking, we have divided the sample
into two sub-samples: star-forming (SFG) and quiescent
(QG) galaxies. The SFGs are defined as having a constrained specific star formation rate (sSFR) from the fit
larger than log(sSFR / yr−1 ) > −10.7. The quiescent
galaxies constitute the rest of the sample. Two objects
in our sample (#124666 and #137561) have sSFRs from
the fit that are right on the border between SFG and
QG. In these cases we have looked at their confidence intervals to decide in which category they most likely fall;
#124666 is a SFG and #137561 is most likely a QG.
We have excluded two objects from the stack; Object
#128093 was excluded due to the poorer photometry,
which impacts both the sSFR and the redshift precision,
object #129022 was excluded due to the irregularities in
its spectrum. We have stacked the spectra by interpolating the rest frame spectra onto a common wavelength
grid, which corresponds to the rest frame pixel size (15 ˚)
A
at the mean redshift of the stack (z = 2.1). We then
combined the spectra by median combination in order to
decrease the influence of outliers in the stack. The two
stacks along with the full stack of both subsamples are
shown in Fig. 4. In the quiescent stack, we see tentative
indications of absorption from the Balmer Hγ line, but
no signs of Hδ in absorption. Both lines are expected to
be present in stellar populations where the last burst of
star formation ended around 1 − 2 Gyr ago. The fact
that we do not see Hδ in absorption can be explained by
4000 4200 4400 4600 4800 Quiescent
5000 5200
λ [Å]
Hβ
Hδ
Hγ
3800
N =14
4000 4200 4400 4600 4800 All
5000 5200
λ [Å]
Hβ
Hδ
Hγ
12
10
8
6
4
2
0
14
12
1
3800
N =10
10
8
6
4
2
0
3800 4000 4200 4400 4600 4800 5000 5200
λ [Å]
Figure 4. Stacks of the spectra from our sample divided into Star
Forming (top), Quiescent (middle), and all (bottom) galaxies. See
the text for definition of the sub-samples. Each figure shows the
rest frame stacked spectrum. The position of the three Balmer
lines, Hβ, Hγ and Hδ, are indicated by the dashed lines, and the
continuum bins used for calculating D(4000) are indicated by the
shaded regions with the continuum level in each bin shown as the
thick black horizontal line. In the upper left corner the number of
galaxies in each stack is indicated.
the low resolution and the poor sampling of the spectra
as this will blend together the D(4000) feature and the
Hδ line. We clearly see a strong break at 4000 ˚ for the
A
QGs, D(4000) = 1.54 ± 0.01, indicative of an evolved
stellar population. The stack confirms the homogeneity
seen in the derived stellar ages: 0.6–2 Gyr. On the contrary, the star forming stack shows a shallower break,
Dn (4000) = 1.35 ± 0.03, and tentative signs of Hδ in absorption, but no signs of Hγ nor Hβ. This may be caused
by the mix of an evolved, underlying population with a
younger, star-forming population. The individual SEDs
of the four SFGs show signs of these mixed populations,
see Fig. 2.
4.3.2. Stacking of H160 -Images
In order to characterize our sample in terms of structural parameters we also stacked the individual H160 images of the quiescent galaxies. We masked out any
nearby objects using SExtractor segmentation maps with
a low detection threshold of 1.5 σ to ensure that faint
objects did not enter the stack. We then aligned all the
8. 8
Krogager et al.
Data
Model
Residuals
Ilbert et al. 2013
This work
Scaled COSMOS
10
8
Figure 5. Stack of H160 images of the quiescent galaxies in the
sample. Each panel shows a 2.5 × 2.5 arcsec2 cutout. The panels
show left to right; the stacked data, the model, and the residuals
from galfit.
images and stacked them normalizing each source by the
mean flux in the sample.
We then followed the same method as in our previous
analysis, fitting the stack with all available PSFs and
then estimating the errors on the parameters from all
the individual fits. The parameters for the stack are
indicated in Table 3. We found that the circularized
effective radius for the stack was re = 1.6 ± 0.1 kpc. We
furthermore found a very high S´rsic index (n = 6.3) and
e
no indications of faint outskirts in the stacked images in
agreement with other studies (e.g., van Dokkum et al.
2008, 2010; Szomoru et al. 2012). The stacked image
and the galfit model and residuals are shown in Fig. 5.
4.4. Mass Completeness
We assessed the completeness of our sample by comparing to the recent work of Ilbert et al. (2013) who
investigated the mass function from UltraVISTA data.
In Fig. 6, we show the data from stellar masses of our
sample in the grey histogram where the error-bars represent the Poisson error of the number in each bin. The
black line is the mass distribution of galaxies in the entire COSMOS field with specific star formation rates
log(sSFR / yr−1 ) < −10.0, which correspond well with
the sSFRs of our sample. The mass distribution from
the entire COSMOS field has only been rescaled to match
the area of COSMOS that is covered by 3D-HST (∼ 2%).
The solid blue line is the Schechter function from Ilbert
et al. (2013) for quiescent galaxies scaled to match the
COSMOS distribution, and the grey dashed line shows
the mass distribution density estimate of our sample.
Due to the low number of galaxies in our sample it
is difficult to asses the completeness in a quantitative
manner. However, the agreement of both the observed
mass distribution in COSMOS and the UltraVISTA mass
function with our data for stellar masses above 1011 M
is reassuring that our sample is reasonably representative
of the massive, quiescent galaxies around z ≈ 2.
5. THE MASS–SIZE RELATION
We have used our sample of spectroscopically confirmed galaxies at redshift z ≈ 2 to investigate the mass–
size relation at high redshift. We parameterize the relation for quiescent galaxies following Newman et al.
(2012) and others:
re = γ
M
11 M
10
β
= γ Mβ .
11
(2)
We fit the relation to the data using χ2 minimization
without taking the errors into account since the scatter dominates the relation. In the minimization we vary
N
6
4
2
0
10.8
11.0
11.2
log(M ⋆ / M ⊙)
11.4
11.6
Figure 6. Distribution of stellar mass in our sample represented
by the histograms and the kernel density estimate shown in the
grey, dashed line. We compare to the stellar mass function from
Ilbert et al. (2013) (blue line) and to the distribution of quiescent
galaxies (sSFR<0.1 Gyr−1 ) from the COSMOS field scaled to the
area that is covered by the 3D-HST survey (∼ 2%).
the two fit parameters; slope (β) and mass-normalized
size (γ). In Sect. 4.4, we have estimated that our sample is complete only for masses larger than ∼ 1011 M ,
and hence we only fit the relation for the galaxies in
our sample that fulfill log(M ) > 10.9. Furthermore, as
this relation is only defined quiescent galaxies we disregard the two star-forming galaxies above the masslimit. The best-fitting values to our quiescent galaxies
are: β = 0.51 ± 0.32 and log(γ/kpc) = 0.17 ± 0.05 with a
scatter of σlog re = 0.12 dex. The slope of our best fit is
poorly constrained due to the low number of data points;
however, the best-fitting value is in good agreement with
the local slope found by various authors, e.g., Shen et al.
(2003) find βz=0 = 0.56, see also Guo et al. (2009) and
Newman et al. (2012).
In Fig. 7, we show our sample of quiescent galaxies above the mass-limit of log(M/M ) > 10.9 in red
squares. The blue stars show the two star-forming galaxies above the mass-limit and the grey points with errorbars show the sample below the mass-limit (dashed vertical line). We compare our data to local SDSS data
with S´rsic index n > 2.5 (light grey, underlying dise
tribution) and local early type galaxies with kinematical data (slow and fast rotators in dark grey circles and
black triangles, respectively) from ATLAS3D (Cappellari
et al. 2011). In order to compare our high redshift sample to the that of the ATLAS3D -team we fit the powerlaw relation given above to their data using the same
mass-limit as for our data. From the best fit to the combined sample of fast and slow rotators, we find the following slope of β0 = 0.56 ± 0.04, a mass-normalized size
of log(γ0 /kpc) = 0.61 ± 0.01, and a scatter of σ0 = 0.12.
For this analysis, we have used the tabulated values from
Cappellari et al. (2013). Specifically, we note that we
used the log(r1/2 ) to infer the sizes.
It is clearly visible that the quiescent galaxies from
this work are smaller than local quiescent galaxies for a
given mass. Moreover, the figure shows that the various
samples of local galaxies infer slightly different normalizations of the relation. The relation derived from the
9. 9
11.6
11.4
re / kpc
log(M ⋆ / M ⊙)
101
This work
ATLAS3D
Newman et al. (2012)
Shen et al. (2003)
100
10.6
10.8
11.0
11.2
11.4
log(M / M )
11.6
11.8
11.2
11.0
10.8
12.0
10.6
ATLAS3D data is in perfect agreement with the relation
derived by Shen et al. (2003). Only the scatter is slightly
smaller compared to the Shen et al. study, most probably due to the smaller sample size. We note that the
scatter in our sample is most certainly underestimated
due to the small sample size. However, by testing this
with a simple calculation where we evaluate the scatter
of a known log-normal distribution as function of sample
size, we find that the scatter is at most underestimated
by 0.04 dex. Even with a correction of 0.04 dex the
scatter in our sample is still consistent with the locally
observed scatter of 0.16 dex from Shen et al. (2003).
5.0.1. Passive Evolution
Next we investigate the evolution of our sample of
z ∼ 2 quiescent galaxies to lower redshifts, by comparing
them to a spectroscopic sample of the brightest, most
massive quiescent galaxies at z = 1.6 (Onodera et al.
2012). In Fig. 8, we show sizes and masses as functions
of stellar age for quiescent (black squares) and the starforming (grey stars) z ∼ 2 galaxies, and z ∼ 1.6 quiescent galaxies (red circles). If the average size of quenched
galaxies increases with time due to dilution, a correlation
between the ages and sizes of quenched galaxies would be
expected, due to the addition of larger, newly quenched
(and therefore younger) galaxies to the quenched population. We do not find evidence for such correlation neither
within our sample nor when comparing the two samples.
However, this may simply be because of the relatively
small dynamical range in ages and sizes probed by the
samples and due to the large uncertainties on the ages.
The z ∼ 1.6 galaxies are older than the z ∼ 2 galaxies
by roughly the cosmic time passed between the two red-
8.4
8.6
8.4
8.6
8.8
9.0
9.2
9.4
9.6
9.2
9.4
9.6
re / kpc
1
8.2
8.2
10
Figure 7. Mass–size relation using circularized effective radii.
Red squares and blue stars indicate quiescent and star-forming
galaxies, respectively, in our sample with log(M /M ) > 10.9.
Grey squares with error-bars show our sample below the masslimit. The solid red line is the best fit to our quiescent sample
with a 1σ scatter of σlog r = 0.12. Data for local galaxies from
SDSS are shown by the light grey, underlying points, while the dark
grey circles and black, large triangles show, respectively, fast and
slow rotators from the ATLAS3D survey of local early type galaxies
(masses and sizes are extracted from Cappellari et al. 2013). The
dotted and dashed, black lines indicate the local mass–size relation
defined for early type galaxies by Shen et al. (2003) and Newman
et al. (2012), respectively. The solid, black line is the best fit to
the ATLAS3D points with a 1σ scatter of σlog r = 0.12.
10
0
log(age / yr)
8.8
9.0
Figure 8. Stellar mass versus age (top) and circularized effective radii versus age (bottom) of our quiescent sample galaxies in
black squares with error-bars. The grey stars indicate SFGs in
the sample. The open squares indicate the quiescent sample passively evolved to a redshift of z = 1.4. The red points show the
sample by Onodera et al. (2012) of galaxies with spectroscopic redshifts. For comparison, their sample has been passively evolved to
z = 1.4 as well. The average of the samples at comparable masses
(10.8 < log(M /M ) < 11.2) for this work and the Onodera sample are shown by the big, orange and red triangles, respectively.
shifts, consistent with simple passive evolution of their
stellar populations. To illustrate this, the open squares
in Fig. 8 are the z ∼ 2 quiescent galaxies (black points),
passively aged by the time passed between their observed
redshifts and z = 1.4. For comparison the z = 1.6
galaxies (red points) have also been passively evolved to
the same redshift (the lowest redshift in the Onodera
et al. (2012) sample).
In order to compare the two samples, we calculate the mean of the samples at similar masses
(10.8 < log(M/M ) < 11.2) indicated by the big, orange
triangle pointing up (passively evolved z ∼ 2 galaxies)
and red triangle pointing down (passively evolved
z ∼ 1.6 galaxies). As can be seen in the figure, the two
samples are consistent when compared at similar masses,
consistent with simple passive evolution between the
two redshifts.
10. 10
Krogager et al.
5.0.2. Size Evolution
3.5
2.5
QGs, Brammer et al.
SFGs, Brammer et al.
1.0
1.2
Mpc−3
3.0
1.5
n / 10−4
2.0
1.5
1.0
0.5
0.0
5
Newman et al. (2012)
This work
Shen et al. (2003)
ATLAS 3D
1.0
1.2
1.5
Mean Size / kpc
4
3
2
1
σ−σz=2.4
We now take a closer look at the offset towards smaller
sizes visible in Fig.7 between our sample at high redshift
and the local sample. This offset has been studied in
great detail (e.g., Daddi et al. 2005; Trujillo et al. 2006;
Toft et al. 2007; Zirm et al. 2007; van Dokkum et al.
2008; Damjanov et al. 2011; Newman et al. 2012) and
various explanations have been put forward to explain
the required evolution in sizes, e.g., merging or feedback
from quasars (Fan, Lapi, De Zotti, & Danese 2008). We
here investigate a simple scenario in which the individual
galaxies themselves do not need to increase significantly
in size, but rather that the average of the population as
a whole increases (e.g., Cassata et al. 2011; Trujillo et al.
2012; Carollo et al. 2013; Poggianti et al. 2013). We use
our measurements of sizes and scatter at high redshift in
combinations with those from Newman et al. (2012) to
motivate the initial values for the size evolution.
Newman et al. (2012) study the size evolution of massive galaxies both star-forming and quiescent and find
that the star-forming galaxies on average are a factor
of 2 larger than the quiescent population at all times
above redshift z > 0.5. This is in good agreement with
the two star-forming galaxies in our sample (above our
mass completeness limit) that are a factor of 2 larger
than our quiescent sample (see Fig. 7). The evolution
of the mean size of quiescent galaxies might then simply be driven by the addition of larger, newly quenched
galaxies at lower redshifts to the already quenched population. Carollo et al. (2013) recently showed that the
evolution of the sizes of passively evolving galaxies at
z < 1 is driven by this ”dilution” of the compact population. In order to test this picture and evaluate the effect
on the scatter in sizes, we have taken the measured sizes
normalized to a stellar mass of 1011 M from Newman
et al. (2012) at redshift 2.0 < z < 2.5 and generated
an initial population of quiescent (QG) and star-forming
(SFG) galaxies taking into account the observed number
densities at that redshift for galaxies with comparable
masses from Brammer et al. (2011). We have shifted the
data from Newman et al. from a Salpeter IMF to the
assumed Chabrier IMF in this work. The distribution
of sizes for the populations are drawn from a log-normal
distribution with an average size initially dictated by the
observations for QGs while for SFGs we simply use the
fact that star-forming galaxies on average are twice as
big. Both distributions are assumed to have a scatter of
0.16 dex initially, motivated by the findings in this work.
We then simply assume that the SFGs at the given
redshift will be quenched after a fixed time, tquench , and
add them to the already existing population of quiescent
galaxies. For each time-step, we generate a new population of SFGs with a mean size that is twice as big as the
mean size of the quiescent galaxies already in place, and
after another tquench these will be added to the quiescent
population. The generated number in the SFG population varies according to the observed number density of
SFGs. We have assumed that the scatter of the SFG
population is constant with time and that no galaxygalaxy interactions occur, i.e., no new massive galaxies
form by merging of lower-mass galaxies. Furthermore,
we assume that galaxies maintain their sizes after they
have been quenched and that no further star formation
0.15
0.10
0.05
0.00
0.0
0.5
1.0
Redshift
1.5
2.0
2.5
Figure 9. (Top) Number density evolution with redshift. The red
and blue points show the observed number densities for quiescent
and star-forming galaxies, respectively, with masses log(M/M ) >
11 from Brammer et al. (2011). The black and grey, connected
points indicate our modeled evolution with varying quenching time
indicated in Gyr by the small number at each line. (Middle) Average size of the quiescent galaxy population at fixed mass of 1011 M
as function of redshift. The black and grey points are the same as in
the top plot. The red circles show the observations from Newman
et al. (2012), the cross and triangle are the local data from Shen
et al. (2003) and the ATLAS3D sample, and the blue square shows
the size of our sample. The grey filled area indicates the evolution
including fading of star-forming galaxies after quenching assuming
the same quenching times (see text for details). (Bottom) Modelled scatter as a function of redshift relative to the initial scatter
of 0.16 dex at redshift z = 2.4, the first redshift-bin from Brammer
et al. (2011).
occurs once the galaxies have been quenched. We run
this model three times for various quenching time-scales,
tquench : 1.0, 1.2, and 1.5 Gyr.
The results of this simple model are shown in Fig. 9.
The top panel shows the evolution in number density.
The red and blue points are data from Brammer et al.
(2011) for quiescent and star-forming galaxies, respectively. The black and grey points show the modeled evolution in the number density assuming different quenching times indicated in Gyr by the number at each of the
tracks. The middle panel shows the evolution in average size of the sample of quiescent galaxies. Data from
Newman et al. (2012) is shown in red circles, our sample
is indicated by the blue square, and the local size mea-
11. 11
surements from Shen et al. (2003) and ATLAS3D are
shown by the red plus and triangle, respectively. Again,
the black and grey points indicate the modeled evolution
at different quenching times. We performed a run where
we included an estimated decrease in effective radius after the star-forming discs have faded. This is shown in
Fig. 9 as the grey shaded area where the upper and lower
boundaries correspond to, respectively, tquench = 1.0 and
1.5 Gyr. We assumed that half of the star-forming population will be disc-dominated and that these will decrease
their effective radii up to 30 per cent. The bottom panel
shows the evolution of the scatter, σ, of the distribution of quiescent galaxies relative to the initial value at
z = 2.45.
From these assumptions, we are able to reproduce the
observed increase in number density and size of quiescent galaxies. However, the modeled scatter increases in
contrast with the constant scatter observed in this work.
6. DISCUSSION
The evolution of galaxies in the mass–size plane is undoubtedly influenced by merging, star-formation and its
cessation. As we increase the samples of well-studied,
spectroscopically confirmed galaxies over a range of redshifts we can forge new diagnostic tools to address the
weight with which each of these processes influences the
evolution of galaxies.
In Sect. 5, we investigated the relation between stellar
mass and half-light radius by parametrizing the relationship with a power-law. From the best fit to our quiescent grism sample we found the slope, β = 0.51, and the
scatter, σlog re = 0.12 dex, consistent with their z = 0
values. From the ATLAS3D data and from a large SDSS
sample from the work of Shen et al. (2003) and Newman et al. (2012), a local slope and scatter of β0 = 0.56
and σ0 = 0.12 − 0.16 dex was inferred. One complication in comparing samples of galaxies at different redshifts, and from different samples, lies in the fact that the
distinction between star-forming and quiescent galaxies
becomes less clear at higher redshifts. Various studies
use different criteria to define quiescence, e.g., a cut in
sSFR or rest-frame colors, which makes any comparison between different datasets non-trivial. Even at low
redshift, the classification of early type galaxies is performed in different ways. It is thus reassuring to see that
we get very consistent results from the SDSS data and
the ATLAS3D team.
The importance of a clean separation and definition of
star-forming and quiescent galaxies becomes clear when
we look at the scatter as a tool to unravel the evolution
in the mass–size relation, since the scatter is highly sensitive to outliers. Newman et al. (2012) find a scatter of
σlog re = 0.26 dex for galaxies at redshifts 2.0 < z < 2.5,
much higher than what we find in our data. The large
scatter observed in the Newman et al. sample may be
due, at least partly, to the uncertainty in photometric
redshifts and contamination from star-forming galaxies.
6.1. Mechanisms for size growth
In large photometric samples it has also been shown
that the slope of the mass–size relation evolves very little
from z ∼ 2 to z ∼ 0.2−0.4 despite there being strong redshift evolution of the galaxy distribution in the mass–size
plane (primarily a shift to larger sizes, see Newman et al.
2012, and McLure et al. (2013)). While the unchanging
slope may be theoretically plausible as the slope may reflect initial formation rather than subsequent evolution
(Ciotti, Lanzoni, & Volonteri 2007), the lack of evolution in the scatter observed in this work is puzzling. The
scatter about the mean mass–size relation should evolve
with redshift according to the underlying physical driver
for the evolution in the mass–size plane, i.e., merging,
quenching, or further star formation.
Merging will typically move galaxies to higher masses
and larger radii, with the direction and amplitude of the
change in the mass–size plane determined by the mass
ratio, orbital parameters and gas content of the merger
(Naab, Johansson, & Ostriker 2009). In gas-rich mergers,
the remnant may become more compact due to the gas
falling to the center, which leads to strong star formation activity. Star formation at later times (e.g., merger
induced) will increase the mass, alter the size depending
on the location of the star formation, and will decrease
the mean age of the sample of quiescent galaxies at subsequent redshifts.
Quenching of star-forming galaxies will conserve mass
while the individual galaxy sizes may even slightly
decrease (as low-surface brightness star-forming regions
fade) but is operating on a separate galaxy population
that has intrinsically larger sizes than most of the quiescent galaxies already in place (Khochfar & Silk 2006).
The addition of these quenched galaxies will then drive
the evolution of the mean size of the whole population
without changing the individual galaxies that have
already been quenched. However, it is still not entirely
clear what happens to star-forming galaxies after they
stop forming stars in terms of morphology and size; starforming galaxies show a variety of morphologies but the
quiescent population is more dominated by spheroidal
morphologies. Carollo et al. (2013) suggest that the
star-forming galaxies shrink by ∼ 30 per cent after they
get quenched presumably by fading of the star-forming
disc. We have assessed the effect of this fading of the
star-forming population on the size evolution of the
quiescent population in our toy model, see Fig. 9. We
assume that around 50 per cent of the star-forming
population will be dominated by a disc-like surface
brightness profile and hence only half the population
will be strongly affected by the disc-fading. Moreover,
the disc-like, star-forming galaxies will on average have
higher ellipticities than their quenched remnants, thus
the circularized effective radii will be affected less by the
fading of the disc component. However, assuming that
half the population decreases 30 per cent in size when
quenched we still are able to reproduce the size-increase
from z = 2.5 to z = 1, see grey shaded area in Fig. 9.
At later times the size-increase is not strong enough
due to the declining number of star-forming galaxies.
This is a quite conservative estimate as the details will
depend on quenching mechanism, bulge-to-disc ratio
and secular evolution and merging after quenching. We
note, however, that this is qualitatively a possible way
to reconcile the findings from Newman et al. (2012) who
are able to reproduce the size increase by minor merging
from z = 1 to z = 0, but fail to do so at earlier times.
12. 12
Krogager et al.
6.2. Evolution of the scatter in sizes
Each of the above processes, in addition to directing
the mass–size evolution, will affect the observed scatter
of the mass–size relation and its evolution in different
ways. Merging has been shown by Nipoti et al. (2012)
to increase the scatter in the mass–size relation. The
authors show that size evolution within a dissipationless (”dry”) merger-only scenario leads to significantly
higher scatter than is observed at z = 0 (Nipoti, Treu,
Leauthaud, Bundy, Newman, & Auger 2012). Mergers
are certainly on-going between z = 2 and z = 0 and
Nipoti et al. conclude that there must be a finely tuned
balance between the different processes in their merging
model in order to reproduce the tight observed relation
at z = 0. This type of fine tuning is not a general characteristic of the galaxy population(s) and is extremely
unlikely to persist in real-world systems. However, the
models by Nipoti et al. 2012 only consider dry mergers of
spheroids, which given the diverse population of galaxies
at high redshift is an unrealistic scenario.
In the case of ”dilution” of the population via quenching, the scatter will increase due to the addition of a
new population of larger, quiescent galaxies. By using
our toy model (see Sect. 5.0.2) for the quenching case,
we have shown that we are able to reproduce the observed increase in both number density and mean size of
quenched galaxies as functions of redshift out to z ∼ 2,
see Fig. 9. A similar result has been found by others,
e.g., Carollo et al. (2013) out to z ∼ 1. However, our
model shows that the scatter should increase by up to
∼ 0.1 dex in the redshift range, 0.4 < z < 2.5. This
is inconsistent with the observations presented here, i.e.,
that the observed scatter in sizes is consistent with being
constant from redshift z ≈ 2 to z = 0. With the effect of
disc-fading after quenching we still observe a significant
increase in the scatter, though smaller (∼ 0.05 dex).
So far, most studies have focused on the role of merging only, especially dry minor merging, as the driver of
size evolution since this mechanism is very efficient in
terms of increasing the size of a galaxy without adding
too much mass to the system (McLure et al. 2013). However, Nipoti et al. (2009, 2012) find that dry merging in
a ΛCDM cosmology is insufficient to explain the needed
increase in size. As we show with our model for size
evolution in Sect. 5.0.2, the addition of larger, quenched
galaxies means that each individual galaxy needs to undergo less size-evolution. The combination of different
galaxy-galaxy interactions, both gas-rich and gas-poor,
may then regulate the size-evolution of individual systems such that the scatter remains constant through
time. Also, individual systems must evolve at high redshift as such compact galaxies locally are very rare (Trujillo et al. 2009) and merging of galaxies is an obvious
mechanism for this evolution (Damjanov et al. 2009; Taylor et al. 2010; van de Sande et al. 2011; Toft et al. 2012).
A cascade of mergers is also the most likely way for galaxies to undergo morphological changes from clumpy and
in some cases disc-like at high redshift to spheroidal at
low redshift (Naab & Trujillo 2006; Ciotti et al. 2007;
Wuyts et al. 2010). In order to study the evolution
of galaxies and disentangle the various processes, high
resolution, cosmological simulations are needed, which
take into account both gas-rich and gas-poor galaxy in-
teractions on the entire population of star-forming and
quenched galaxies. These should be able to reproduce
the lack of evolution in the scatter of the sizes.
7. CONCLUSION
We have presented a spectroscopic sample of quiescent
galaxies at redshift z ≈ 2 with 12 targets (16 including
star-forming galaxies). We have shown that our sample is nearly complete for masses above log(M ) > 10.9.
We are therefore able to draw representative conclusions
about the population of quiescent galaxies. We find that
the galaxies are smaller than locally observed galaxies
by a factor of 2.5 on average, consistent with previous
results, and we show for the first time for a spectroscopic
sample that the slope and scatter of the mass–size relation at z = 2 are consistent with their local values. We
use the fact that the scatter remains constant from z = 2
to z = 0 as a tool to study the evolutionary mechanism
that drives the size-increase of this population. We find
that while the addition of larger galaxies quenched at
later times can explain the increase of the average size of
the population the scatter increases in contrast with the
results presented here. Other processes, such as the combined influence from dry and wet mergers, must therefore
be needed in order to keep the scatter constant and to
make the number density of the most compact galaxies
evolve in a way that is consistent with their rarity in the
local Universe.
The Dark Cosmology Centre is funded by the DNRF.
JK acknowledges support from an ESO studentship. ST
and AZ acknowledge support from the Lundbeck foundation. This work is based on observations taken by
the CANDELS Multi-Cycle Treasury Program with the
NASA/ESA HST, which is operated by the Association
of Universities for Research in Astronomy, Inc., under
NASA contract NAS5-26555.
REFERENCES
Bashtannyk, D. M., & Hyndman, R. J. 2001, Computational
Statistics & Data Analysis, 36, 279
Bezanson, R., van Dokkum, P. G., Tal, T., Marchesini, D., Kriek,
M., Franx, M., & Coppi, P. 2009, ApJ, 697, 1290
Brammer, G. B., van Dokkum, P. G., & Coppi, P. 2008, ApJ,
686, 1503
Brammer, G. B., et al. 2012, ApJS, 200, 13
—. 2011, ApJ, 739, 24
Bruzual, G., & Charlot, S. 2003, MNRAS, 344, 1000
Bruzual A., G. 1983, ApJ, 273, 105
Cappellari, M., et al. 2011, MNRAS, 413, 813
—. 2013, MNRAS, 432, 1709
Carollo, C. M., et al. 2013, preprint (arXiv:1302.5115)
Cassata, P., et al. 2011, ApJ, 743, 96
Chabrier, G. 2003, Publications of the Astronomical Society of
the Pacific, 115, 763
Ciotti, L., Lanzoni, B., & Volonteri, M. 2007, ApJ, 658, 65
Daddi, E., Cimatti, A., Renzini, A., Fontana, A., Mignoli, M.,
Pozzetti, L., Tozzi, P., & Zamorani, G. 2004, ApJ, 617, 746
Daddi, E., et al. 2005, ApJ, 626, 680
Damjanov, I., et al. 2011, ApJ, 739, L44
—. 2009, ApJ, 695, 101
Fan, L., Lapi, A., De Zotti, G., & Danese, L. 2008, ApJ, 689, L101
Franx, M., et al. 2003, ApJ, 587, L79
Franx, M., van Dokkum, P. G., Schreiber, N. M. F., Wuyts, S.,
Labb´, I., & Toft, S. 2008, ApJ, 688, 770
e
Gobat, R., et al. 2013, arXiv:1305.3576
13. 13
Grogin, N. A., et al. 2011, The Astrophysical Journal Supplement
Series, 197, 35
Guo, Y., et al. 2009, MNRAS, 398, 1129
Hamilton, D. 1985, ApJ, 297, 371
Hopkins, P. F., Somerville, R. S., Hernquist, L., Cox, T. J.,
Robertson, B., & Li, Y. 2006, ApJ, 652, 864
Ilbert, O., et al. 2013, A&A, 556, A55
Khochfar, S., & Silk, J. 2006, ApJ, 648, L21
Koekemoer, A. M., et al. 2011, The Astrophysical Journal
Supplement Series, 197, 36
Kriek, M., van Dokkum, P. G., Franx, M., Illingworth, G. D., &
Magee, D. K. 2009a, ApJ, 705, L71
Kriek, M., et al. 2008, ApJ, 677, 219
Kriek, M., van Dokkum, P. G., Labb´, I., Franx, M., Illingworth,
e
G. D., Marchesini, D., & Quadri, R. F. 2009b, ApJ, 700, 221
Krist, J. E., Hook, R. N., & Stoehr, F. 2011, in Society of
Photo-Optical Instrumentation Engineers (SPIE) Conference
Series, Vol. 8127, Society of Photo-Optical Instrumentation
Engineers (SPIE) Conference Series
Man, A. W. S., Toft, S., Zirm, A. W., Wuyts, S., & van der Wel,
A. 2012, ApJ, 744, 85
McLure, R. J., et al. 2013, MNRAS, 428, 1088
Muzzin, A., et al. 2013, ApJS, 206, 8
Naab, T., Johansson, P. H., & Ostriker, J. P. 2009, ApJ, 699,
L178
Naab, T., & Trujillo, I. 2006, MNRAS, 369, 625
Newman, A. B., Ellis, R. S., Bundy, K., & Treu, T. 2012, ApJ,
746, 162
Nipoti, C., Treu, T., Auger, M. W., & Bolton, A. S. 2009, ApJ,
706, L86
Nipoti, C., Treu, T., Leauthaud, A., Bundy, K., Newman, A. B.,
& Auger, M. W. 2012, MNRAS, 422, 1714
Onodera, M., et al. 2010, ApJ, 715, L6
—. 2012, ApJ, 755, 26
Oser, L., Naab, T., Ostriker, J. P., & Johansson, P. H. 2012, ApJ,
744, 63
Patel, S. G., et al. 2013, ApJ, 766, 15
Peng, C. Y., Ho, L. C., Impey, C. D., & Rix, H.-W. 2002, AJ,
124, 266
Pirzkal, N., et al. 2004, ApJS, 154, 501
Poggianti, B. M., et al. 2013, ApJ, 762, 77
Shen, S., Mo, H. J., White, S. D. M., Blanton, M. R., Kauffmann,
G., Voges, W., Brinkmann, J., & Csabai, I. 2003, MNRAS, 343,
978
Szomoru, D., Franx, M., & van Dokkum, P. G. 2012, ApJ, 749,
121
Szomoru, D., et al. 2010, ApJ, 714, L244
Taylor, E. N., Franx, M., Glazebrook, K., Brinchmann, J., van
der Wel, A., & van Dokkum, P. G. 2010, ApJ, 720, 723
Toft, S., Franx, M., van Dokkum, P., F¨rster Schreiber, N. M.,
o
Labbe, I., Wuyts, S., & Marchesini, D. 2009, ApJ, 705, 255
Toft, S., Gallazzi, A., Zirm, A., Wold, M., Zibetti, S., Grillo, C.,
& Man, A. 2012, ApJ, 754, 3
Toft, S., et al. 2007, ApJ, 671, 285
Trujillo, I., Carrasco, E. R., & Ferr´-Mateu, A. 2012, ApJ, 751, 45
e
Trujillo, I., Cenarro, A. J., de Lorenzo-C´ceres, A., Vazdekis, A.,
a
de la Rosa, I. G., & Cava, A. 2009, ApJ, 692, L118
Trujillo, I., et al. 2006, ApJ, 650, 18
van de Sande, J., et al. 2013, ApJ, 771, 85
—. 2011, ApJ, 736, L9
van der Wel, A., et al. 2011, ApJ, 730, 38
van Dokkum, P. G., et al. 2008, ApJ, 677, L5
van Dokkum, P. G., Kriek, M., & Franx, M. 2009, Nature, 460,
717
van Dokkum, P. G., et al. 2010, ApJ, 709, 1018
Williams, R. J., Quadri, R. F., Franx, M., van Dokkum, P., Toft,
S., Kriek, M., & Labb´, I. 2010, ApJ, 713, 738
e
Wuyts, S., Cox, T. J., Hayward, C. C., Franx, M., Hernquist, L.,
Hopkins, P. F., Jonsson, P., & van Dokkum, P. G. 2010, ApJ,
722, 1666
Wuyts, S., et al. 2007, ApJ, 655, 51
Zirm, A. W., et al. 2007, ApJ, 656, 66