This document summarizes research using data from Galaxy Zoo, SDSS, and GALEX to study how star formation is quenched in low-redshift galaxies. The key findings are:
1) Taking galaxy morphology into account, the "green valley" is not a single transitional state, as was previously thought.
2) Only a small population of blue early-type galaxies rapidly transition across the green valley as their morphology transforms from disk to spheroid and star formation is quenched quickly.
3) The majority of blue star-forming galaxies have significant disks and retain their late-type morphology as their star formation rates decline very slowly.
4) Different evolutionary pathways are observed for early- and late-type
DISCOVERY OF A GALAXY CLUSTER WITH A VIOLENTLY STARBURSTING CORE AT z = 2:506Sérgio Sacani
We report the discovery of a remarkable concentration of massive galaxies with extended X-ray
emission at zspec = 2:506, which contains 11 massive (M & 1011M) galaxies in the central 80kpc
region (11.6 overdensity). We have spectroscopically conrmed 17 member galaxies with 11 from CO
and the remaining ones from H. The X-ray luminosity, stellar mass content and velocity dispersion
all point to a collapsed, cluster-sized dark matter halo with mass M200c = 1013:90:2M, making it
the most distant X-ray-detected cluster known to date. Unlike other clusters discovered so far, this
structure is dominated by star-forming galaxies (SFGs) in the core with only 2 out of the 11 massive
galaxies classied as quiescent. The star formation rate (SFR) in the 80kpc core reaches 3400 M
yr 1 with a gas depletion time of 200 Myr, suggesting that we caught this cluster in rapid build-up
of a dense core. The high SFR is driven by both a high abundance of SFGs and a higher starburst
fraction ( 25%, compared to 3%-5% in the eld). The presence of both a collapsed, cluster-sized
halo and a predominant population of massive SFGs suggests that this structure could represent an
important transition phase between protoclusters and mature clusters. It provides evidence that the
main phase of massive galaxy passivization will take place after galaxies accrete onto the cluster,
providing new insights into massive cluster formation at early epochs. The large integrated stellar
mass at such high redshift challenges our understanding of massive cluster formation.
We present spectroscopic observations of the nearby dwarf galaxy AGC 198691. This object is part
of the Survey of H I in Extremely Low-Mass Dwarfs (SHIELD) project, which is a multi-wavelength
study of galaxies with H I masses in the range of 106-107:2 M discovered by the ALFALFA survey.
We have obtained spectra of the lone H II region in AGC 198691 with the new high-throughput
KPNO Ohio State Multi-Object Spectrograph (KOSMOS) on the Mayall 4-m as well as with the Blue
Channel spectrograph on the MMT 6.5-m telescope. These observations enable the measurement of the
temperature-sensitive [O III]4363 line and hence the determination of a \direct" oxygen abundance
for AGC 198691. We nd this system to be an extremely metal-decient (XMD) system with an
oxygen abundance of 12+log(O/H) = 7.02 0.03, making AGC 198691 the lowest-abundance starforming
galaxy known in the local universe. Two of the ve lowest-abundance galaxies known have
been discovered by the ALFALFA blind H I survey; this high yield of XMD galaxies represents a
paradigm shift in the search for extremely metal-poor galaxies.
TEMPORAL EVOLUTION OF THE HIGH-ENERGY IRRADIATION AND WATER CONTENT OF TRAPPI...Sérgio Sacani
The ultracool dwarf star TRAPPIST-1 hosts seven Earth-size transiting planets, some of which could
harbour liquid water on their surfaces. UV observations are essential to measure their high-energy
irradiation, and to search for photodissociated water escaping from their putative atmospheres. Our
new observations of TRAPPIST-1 Ly-α line during the transit of TRAPPIST-1c show an evolution of
the star emission over three months, preventing us from assessing the presence of an extended hydrogen
exosphere. Based on the current knowledge of the stellar irradiation, we investigated the likely history
of water loss in the system. Planets b to d might still be in a runaway phase, and planets within the
orbit of TRAPPIST-1g could have lost more than 20 Earth oceans after 8 Gyr of hydrodynamic escape.
However, TRAPPIST-1e to h might have lost less than 3 Earth oceans if hydrodynamic escape stopped
once they entered the habitable zone. We caution that these estimates remain limited by the large
uncertainty on the planet masses. They likely represent upper limits on the actual water loss because
our assumptions maximize the XUV-driven escape, while photodissociation in the upper atmospheres
should be the limiting process. Late-stage outgassing could also have contributed significant amounts
of water for the outer, more massive planets after they entered the habitable zone. While our results
suggest that the outer planets are the best candidates to search for water with the JWST, they also
highlight the need for theoretical studies and complementary observations in all wavelength domains
to determine the nature of the TRAPPIST-1 planets, and their potential habitability.
Keywords: planetary systems - Stars: individual: TRAPPIST-1
Beyond the Kuiper Belt Edge: New High Perihelion Trans-Neptunian Objects With...Sérgio Sacani
We are conducting a survey for distant solar system objects beyond the Kuiper
Belt edge ( 50 AU) with new wide-field cameras on the Subaru and CTIO tele-
scopes. We are interested in the orbits of objects that are decoupled from the
giant planet region in order to understand the structure of the outer solar sys-
tem, including whether a massive planet exists beyond a few hundred AU as first
reported in Trujillo and Sheppard (2014). In addition to discovering extreme
trans-Neptunian objects detailed elsewhere, we have found several objects with
high perihelia (q > 40 AU) that differ from the extreme and inner Oort cloud
objects due to their moderate semi-major axes (50 < a < 100 AU) and eccen-
tricities (e . 0.3). Newly discovered objects 2014 FZ71 and 2015 FJ345 have
the third and fourth highest perihelia known after Sedna and 2012 VP113, yet
their orbits are not nearly as eccentric or distant. We found several of these high
perihelion but moderate orbit objects and observe that they are mostly near Nep-
tune mean motion resonances and have significant inclinations (i > 20 degrees).
These moderate objects likely obtained their unusual orbits through combined
interactions with Neptune’s mean motion resonances and the Kozai resonance,
similar to the origin scenarios for 2004 XR190. We also find the distant 2008
ST291 has likely been modified by the MMR+KR mechanism through the 6:1
Neptune resonance. We discuss these moderately eccentric, distant objects along
with some other interesting low inclination outer classical belt objects like 2012
FH84 discovered in our ongoing survey.
WHERE IS THE FLUX GOING? THE LONG-TERM PHOTOMETRIC VARIABILITY OF BOYAJIAN’S ...Sérgio Sacani
We present ∼ 800 days of photometric monitoring of Boyajian’s Star (KIC 8462852) from the AllSky
Automated Survey for Supernovae (ASAS-SN) and ∼ 4000 days of monitoring from the All Sky
Automated Survey (ASAS). We show that from 2015 to the present the brightness of Boyajian’s Star
has steadily decreased at a rate of 6.3 ± 1.4 mmag yr−1
, such that the star is now 1.5% fainter than it
was in February 2015. Moreover, the longer time baseline afforded by ASAS suggests that Boyajian’s
Star has also undergone two brightening episodes in the past 11 years, rather than only exhibiting a
monotonic decline. We analyze a sample of ∼ 1000 comparison stars of similar brightness located in
the same ASAS-SN field and demonstrate that the recent fading is significant at & 99.4% confidence.
The 2015 − 2017 dimming rate is consistent with that measured with Kepler data for the time period
from 2009 to 2013. This long-term variability is difficult to explain with any of the physical models
for the star’s behavior proposed to date
We report the discovery of a new Kepler transiting circumbinary planet (CBP).
This latest addition to the still-small family of CBPs defies the current trend of known
short-period planets orbiting near the stability limit of binary stars. Unlike the previous
discoveries, the planet revolving around the eclipsing binary system Kepler-1647 has
a very long orbital period ( 1100 days) and was at conjunction only twice during
the Kepler mission lifetime. Due to the singular configuration of the system, Kepler-
1647b is not only the longest-period transiting CBP at the time of writing, but also one
of the longest-period transiting planets. With a radius of 1:060:01 RJup it is also the
largest CBP to date. The planet produced three transits in the light-curve of Kepler-
1647 (one of them during an eclipse, creating a syzygy) and measurably perturbed the
times of the stellar eclipses, allowing us to measure its mass to be 1:520:65 MJup.
The planet revolves around an 11-day period eclipsing binary consisting of two Solarmass
stars on a slightly inclined, mildly eccentric (ebin = 0:16), spin-synchronized
orbit. Despite having an orbital period three times longer than Earth’s, Kepler-1647b is
in the conservative habitable zone of the binary star throughout its orbit.
Detection of lyman_alpha_emission_from_a_triply_imaged_z_6_85_galaxy_behind_m...Sérgio Sacani
We report the detection of Ly emission at 9538A
in the Keck/DEIMOS and HST WFC3
G102 grism data from a triply-imaged galaxy at z = 6:846 0:001 behind galaxy cluster MACS
J2129.4 0741. Combining the emission line wavelength with broadband photometry, line ratio upper
limits, and lens modeling, we rule out the scenario that this emission line is [O II] at z = 1:57. After
accounting for magnication, we calculate the weighted average of the intrinsic Ly luminosity to be
1:31042 erg s 1 and Ly equivalent width to be 7415A. Its intrinsic UV absolute magnitude at
1600A
is 18:60:2 mag and stellar mass (1:50:3)107 M, making it one of the faintest (intrinsic
LUV 0:14 L
UV) galaxies with Ly detection at z 7 to date. Its stellar mass is in the typical range
for the galaxies thought to dominate the reionization photon budget at z & 7; the inferred Ly escape
fraction is high (& 10%), which could be common for sub-L z & 7 galaxies with Ly emission. This
galaxy oers a glimpse of the galaxy population that is thought to drive reionization, and it shows
that gravitational lensing is an important avenue to probe the sub-L galaxy population.
Proper-motion age dating of the progeny of Nova Scorpii ad 1437Sérgio Sacani
‘Cataclysmic variables’ are binary star systems in which one
star of the pair is a white dwarf, and which often generate bright
and energetic stellar outbursts. Classical novae are one type of
outburst: when the white dwarf accretes enough matter from its
companion, the resulting hydrogen-rich atmospheric envelope
can host a runaway thermonuclear reaction that generates a rapid
brightening1–4. Achieving peak luminosities of up to one million
times that of the Sun5
, all classical novae are recurrent, on timescales
of months6
to millennia7
. During the century before and after an
eruption, the ‘novalike’ binary systems that give rise to classical
novae exhibit high rates of mass transfer to their white dwarfs8
.
Another type of outburst is the dwarf nova: these occur in binaries
that have stellar masses and periods indistinguishable from those
of novalikes9
but much lower mass-transfer rates10, when accretiondisk
instabilities11 drop matter onto the white dwarfs. The coexistence
at the same orbital period of novalike binaries and dwarf
novae—which are identical but for their widely varying accretion
rates—has been a longstanding puzzle9
. Here we report the recovery
of the binary star underlying the classical nova eruption of 11 March
ad 1437 (refs 12, 13), and independently confirm its age by propermotion
dating. We show that, almost 500 years after a classical-nova
event, the system exhibited dwarf-nova eruptions. The three other
oldest recovered classical novae14–16 display nova shells, but lack
firm post-eruption ages17,18, and are also dwarf novae at present.
We conclude that many old novae become dwarf novae for part of
the millennia between successive nova eruptions19,
EXTINCTION AND THE DIMMING OF KIC 8462852Sérgio Sacani
To test alternative hypotheses for the behavior of KIC 8462852, we obtained measurements of the star
over a wide wavelength range from the UV to the mid-infrared from October 2015 through December
2016, using Swift, Spitzer and at AstroLAB IRIS. The star faded in a manner similar to the longterm
fading seen in Kepler data about 1400 days previously. The dimming rate for the entire period
reported is 22.1 ± 9.7 milli-mag yr−1
in the Swift wavebands, with amounts of 21.0 ± 4.5 mmag in
the groundbased B measurements, 14.0 ± 4.5 mmag in V , and 13.0 ± 4.5 in R, and a rate of 5.0 ± 1.2
mmag yr−1 averaged over the two warm Spitzer bands. Although the dimming is small, it is seen at
& 3 σ by three different observatories operating from the UV to the IR. The presence of long-term
secular dimming means that previous SED models of the star based on photometric measurements
taken years apart may not be accurate. We find that stellar models with Tef f = 7000 - 7100 K and
AV ∼ 0.73 best fit the Swift data from UV to optical. These models also show no excess in the
near-simultaneous Spitzer photometry at 3.6 and 4.5 µm, although a longer wavelength excess from
a substantial debris disk is still possible (e.g., as around Fomalhaut). The wavelength dependence of
the fading favors a relatively neutral color (i.e., RV & 5, but not flat across all the bands) compared
with the extinction law for the general ISM (RV = 3.1), suggesting that the dimming arises from
circumstellar material
First identification of_direct_collapse_black_holes_candidates_in_the_early_u...Sérgio Sacani
The first black hole seeds, formed when the Universe was younger than ⇠ 500Myr, are recognized
to play an important role for the growth of early (z ⇠ 7) super-massive black holes.
While progresses have been made in understanding their formation and growth, their observational
signatures remain largely unexplored. As a result, no detection of such sources has been
confirmed so far. Supported by numerical simulations, we present a novel photometric method
to identify black hole seed candidates in deep multi-wavelength surveys.We predict that these
highly-obscured sources are characterized by a steep spectrum in the infrared (1.6−4.5μm),
i.e. by very red colors. The method selects the only 2 objects with a robust X-ray detection
found in the CANDELS/GOODS-S survey with a photometric redshift z & 6. Fitting their
infrared spectra only with a stellar component would require unrealistic star formation rates
(& 2000M# yr−1). To date, the selected objects represent the most promising black hole seed
candidates, possibly formed via the direct collapse black hole scenario, with predicted mass
> 105M#. While this result is based on the best photometric observations of high-z sources
available to date, additional progress is expected from spectroscopic and deeper X-ray data.
Upcoming observatories, like the JWST, will greatly expand the scope of this work.
Is there an_exoplanet_in_the_solar_systemSérgio Sacani
We investigate the prospects for the capture of the proposed Planet 9 from other
stars in the Sun’s birth cluster. Any capture scenario must satisfy three conditions:
the encounter must be more distant than ∼ 150 au to avoid perturbing the Kuiper
belt; the other star must have a wide-orbit planet (a & 100 au); the planet must be
captured onto an appropriate orbit to sculpt the orbital distribution of wide-orbit
Solar System bodies. Here we use N-body simulations to show that these criteria may
be simultaneously satisfied. In a few percent of slow close encounters in a cluster,
bodies are captured onto heliocentric, Planet 9-like orbits. During the ∼ 100 Myr
cluster phase, many stars are likely to host planets on highly-eccentric orbits with
apastron distances beyond 100 au if Neptune-sized planets are common and susceptible
to planet–planet scattering. While the existence of Planet 9 remains unproven, we
consider capture from one of the Sun’s young brethren a plausible route to explain such
an object’s orbit. Capture appears to predict a large population of Trans-Neptunian
Objects (TNOs) whose orbits are aligned with the captured planet, and we propose
that different formation mechanisms will be distinguishable based on their imprint on
the distribution of TNOs
Detection of solar_like_oscillations_in_relies_of_the_milk_way_asteroseismolo...Sérgio Sacani
Asteroseismic constraints on K giants make it possible to infer radii, masses and ages of tens
of thousands of field stars. Tests against independent estimates of these properties are however
scarce, especially in the metal-poor regime. Here, we report the detection of solar-like
oscillations in 8 stars belonging to the red-giant branch and red-horizontal branch of the globular
cluster M4. The detections were made in photometric observations from the K2 Mission
during its Campaign 2. Making use of independent constraints on the distance, we estimate
masses of the 8 stars by utilising different combinations of seismic and non-seismic inputs.
When introducing a correction to the Δν scaling relation as suggested by stellar models, for
RGB stars we find excellent agreement with the expected masses from isochrone fitting, and
with a distance modulus derived using independent methods. The offset with respect to independent
masses is lower, or comparable with, the uncertainties on the average RGB mass
(4 − 10%, depending on the combination of constraints used). Our results lend confidence to
asteroseismic masses in the metal poor regime. We note that a larger sample will be needed
to allow more stringent tests to be made of systematic uncertainties in all the observables
(both seismic and non-seismic), and to explore the properties of RHB stars, and of different
populations in the cluster.
The canarias einstein_ring_a_newly_discovered_optical_einstein_ringSérgio Sacani
We report the discovery of an optical Einstein Ring in the Sculptor constellation,
IAC J010127-334319, in the vicinity of the Sculptor Dwarf Spheroidal Galaxy. It is
an almost complete ring ( 300◦) with a diameter of 4.5 arcsec. The discovery was
made serendipitously from inspecting Dark Energy Camera (DECam) archive imaging
data. Confirmation of the object nature has been obtained by deriving spectroscopic
redshifts for both components, lens and source, from observations at the 10.4 m Gran
Telescopio CANARIAS (GTC) with the spectrograph OSIRIS. The lens, a massive
early-type galaxy, has a redshift of z = 0.581 while the source is a starburst galaxy
with redshift of z = 1.165. The total enclosed mass that produces the lensing effect
has been estimated to be Mtot = (1.86 ± 0.23) · 1012M⊙.
The completeness-corrected rate of stellar encounters with the Sun from the f...Sérgio Sacani
I report on close encounters of stars to the Sun found in the first Gaia data release (GDR1). Combining Gaia astrometry with radial
velocities of around 320 000 stars drawn from various catalogues, I integrate orbits in a Galactic potential to identify those stars which
come within a few parsecs. Such encounters could influence the solar system, for example through gravitational perturbations of the
Oort cloud. 16 stars are found to come within 2 pc (although a few of these have dubious data). This is fewer than were found in a
similar study based on Hipparcos data, even though the present study has many more candidates. This is partly because I reject stars
with large radial velocity uncertainties (>10 km s−1
), and partly because of missing stars in GDR1 (especially at the bright end). The
closest encounter found is Gl 710, a K dwarf long-known to come close to the Sun in about 1.3 Myr. The Gaia astrometry predict
a much closer passage than pre-Gaia estimates, however: just 16 000 AU (90% confidence interval: 10 000–21 000 AU), which will
bring this star well within the Oort cloud. Using a simple model for the spatial, velocity, and luminosity distributions of stars, together
with an approximation of the observational selection function, I model the incompleteness of this Gaia-based search as a function
of the time and distance of closest approach. Applying this to a subset of the observed encounters (excluding duplicates and stars
with implausibly large velocities), I estimate the rate of stellar encounters within 5 pc averaged over the past and future 5 Myr to be
545±59 Myr−1
. Assuming a quadratic scaling of the rate within some encounter distance (which my model predicts), this corresponds
to 87 ± 9 Myr−1 within 2 pc. A more accurate analysis and assessment will be possible with future Gaia data releases.
SPECTROSCOPIC CONFIRMATION OF THE EXISTENCE OF LARGE, DIFFUSE GALAXIES IN THE...Sérgio Sacani
We recently identified a population of low surface brightness objects in the field of the z = 0.023 Coma cluster,
using the Dragonfly Telephoto Array. Here we present Keck spectroscopy of one of the largest of these “ultradiffuse
galaxies” (UDGs), confirming that it is a member of the cluster. The galaxy has prominent absorption
features, including the Ca II H+K lines and the G-band, and no detected emission lines. Its radial velocity of
cz=6280±120 km s−1 is within the 1σ velocity dispersion of the Coma cluster. The galaxy has an effective
radius of 4.3 ± 0.3 kpc and a Sérsic index of 0.89 ± 0.06, as measured from Keck imaging. We find no indications
of tidal tails or other distortions, at least out to a radius of ∼2re. We show that UDGs are located in a previously
sparsely populated region of the size—magnitude plane of quiescent stellar systems, as they are ∼6 mag fainter
than normal early-type galaxies of the same size. It appears that the luminosity distribution of large quiescent
galaxies is not continuous, although this could largely be due to selection effects. Dynamical measurements are
needed to determine whether the dark matter halos of UDGs are similar to those of galaxies with the same
luminosity or to those of galaxies with the same size.
The importance of comets for the origin of life on Earth has been advocated for many decades. Amino acids are
key ingredients in chemistry, leading to life as we know it. Many primitive meteorites contain amino acids, and it
is generally believed that these are formed by aqueous alterations. In the collector aerogel and foil samples of the
Stardust mission after the flyby at comet Wild 2, the simplest form of amino acids, glycine, has been found
together with precursor molecules methylamine and ethylamine. Because of contamination issues of the samples,
a cometary origin was deduced from the 13C isotopic signature. We report the presence of volatile glycine
accompanied by methylamine and ethylamine in the coma of 67P/Churyumov-Gerasimenko measured by
the ROSINA (Rosetta Orbiter Spectrometer for Ion and Neutral Analysis) mass spectrometer, confirming the
Stardust results. Together with the detection of phosphorus and a multitude of organic molecules, this result
demonstrates that comets could have played a crucial role in the emergence of life on Earth.
Extensive Noachian fluvial systems in Arabia Terra: Implications for early Ma...Sérgio Sacani
Valley networks are some of the strongest lines of evidence for
extensive fluvial activity on early (Noachian; >3.7 Ga) Mars. However,
their purported absence on certain ancient terrains, such as
Arabia Terra, is at variance with patterns of precipitation as predicted
by “warm and wet” climate models. This disagreement has contributed
to the development of an alternative “icy highlands” scenario,
whereby valley networks were formed by the melting of highland ice
sheets. Here, we show through regional mapping that Arabia Terra
shows evidence for extensive networks of sinuous ridges. We interpret
these ridge features as inverted fluvial channels that formed in
the Noachian, before being subject to burial and exhumation. The
inverted channels developed on extensive aggrading flood plains. As
the inverted channels are both sourced in, and traverse across, Arabia
Terra, their formation is inconsistent with discrete, localized sources
of water, such as meltwater from highland ice sheets. Our results are
instead more consistent with an early Mars that supported widespread
precipitation and runoff.
Exocometary gas in_th_hd_181327_debris_ringSérgio Sacani
An increasing number of observations have shown that gaseous debris discs are not an
exception. However, until now we only knew of cases around A stars. Here we present the first
detection of 12CO (2-1) disc emission around an F star, HD 181327, obtained with ALMA
observations at 1.3 mm. The continuum and CO emission are resolved into an axisymmetric
disc with ring-like morphology. Using a Markov chain Monte Carlo method coupled with
radiative transfer calculations we study the dust and CO mass distribution. We find the dust is
distributed in a ring with a radius of 86:0 0:4 AU and a radial width of 23:2 1:0 AU. At
this frequency the ring radius is smaller than in the optical, revealing grain size segregation
expected due to radiation pressure. We also report on the detection of low level continuum
emission beyond the main ring out to 200 AU. We model the CO emission in the non-LTE
regime and we find that the CO is co-located with the dust, with a total CO gas mass ranging
between 1:2 10 6 M and 2:9 10 6 M, depending on the gas kinetic temperature and
collisional partners densities. The CO densities and location suggest a secondary origin, i.e.
released from icy planetesimals in the ring. We derive a CO cometary composition that is
consistent with Solar system comets. Due to the low gas densities it is unlikely that the gas is
shaping the dust distribution.
A 2 4_determination_of_the_local_value_of_the_hubble_constantSérgio Sacani
We use the Wide Field Camera 3 (WFC3) on the Hubble Space Telescope (HST) to
reduce the uncertainty in the local value of the Hubble constant from 3.3% to 2.4%.
The bulk of this improvement comes from new, near-infrared observations of Cepheid
variables in 11 host galaxies of recent type Ia supernovae (SNe Ia), more than doubling
the sample of reliable SNe Ia having a Cepheid-calibrated distance to a total of 19; these
in turn leverage the magnitude-redshift relation based on 300 SNe Ia at z <0.15. All
19 hosts as well as the megamaser system NGC4258 have been observed with WFC3
in the optical and near-infrared, thus nullifying cross-instrument zeropoint errors in the
relative distance estimates from Cepheids. Other noteworthy improvements include a
33% reduction in the systematic uncertainty in the maser distance to NGC4258, a larger
sample of Cepheids in the Large Magellanic Cloud (LMC), a more robust distance to
the LMC based on late-type detached eclipsing binaries (DEBs), HST observations of
Cepheids in M31, and new HST-based trigonometric parallaxes for Milky Way (MW)
Cepheids.
The gaia eso_survey_stellar_content_and_elemental_abundances_in_the_massive_c...Sérgio Sacani
Estudo sobre o conteúdo estelar e os elementos que estão presentes no aglomerado estelar aberto NGC 6705, também conhecido como Aglomerado do Pato Selvagem.
A higher efficiency_of_converting_gas_to_stars_push_galaxies_at_z_1_6_well_ab...Sérgio Sacani
Galáxias formando estrelas em taxas extremas a nove bilhões de anos atrás eram mais eficientes do que a média das galáxias atuais, descobriram os pesquisadores.
A maioria das estrelas acredita-se localizam-se na sequência principal onde quanto maior a massa da galáxia, mais eficiente ela é na formação de novas estrelas. Contudo, de vez em quando uma galáxia apresentará uma explosão de novas estrelas que brilham mais do que o resto. Uma colisão entre duas grandes galáxias é normalmente a causa dessas fases de explosões de formação de estrelas, onde o gás frio que reside nas grandes nuvens moleculares torna-se o combustível para sustentar essas altas taxas de formação de estrelas.
A questão que os astrônomos têm feito é se essas explosões de estrelas no início o universo foram o resultado de se ter um suprimento de gás abundante, ou se as galáxias convertiam o gás de maneira mais eficiente.
Um novo estudo, publicado no Astrophysical Journal Letters de 15 de Outubro, liderado por John Silverman, do Kavli Institute for Physics and Mathematics of the Universe, estudou o conteúdo do gás monóxido de carbono (CO) em sete galáxias de explosão de estrelas muito distantes, quando o universo tinha apenas 4 bilhões de anos de vida. Isso foi possível devido a capacidade do Atacama Large Millimiter/Submillimiter Array (ALMA), localizado no platô no topo da montanha no Chile, que trabalha para detectar as ondas eletromagnéticas no comprimento de onda milimétrico (importante para se estudar o gás molecular) e um nível de sensibilidade que só agora começa a ser explorado pelos astrônomos.
Os pesquisadores descobriram que a quantidade de gás CO emitido já tinha diminuído, mesmo apesar da galáxia continuar a formar estrelas em altas taxas. Essas observações são similares àquelas registradas para as galáxias de explosões de estrelas próximas da Terra atualmente, mas a quantidade da depleção de gás não foi tão rápida quanto se esperava. Isso levou os pesquisadores a concluírem que poderia haver um contínuo aumento na eficiência, dependendo em de quanto acima da taxa de se formar estrelas ela está da sequência principal.
The Gaia-ESO Survey: Empirical estimates of stellar ages from lithium equival...Sérgio Sacani
We present an empirical model of age-dependent photospheric lithium depletion, calibrated using a large, homogeneouslyanalysed sample of 6200 stars in 52 open clusters, with ages from 2–6000Myr and −0.3 < [Fe/H] < 0.2, observed in the
Gaia-ESO spectroscopic survey. The model is used to obtain age estimates and posterior age probability distributions from
measurements of the Li I 6708Å equivalent width for individual (pre) main sequence stars with 3000 < Teff/K < 6500,
a domain where age determination from the HR diagram is either insensitive or highly model-dependent. In the best cases,
precisions of 0.1 dex in log age are achievable; even higher precision can be obtained for coeval groups and associations where
the individual age probabilities of their members can be combined. The method is validated on a sample of exoplanet-hosting
young stars, finding agreement with claimed young ages for some, but not others. We obtain better than 10 per cent precision
in age, and excellent agreement with published ages, for seven well-studied young moving groups. The derived ages for young
clusters (< 1 Gyr) in our sample are also in good agreement with their training ages, and consistent with several published,
model-insensitive lithium depletion boundary ages. For older clusters there remain systematic age errors that could be as large
as a factor of two. There is no evidence to link these errors to any strong systematic metallicity dependence of (pre) main
sequence lithium depletion, at least in the range −0.29 < [Fe/H] < 0.18. Our methods and model are provided as software –
"Empirical AGes from Lithium Equivalent widthS" (EAGLES).
We report the discovery of spiral galaxies that are as optically luminous as elliptical brightest cluster
galaxies, with r-band monochromatic luminosity Lr = 8 14L (4:3 7:5 1044 erg s 1). These
super spiral galaxies are also giant and massive, with diameter D = 57 134 kpc and stellar mass
Mstars = 0:3 3:4 1011M. We nd 53 super spirals out of a complete sample of 1616 SDSS
galaxies with redshift z < 0:3 and Lr > 8L. The closest example is found at z = 0:089. We use
existing photometry to estimate their stellar masses and star formation rates (SFRs). The SDSS
and WISE colors are consistent with normal star-forming spirals on the blue sequence. However, the
extreme masses and rapid SFRs of 5 65M yr 1 place super spirals in a sparsely populated region
of parameter space, above the star-forming main sequence of disk galaxies. Super spirals occupy a
diverse range of environments, from isolation to cluster centers. We nd four super spiral galaxy
systems that are late-stage major mergers{a possible clue to their formation. We suggest that super
spirals are a remnant population of unquenched, massive disk galaxies. They may eventually become
massive lenticular galaxies after they are cut o from their gas supply and their disks fade.
Star formation at the smallest scales; A JWST study of the clump populations ...Sérgio Sacani
We present the clump populations detected in 18 lensed galaxies at redshifts 1 to 8.5 within the lensing cluster field SMACS0723.
The recent JWST Early Release Observations of this poorly known region of the sky have revealed numerous point-like sources
within and surrounding their host galaxies, undetected in the shallower HST images. We use JWST multiband photometry and
the lensing model of this galaxy cluster to estimate the intrinsic sizes and magnitudes of the stellar clumps. We derive optical
restframe effective radii from <10 to hundreds pc and masses ranging from ∼ 105
to 109 M, overlapping with massive star
clusters in the local universe. Clump ages range from 1 Myr to 1 Gyr. We compare the crossing time to the age of the clumps
and determine that between 45 and 60 % of the detected clumps are consistent with being gravitationally bound. On average,
the dearth of Gyr old clumps suggests that the dissolution time scales are shorter than 1 Gyr. We see a significant increase in the
luminosity (mass) surface density of the clumps with redshift. Clumps in reionisation era galaxies have stellar densities higher
than star clusters in the local universe. We zoom in into single galaxies at redshift < 6 and find for two galaxies, the Sparkler and
the Firework, that their star clusters/clumps show distinctive colour distributions and location surrounding their host galaxy that
are compatible with being accredited or formed during merger events. The ages of some of the compact clusters are between
1 and 4 Gyr, e.g., globular cluster precursors formed around 9-12 Gyr ago. Our study, conducted on a small sample of galaxies,
shows the potential of JWST observations for understanding the conditions under which star clusters form in rapidly evolving
galaxies.
UV and Hα HST observations of 6 GASP jellyfish galaxiesSérgio Sacani
Star-forming, Hα-emitting clumps are found embedded in the gaseous tails of galaxies undergoing
intense ram pressure stripping in galaxy clusters, so-called jellyfish galaxies. These clumps offer a
unique opportunity to study star formation under extreme conditions, in the absence of an underlying
disk and embedded within the hot intracluster medium. Yet, a comprehensive, high spatial resolution
study of these systems is missing. We obtained UVIS/HST data to observe the first statistical sample
of clumps in the tails and disks of six jellyfish galaxies from the GASP survey; we used a combination
of broad-band (UV to I) filters and a narrow-band Hα filter. HST observations are needed to study
the sizes, stellar masses and ages of the clumps and their clustering hierarchy. These observations will
be used to study the clump scaling relations, the universality of the star formation process and verify
whether a disk is irrelevant, as hinted by jellyfish galaxy results. This paper presents the observations,
data reduction strategy, and some general results based on the preliminary data analysis. The UVIS
high spatial resolution gives an unprecedented sharp view of the complex structure of the inner regions
of the galaxies and of the substructures in the galaxy disks. We found clear signatures of stripping
in regions very close in projection to the galactic disk. The star-forming regions in the stripped tails
are extremely bright and compact while we did not detect a significant number of star-forming clumps
outside those detected by MUSE. The paper finally presents the development plan for the project.
The ALMA Survey of Star Formation and Evolution in Massive Protoclusters with...Sérgio Sacani
The ALMA Survey of Star Formation and Evolution in Massive Protoclusters with Blue Profiles
(ASSEMBLE) aims to investigate the process of mass assembly and its connection to high-mass star
formation theories in protoclusters in a dynamic view. We observed 11 massive (Mclump ≳ 103 M⊙),
luminous (Lbol ≳ 104 L⊙), and blue-profile (infall signature) clumps by ALMA with resolution of
∼2200–5500 au (median value of 3500 au) at 350 GHz (870 µm). 248 dense cores were identified, including 106 cores showing protostellar signatures and 142 prestellar core candidates. Compared to
early-stage infrared dark clouds (IRDCs) by ASHES, the core mass and surface density within the
ASSEMBLE clumps exhibited significant increment, suggesting concurrent core accretion during the
evolution of the clumps. The maximum mass of prestellar cores was found to be 2 times larger than
that in IRDCs, indicating that evolved protoclusters have the potential to harbor massive prestellar
cores. The mass relation between clumps and their most massive core (MMCs) is observed in ASSEMBLE but not in IRDCs, which is suggested to be regulated by multiscale mass accretion. The
mass correlation between the core clusters and their MMCs has a steeper slope compared to that
observed in stellar clusters, which can be due to fragmentation of the MMC and stellar multiplicity.
We observe a decrease in core separation and an increase in central concentration as protoclusters
evolve. We confirm primordial mass segregation in the ASSEMBLE protoclusters, possibly resulting
from gravitational concentration and/or gas accretion.
Observation of Io’s Resurfacing via Plume Deposition Using Ground-based Adapt...Sérgio Sacani
Since volcanic activity was first discovered on Io from Voyager images in 1979, changes
on Io’s surface have been monitored from both spacecraft and ground-based telescopes.
Here, we present the highest spatial resolution images of Io ever obtained from a groundbased telescope. These images, acquired by the SHARK-VIS instrument on the Large
Binocular Telescope, show evidence of a major resurfacing event on Io’s trailing hemisphere. When compared to the most recent spacecraft images, the SHARK-VIS images
show that a plume deposit from a powerful eruption at Pillan Patera has covered part
of the long-lived Pele plume deposit. Although this type of resurfacing event may be common on Io, few have been detected due to the rarity of spacecraft visits and the previously low spatial resolution available from Earth-based telescopes. The SHARK-VIS instrument ushers in a new era of high resolution imaging of Io’s surface using adaptive
optics at visible wavelengths.
Earliest Galaxies in the JADES Origins Field: Luminosity Function and Cosmic ...Sérgio Sacani
We characterize the earliest galaxy population in the JADES Origins Field (JOF), the deepest
imaging field observed with JWST. We make use of the ancillary Hubble optical images (5 filters
spanning 0.4−0.9µm) and novel JWST images with 14 filters spanning 0.8−5µm, including 7 mediumband filters, and reaching total exposure times of up to 46 hours per filter. We combine all our data
at > 2.3µm to construct an ultradeep image, reaching as deep as ≈ 31.4 AB mag in the stack and
30.3-31.0 AB mag (5σ, r = 0.1” circular aperture) in individual filters. We measure photometric
redshifts and use robust selection criteria to identify a sample of eight galaxy candidates at redshifts
z = 11.5 − 15. These objects show compact half-light radii of R1/2 ∼ 50 − 200pc, stellar masses of
M⋆ ∼ 107−108M⊙, and star-formation rates of SFR ∼ 0.1−1 M⊙ yr−1
. Our search finds no candidates
at 15 < z < 20, placing upper limits at these redshifts. We develop a forward modeling approach to
infer the properties of the evolving luminosity function without binning in redshift or luminosity that
marginalizes over the photometric redshift uncertainty of our candidate galaxies and incorporates the
impact of non-detections. We find a z = 12 luminosity function in good agreement with prior results,
and that the luminosity function normalization and UV luminosity density decline by a factor of ∼ 2.5
from z = 12 to z = 14. We discuss the possible implications of our results in the context of theoretical
models for evolution of the dark matter halo mass function.
THE IMPORTANCE OF MARTIAN ATMOSPHERE SAMPLE RETURN.Sérgio Sacani
The return of a sample of near-surface atmosphere from Mars would facilitate answers to several first-order science questions surrounding the formation and evolution of the planet. One of the important aspects of terrestrial planet formation in general is the role that primary atmospheres played in influencing the chemistry and structure of the planets and their antecedents. Studies of the martian atmosphere can be used to investigate the role of a primary atmosphere in its history. Atmosphere samples would also inform our understanding of the near-surface chemistry of the planet, and ultimately the prospects for life. High-precision isotopic analyses of constituent gases are needed to address these questions, requiring that the analyses are made on returned samples rather than in situ.
Multi-source connectivity as the driver of solar wind variability in the heli...Sérgio Sacani
The ambient solar wind that flls the heliosphere originates from multiple
sources in the solar corona and is highly structured. It is often described
as high-speed, relatively homogeneous, plasma streams from coronal
holes and slow-speed, highly variable, streams whose source regions are
under debate. A key goal of ESA/NASA’s Solar Orbiter mission is to identify
solar wind sources and understand what drives the complexity seen in the
heliosphere. By combining magnetic feld modelling and spectroscopic
techniques with high-resolution observations and measurements, we show
that the solar wind variability detected in situ by Solar Orbiter in March
2022 is driven by spatio-temporal changes in the magnetic connectivity to
multiple sources in the solar atmosphere. The magnetic feld footpoints
connected to the spacecraft moved from the boundaries of a coronal hole
to one active region (12961) and then across to another region (12957). This
is refected in the in situ measurements, which show the transition from fast
to highly Alfvénic then to slow solar wind that is disrupted by the arrival of
a coronal mass ejection. Our results describe solar wind variability at 0.5 au
but are applicable to near-Earth observatories.
Gliese 12 b: A Temperate Earth-sized Planet at 12 pc Ideal for Atmospheric Tr...Sérgio Sacani
Recent discoveries of Earth-sized planets transiting nearby M dwarfs have made it possible to characterize the
atmospheres of terrestrial planets via follow-up spectroscopic observations. However, the number of such planets
receiving low insolation is still small, limiting our ability to understand the diversity of the atmospheric
composition and climates of temperate terrestrial planets. We report the discovery of an Earth-sized planet
transiting the nearby (12 pc) inactive M3.0 dwarf Gliese 12 (TOI-6251) with an orbital period (Porb) of 12.76 days.
The planet, Gliese 12 b, was initially identified as a candidate with an ambiguous Porb from TESS data. We
confirmed the transit signal and Porb using ground-based photometry with MuSCAT2 and MuSCAT3, and
validated the planetary nature of the signal using high-resolution images from Gemini/NIRI and Keck/NIRC2 as
well as radial velocity (RV) measurements from the InfraRed Doppler instrument on the Subaru 8.2 m telescope
and from CARMENES on the CAHA 3.5 m telescope. X-ray observations with XMM-Newton showed the host
star is inactive, with an X-ray-to-bolometric luminosity ratio of log 5.7 L L X bol » - . Joint analysis of the light
curves and RV measurements revealed that Gliese 12 b has a radius of 0.96 ± 0.05 R⊕,a3σ mass upper limit of
3.9 M⊕, and an equilibrium temperature of 315 ± 6 K assuming zero albedo. The transmission spectroscopy metric
(TSM) value of Gliese 12 b is close to the TSM values of the TRAPPIST-1 planets, adding Gliese 12 b to the small
list of potentially terrestrial, temperate planets amenable to atmospheric characterization with JWST.
Gliese 12 b, a temperate Earth-sized planet at 12 parsecs discovered with TES...Sérgio Sacani
We report on the discovery of Gliese 12 b, the nearest transiting temperate, Earth-sized planet found to date. Gliese 12 is a
bright (V = 12.6 mag, K = 7.8 mag) metal-poor M4V star only 12.162 ± 0.005 pc away from the Solar system with one of the
lowest stellar activity levels known for M-dwarfs. A planet candidate was detected by TESS based on only 3 transits in sectors
42, 43, and 57, with an ambiguity in the orbital period due to observational gaps. We performed follow-up transit observations
with CHEOPS and ground-based photometry with MINERVA-Australis, SPECULOOS, and Purple Mountain Observatory,
as well as further TESS observations in sector 70. We statistically validate Gliese 12 b as a planet with an orbital period of
12.76144 ± 0.00006 d and a radius of 1.0 ± 0.1 R⊕, resulting in an equilibrium temperature of ∼315 K. Gliese 12 b has excellent
future prospects for precise mass measurement, which may inform how planetary internal structure is affected by the stellar
compositional environment. Gliese 12 b also represents one of the best targets to study whether Earth-like planets orbiting cool
stars can retain their atmospheres, a crucial step to advance our understanding of habitability on Earth and across the galaxy.
The importance of continents, oceans and plate tectonics for the evolution of...Sérgio Sacani
Within the uncertainties of involved astronomical and biological parameters, the Drake Equation
typically predicts that there should be many exoplanets in our galaxy hosting active, communicative
civilizations (ACCs). These optimistic calculations are however not supported by evidence, which is
often referred to as the Fermi Paradox. Here, we elaborate on this long-standing enigma by showing
the importance of planetary tectonic style for biological evolution. We summarize growing evidence
that a prolonged transition from Mesoproterozoic active single lid tectonics (1.6 to 1.0 Ga) to modern
plate tectonics occurred in the Neoproterozoic Era (1.0 to 0.541 Ga), which dramatically accelerated
emergence and evolution of complex species. We further suggest that both continents and oceans
are required for ACCs because early evolution of simple life must happen in water but late evolution
of advanced life capable of creating technology must happen on land. We resolve the Fermi Paradox
(1) by adding two additional terms to the Drake Equation: foc
(the fraction of habitable exoplanets
with significant continents and oceans) and fpt
(the fraction of habitable exoplanets with significant
continents and oceans that have had plate tectonics operating for at least 0.5 Ga); and (2) by
demonstrating that the product of foc
and fpt
is very small (< 0.00003–0.002). We propose that the lack
of evidence for ACCs reflects the scarcity of long-lived plate tectonics and/or continents and oceans on
exoplanets with primitive life.
A Giant Impact Origin for the First Subduction on EarthSérgio Sacani
Hadean zircons provide a potential record of Earth's earliest subduction 4.3 billion years ago. Itremains enigmatic how subduction could be initiated so soon after the presumably Moon‐forming giant impact(MGI). Earlier studies found an increase in Earth's core‐mantle boundary (CMB) temperature due to theaccumulation of the impactor's core, and our recent work shows Earth's lower mantle remains largely solid, withsome of the impactor's mantle potentially surviving as the large low‐shear velocity provinces (LLSVPs). Here,we show that a hot post‐impact CMB drives the initiation of strong mantle plumes that can induce subductioninitiation ∼200 Myr after the MGI. 2D and 3D thermomechanical computations show that a high CMBtemperature is the primary factor triggering early subduction, with enrichment of heat‐producing elements inLLSVPs as another potential factor. The models link the earliest subduction to the MGI with implications forunderstanding the diverse tectonic regimes of rocky planets.
Climate extremes likely to drive land mammal extinction during next supercont...Sérgio Sacani
Mammals have dominated Earth for approximately 55 Myr thanks to their
adaptations and resilience to warming and cooling during the Cenozoic. All
life will eventually perish in a runaway greenhouse once absorbed solar
radiation exceeds the emission of thermal radiation in several billions of
years. However, conditions rendering the Earth naturally inhospitable to
mammals may develop sooner because of long-term processes linked to
plate tectonics (short-term perturbations are not considered here). In
~250 Myr, all continents will converge to form Earth’s next supercontinent,
Pangea Ultima. A natural consequence of the creation and decay of Pangea
Ultima will be extremes in pCO2 due to changes in volcanic rifting and
outgassing. Here we show that increased pCO2, solar energy (F⨀;
approximately +2.5% W m−2 greater than today) and continentality (larger
range in temperatures away from the ocean) lead to increasing warming
hostile to mammalian life. We assess their impact on mammalian
physiological limits (dry bulb, wet bulb and Humidex heat stress indicators)
as well as a planetary habitability index. Given mammals’ continued survival,
predicted background pCO2 levels of 410–816 ppm combined with increased
F⨀ will probably lead to a climate tipping point and their mass extinction.
The results also highlight how global landmass configuration, pCO2 and F⨀
play a critical role in planetary habitability.
Constraints on Neutrino Natal Kicks from Black-Hole Binary VFTS 243Sérgio Sacani
The recently reported observation of VFTS 243 is the first example of a massive black-hole binary
system with negligible binary interaction following black-hole formation. The black-hole mass (≈10M⊙)
and near-circular orbit (e ≈ 0.02) of VFTS 243 suggest that the progenitor star experienced complete
collapse, with energy-momentum being lost predominantly through neutrinos. VFTS 243 enables us to
constrain the natal kick and neutrino-emission asymmetry during black-hole formation. At 68% confidence
level, the natal kick velocity (mass decrement) is ≲10 km=s (≲1.0M⊙), with a full probability distribution
that peaks when ≈0.3M⊙ were ejected, presumably in neutrinos, and the black hole experienced a natal
kick of 4 km=s. The neutrino-emission asymmetry is ≲4%, with best fit values of ∼0–0.2%. Such a small
neutrino natal kick accompanying black-hole formation is in agreement with theoretical predictions.
Detectability of Solar Panels as a TechnosignatureSérgio Sacani
In this work, we assess the potential detectability of solar panels made of silicon on an Earth-like
exoplanet as a potential technosignature. Silicon-based photovoltaic cells have high reflectance in the
UV-VIS and in the near-IR, within the wavelength range of a space-based flagship mission concept
like the Habitable Worlds Observatory (HWO). Assuming that only solar energy is used to provide
the 2022 human energy needs with a land cover of ∼ 2.4%, and projecting the future energy demand
assuming various growth-rate scenarios, we assess the detectability with an 8 m HWO-like telescope.
Assuming the most favorable viewing orientation, and focusing on the strong absorption edge in the
ultraviolet-to-visible (0.34 − 0.52 µm), we find that several 100s of hours of observation time is needed
to reach a SNR of 5 for an Earth-like planet around a Sun-like star at 10pc, even with a solar panel
coverage of ∼ 23% land coverage of a future Earth. We discuss the necessity of concepts like Kardeshev
Type I/II civilizations and Dyson spheres, which would aim to harness vast amounts of energy. Even
with much larger populations than today, the total energy use of human civilization would be orders of
magnitude below the threshold for causing direct thermal heating or reaching the scale of a Kardashev
Type I civilization. Any extraterrrestrial civilization that likewise achieves sustainable population
levels may also find a limit on its need to expand, which suggests that a galaxy-spanning civilization
as imagined in the Fermi paradox may not exist.
Jet reorientation in central galaxies of clusters and groups: insights from V...Sérgio Sacani
Recent observations of galaxy clusters and groups with misalignments between their central AGN jets
and X-ray cavities, or with multiple misaligned cavities, have raised concerns about the jet – bubble
connection in cooling cores, and the processes responsible for jet realignment. To investigate the
frequency and causes of such misalignments, we construct a sample of 16 cool core galaxy clusters and
groups. Using VLBA radio data we measure the parsec-scale position angle of the jets, and compare
it with the position angle of the X-ray cavities detected in Chandra data. Using the overall sample
and selected subsets, we consistently find that there is a 30% – 38% chance to find a misalignment
larger than ∆Ψ = 45◦ when observing a cluster/group with a detected jet and at least one cavity. We
determine that projection may account for an apparently large ∆Ψ only in a fraction of objects (∼35%),
and given that gas dynamical disturbances (as sloshing) are found in both aligned and misaligned
systems, we exclude environmental perturbation as the main driver of cavity – jet misalignment.
Moreover, we find that large misalignments (up to ∼ 90◦
) are favored over smaller ones (45◦ ≤ ∆Ψ ≤
70◦
), and that the change in jet direction can occur on timescales between one and a few tens of Myr.
We conclude that misalignments are more likely related to actual reorientation of the jet axis, and we
discuss several engine-based mechanisms that may cause these dramatic changes.
The solar dynamo begins near the surfaceSérgio Sacani
The magnetic dynamo cycle of the Sun features a distinct pattern: a propagating
region of sunspot emergence appears around 30° latitude and vanishes near the
equator every 11 years (ref. 1). Moreover, longitudinal flows called torsional oscillations
closely shadow sunspot migration, undoubtedly sharing a common cause2. Contrary
to theories suggesting deep origins of these phenomena, helioseismology pinpoints
low-latitude torsional oscillations to the outer 5–10% of the Sun, the near-surface
shear layer3,4. Within this zone, inwardly increasing differential rotation coupled with
a poloidal magnetic field strongly implicates the magneto-rotational instability5,6,
prominent in accretion-disk theory and observed in laboratory experiments7.
Together, these two facts prompt the general question: whether the solar dynamo is
possibly a near-surface instability. Here we report strong affirmative evidence in stark
contrast to traditional models8 focusing on the deeper tachocline. Simple analytic
estimates show that the near-surface magneto-rotational instability better explains
the spatiotemporal scales of the torsional oscillations and inferred subsurface
magnetic field amplitudes9. State-of-the-art numerical simulations corroborate these
estimates and reproduce hemispherical magnetic current helicity laws10. The dynamo
resulting from a well-understood near-surface phenomenon improves prospects
for accurate predictions of full magnetic cycles and space weather, affecting the
electromagnetic infrastructure of Earth.
Extensive Pollution of Uranus and Neptune’s Atmospheres by Upsweep of Icy Mat...Sérgio Sacani
In the Nice model of solar system formation, Uranus and Neptune undergo an orbital upheaval,
sweeping through a planetesimal disk. The region of the disk from which material is accreted by
the ice giants during this phase of their evolution has not previously been identified. We perform
direct N-body orbital simulations of the four giant planets to determine the amount and origin of solid
accretion during this orbital upheaval. We find that the ice giants undergo an extreme bombardment
event, with collision rates as much as ∼3 per hour assuming km-sized planetesimals, increasing the
total planet mass by up to ∼0.35%. In all cases, the initially outermost ice giant experiences the
largest total enhancement. We determine that for some plausible planetesimal properties, the resulting
atmospheric enrichment could potentially produce sufficient latent heat to alter the planetary cooling
timescale according to existing models. Our findings suggest that substantial accretion during this
phase of planetary evolution may have been sufficient to impact the atmospheric composition and
thermal evolution of the ice giants, motivating future work on the fate of deposited solid material.
Exomoons & Exorings with the Habitable Worlds Observatory I: On the Detection...Sérgio Sacani
The highest priority recommendation of the Astro2020 Decadal Survey for space-based astronomy
was the construction of an observatory capable of characterizing habitable worlds. In this paper series
we explore the detectability of and interference from exomoons and exorings serendipitously observed
with the proposed Habitable Worlds Observatory (HWO) as it seeks to characterize exoplanets, starting
in this manuscript with Earth-Moon analog mutual events. Unlike transits, which only occur in systems
viewed near edge-on, shadow (i.e., solar eclipse) and lunar eclipse mutual events occur in almost every
star-planet-moon system. The cadence of these events can vary widely from ∼yearly to multiple events
per day, as was the case in our younger Earth-Moon system. Leveraging previous space-based (EPOXI)
lightcurves of a Moon transit and performance predictions from the LUVOIR-B concept, we derive
the detectability of Moon analogs with HWO. We determine that Earth-Moon analogs are detectable
with observation of ∼2-20 mutual events for systems within 10 pc, and larger moons should remain
detectable out to 20 pc. We explore the extent to which exomoon mutual events can mimic planet
features and weather. We find that HWO wavelength coverage in the near-IR, specifically in the 1.4 µm
water band where large moons can outshine their host planet, will aid in differentiating exomoon signals
from exoplanet variability. Finally, we predict that exomoons formed through collision processes akin
to our Moon are more likely to be detected in younger systems, where shorter orbital periods and
favorable geometry enhance the probability and frequency of mutual events.
Emergent ribozyme behaviors in oxychlorine brines indicate a unique niche for...Sérgio Sacani
Mars is a particularly attractive candidate among known astronomical objects
to potentially host life. Results from space exploration missions have provided
insights into Martian geochemistry that indicate oxychlorine species, particularly perchlorate, are ubiquitous features of the Martian geochemical landscape. Perchlorate presents potential obstacles for known forms of life due to
its toxicity. However, it can also provide potential benefits, such as producing
brines by deliquescence, like those thought to exist on present-day Mars. Here
we show perchlorate brines support folding and catalysis of functional RNAs,
while inactivating representative protein enzymes. Additionally, we show
perchlorate and other oxychlorine species enable ribozyme functions,
including homeostasis-like regulatory behavior and ribozyme-catalyzed
chlorination of organic molecules. We suggest nucleic acids are uniquely wellsuited to hypersaline Martian environments. Furthermore, Martian near- or
subsurface oxychlorine brines, and brines found in potential lifeforms, could
provide a unique niche for biomolecular evolution.
Continuum emission from within the plunging region of black hole discsSérgio Sacani
The thermal continuum emission observed from accreting black holes across X-ray bands has the potential to be leveraged as a
powerful probe of the mass and spin of the central black hole. The vast majority of existing ‘continuum fitting’ models neglect
emission sourced at and within the innermost stable circular orbit (ISCO) of the black hole. Numerical simulations, however,
find non-zero emission sourced from these regions. In this work, we extend existing techniques by including the emission
sourced from within the plunging region, utilizing new analytical models that reproduce the properties of numerical accretion
simulations. We show that in general the neglected intra-ISCO emission produces a hot-and-small quasi-blackbody component,
but can also produce a weak power-law tail for more extreme parameter regions. A similar hot-and-small blackbody component
has been added in by hand in an ad hoc manner to previous analyses of X-ray binary spectra. We show that the X-ray spectrum
of MAXI J1820+070 in a soft-state outburst is extremely well described by a full Kerr black hole disc, while conventional
models that neglect intra-ISCO emission are unable to reproduce the data. We believe this represents the first robust detection of
intra-ISCO emission in the literature, and allows additional constraints to be placed on the MAXI J1820 + 070 black hole spin
which must be low a• < 0.5 to allow a detectable intra-ISCO region. Emission from within the ISCO is the dominant emission
component in the MAXI J1820 + 070 spectrum between 6 and 10 keV, highlighting the necessity of including this region. Our
continuum fitting model is made publicly available.
WASP-69b’s Escaping Envelope Is Confined to a Tail Extending at Least 7 RpSérgio Sacani
Studying the escaping atmospheres of highly irradiated exoplanets is critical for understanding the physical
mechanisms that shape the demographics of close-in planets. A number of planetary outflows have been observed
as excess H/He absorption during/after transit. Such an outflow has been observed for WASP-69b by multiple
groups that disagree on the geometry and velocity structure of the outflow. Here, we report the detection of this
planet’s outflow using Keck/NIRSPEC for the first time. We observed the outflow 1.28 hr after egress until the
target set, demonstrating the outflow extends at least 5.8 × 10⁵ km or 7.5 Rp This detection is significantly longer
than previous observations, which report an outflow extending ∼2.2 planet radii just 1 yr prior. The outflow is
blueshifted by −23 km s−1 in the planetary rest frame. We estimate a current mass-loss rate of 1 M⊕ Gyr−1
. Our
observations are most consistent with an outflow that is strongly sculpted by ram pressure from the stellar wind.
However, potential variability in the outflow could be due to time-varying interactions with the stellar wind or
differences in instrumental precision.
X-rays from a Central “Exhaust Vent” of the Galactic Center ChimneySérgio Sacani
Using deep archival observations from the Chandra X-ray Observatory, we present an analysis of
linear X-ray-emitting features located within the southern portion of the Galactic center chimney,
and oriented orthogonal to the Galactic plane, centered at coordinates l = 0.08◦
, b = −1.42◦
. The
surface brightness and hardness ratio patterns are suggestive of a cylindrical morphology which may
have been produced by a plasma outflow channel extending from the Galactic center. Our fits of the
feature’s spectra favor a complex two-component model consisting of thermal and recombining plasma
components, possibly a sign of shock compression or heating of the interstellar medium by outflowing
material. Assuming a recombining plasma scenario, we further estimate the cooling timescale of this
plasma to be on the order of a few hundred to thousands of years, leading us to speculate that a
sequence of accretion events onto the Galactic Black Hole may be a plausible quasi-continuous energy
source to sustain the observed morphology
Francesca Gottschalk - How can education support child empowerment.pptxEduSkills OECD
Francesca Gottschalk from the OECD’s Centre for Educational Research and Innovation presents at the Ask an Expert Webinar: How can education support child empowerment?
2024.06.01 Introducing a competency framework for languag learning materials ...Sandy Millin
http://sandymillin.wordpress.com/iateflwebinar2024
Published classroom materials form the basis of syllabuses, drive teacher professional development, and have a potentially huge influence on learners, teachers and education systems. All teachers also create their own materials, whether a few sentences on a blackboard, a highly-structured fully-realised online course, or anything in between. Despite this, the knowledge and skills needed to create effective language learning materials are rarely part of teacher training, and are mostly learnt by trial and error.
Knowledge and skills frameworks, generally called competency frameworks, for ELT teachers, trainers and managers have existed for a few years now. However, until I created one for my MA dissertation, there wasn’t one drawing together what we need to know and do to be able to effectively produce language learning materials.
This webinar will introduce you to my framework, highlighting the key competencies I identified from my research. It will also show how anybody involved in language teaching (any language, not just English!), teacher training, managing schools or developing language learning materials can benefit from using the framework.
Synthetic Fiber Construction in lab .pptxPavel ( NSTU)
Synthetic fiber production is a fascinating and complex field that blends chemistry, engineering, and environmental science. By understanding these aspects, students can gain a comprehensive view of synthetic fiber production, its impact on society and the environment, and the potential for future innovations. Synthetic fibers play a crucial role in modern society, impacting various aspects of daily life, industry, and the environment. ynthetic fibers are integral to modern life, offering a range of benefits from cost-effectiveness and versatility to innovative applications and performance characteristics. While they pose environmental challenges, ongoing research and development aim to create more sustainable and eco-friendly alternatives. Understanding the importance of synthetic fibers helps in appreciating their role in the economy, industry, and daily life, while also emphasizing the need for sustainable practices and innovation.
Acetabularia Information For Class 9 .docxvaibhavrinwa19
Acetabularia acetabulum is a single-celled green alga that in its vegetative state is morphologically differentiated into a basal rhizoid and an axially elongated stalk, which bears whorls of branching hairs. The single diploid nucleus resides in the rhizoid.
Embracing GenAI - A Strategic ImperativePeter Windle
Artificial Intelligence (AI) technologies such as Generative AI, Image Generators and Large Language Models have had a dramatic impact on teaching, learning and assessment over the past 18 months. The most immediate threat AI posed was to Academic Integrity with Higher Education Institutes (HEIs) focusing their efforts on combating the use of GenAI in assessment. Guidelines were developed for staff and students, policies put in place too. Innovative educators have forged paths in the use of Generative AI for teaching, learning and assessments leading to pockets of transformation springing up across HEIs, often with little or no top-down guidance, support or direction.
This Gasta posits a strategic approach to integrating AI into HEIs to prepare staff, students and the curriculum for an evolving world and workplace. We will highlight the advantages of working with these technologies beyond the realm of teaching, learning and assessment by considering prompt engineering skills, industry impact, curriculum changes, and the need for staff upskilling. In contrast, not engaging strategically with Generative AI poses risks, including falling behind peers, missed opportunities and failing to ensure our graduates remain employable. The rapid evolution of AI technologies necessitates a proactive and strategic approach if we are to remain relevant.
Model Attribute Check Company Auto PropertyCeline George
In Odoo, the multi-company feature allows you to manage multiple companies within a single Odoo database instance. Each company can have its own configurations while still sharing common resources such as products, customers, and suppliers.
Operation “Blue Star” is the only event in the history of Independent India where the state went into war with its own people. Even after about 40 years it is not clear if it was culmination of states anger over people of the region, a political game of power or start of dictatorial chapter in the democratic setup.
The people of Punjab felt alienated from main stream due to denial of their just demands during a long democratic struggle since independence. As it happen all over the word, it led to militant struggle with great loss of lives of military, police and civilian personnel. Killing of Indira Gandhi and massacre of innocent Sikhs in Delhi and other India cities was also associated with this movement.
June 3, 2024 Anti-Semitism Letter Sent to MIT President Kornbluth and MIT Cor...Levi Shapiro
Letter from the Congress of the United States regarding Anti-Semitism sent June 3rd to MIT President Sally Kornbluth, MIT Corp Chair, Mark Gorenberg
Dear Dr. Kornbluth and Mr. Gorenberg,
The US House of Representatives is deeply concerned by ongoing and pervasive acts of antisemitic
harassment and intimidation at the Massachusetts Institute of Technology (MIT). Failing to act decisively to ensure a safe learning environment for all students would be a grave dereliction of your responsibilities as President of MIT and Chair of the MIT Corporation.
This Congress will not stand idly by and allow an environment hostile to Jewish students to persist. The House believes that your institution is in violation of Title VI of the Civil Rights Act, and the inability or
unwillingness to rectify this violation through action requires accountability.
Postsecondary education is a unique opportunity for students to learn and have their ideas and beliefs challenged. However, universities receiving hundreds of millions of federal funds annually have denied
students that opportunity and have been hijacked to become venues for the promotion of terrorism, antisemitic harassment and intimidation, unlawful encampments, and in some cases, assaults and riots.
The House of Representatives will not countenance the use of federal funds to indoctrinate students into hateful, antisemitic, anti-American supporters of terrorism. Investigations into campus antisemitism by the Committee on Education and the Workforce and the Committee on Ways and Means have been expanded into a Congress-wide probe across all relevant jurisdictions to address this national crisis. The undersigned Committees will conduct oversight into the use of federal funds at MIT and its learning environment under authorities granted to each Committee.
• The Committee on Education and the Workforce has been investigating your institution since December 7, 2023. The Committee has broad jurisdiction over postsecondary education, including its compliance with Title VI of the Civil Rights Act, campus safety concerns over disruptions to the learning environment, and the awarding of federal student aid under the Higher Education Act.
• The Committee on Oversight and Accountability is investigating the sources of funding and other support flowing to groups espousing pro-Hamas propaganda and engaged in antisemitic harassment and intimidation of students. The Committee on Oversight and Accountability is the principal oversight committee of the US House of Representatives and has broad authority to investigate “any matter” at “any time” under House Rule X.
• The Committee on Ways and Means has been investigating several universities since November 15, 2023, when the Committee held a hearing entitled From Ivory Towers to Dark Corners: Investigating the Nexus Between Antisemitism, Tax-Exempt Universities, and Terror Financing. The Committee followed the hearing with letters to those institutions on January 10, 202
The Roman Empire A Historical Colossus.pdfkaushalkr1407
The Roman Empire, a vast and enduring power, stands as one of history's most remarkable civilizations, leaving an indelible imprint on the world. It emerged from the Roman Republic, transitioning into an imperial powerhouse under the leadership of Augustus Caesar in 27 BCE. This transformation marked the beginning of an era defined by unprecedented territorial expansion, architectural marvels, and profound cultural influence.
The empire's roots lie in the city of Rome, founded, according to legend, by Romulus in 753 BCE. Over centuries, Rome evolved from a small settlement to a formidable republic, characterized by a complex political system with elected officials and checks on power. However, internal strife, class conflicts, and military ambitions paved the way for the end of the Republic. Julius Caesar’s dictatorship and subsequent assassination in 44 BCE created a power vacuum, leading to a civil war. Octavian, later Augustus, emerged victorious, heralding the Roman Empire’s birth.
Under Augustus, the empire experienced the Pax Romana, a 200-year period of relative peace and stability. Augustus reformed the military, established efficient administrative systems, and initiated grand construction projects. The empire's borders expanded, encompassing territories from Britain to Egypt and from Spain to the Euphrates. Roman legions, renowned for their discipline and engineering prowess, secured and maintained these vast territories, building roads, fortifications, and cities that facilitated control and integration.
The Roman Empire’s society was hierarchical, with a rigid class system. At the top were the patricians, wealthy elites who held significant political power. Below them were the plebeians, free citizens with limited political influence, and the vast numbers of slaves who formed the backbone of the economy. The family unit was central, governed by the paterfamilias, the male head who held absolute authority.
Culturally, the Romans were eclectic, absorbing and adapting elements from the civilizations they encountered, particularly the Greeks. Roman art, literature, and philosophy reflected this synthesis, creating a rich cultural tapestry. Latin, the Roman language, became the lingua franca of the Western world, influencing numerous modern languages.
Roman architecture and engineering achievements were monumental. They perfected the arch, vault, and dome, constructing enduring structures like the Colosseum, Pantheon, and aqueducts. These engineering marvels not only showcased Roman ingenuity but also served practical purposes, from public entertainment to water supply.
Chapter 3 - Islamic Banking Products and Services.pptx
The green valley_is_a_red_herring_galaxy_zoo_reveals_two_evolutionary_pathways
1. Mon. Not. R. Astron. Soc. 000, 1–20 (2013)
Printed 21 February 2014
A
(MN L TEX style file v2.2)
arXiv:1402.4814v1 [astro-ph.GA] 19 Feb 2014
The Green Valley is a Red Herring:
Galaxy Zoo reveals two evolutionary pathways towards quenching
of star formation in early- and late-type galaxies
Kevin Schawinski1 †, C. Megan Urry2,3,4 , Brooke D. Simmons5 , Lucy Fortson6 , Sugata Kaviraj7 , William C. Keel8 , Chris J. Lintott5,9 , Karen L. Masters10,11 , Robert C.
Nichol10,11 , Marc Sarzi7 , Ramin, Skibba12 , Ezequiel Treister13 , Kyle W. Willett6 , O. Ivy
Wong14 and Sukyoung K. Yi15
1 Institute
for Astronomy, Department of Physics, ETH Zurich, Wolfgang-Pauli-Strasse 27, CH-8093 Zurich, Switzerland
Department of Physics, Yale University, P.O. Box 208120, New Haven, CT 06520-8120, USA
3 Yale Center for Astronomy and Astrophysics, Yale University, PO Box 208121, New Haven, CT 06520, USA
4 Department of Astronomy, Yale University, P.O. Box 208101, New Haven, CT 06520-8101, USA
5 Oxford Astrophysics, Denys Wilkinson Building, Keble Road, Oxford OX1 3RH, UK
6 School of Physics and Astronomy, University of Minnesota, Minneapolis, MN 55455, USA
7 Centre for Astrophysics Research, University of Hertfordshire, Hatfield, Herts AL1 9AB, UK
8 Department of Physics and Astronomy, University of Alabama, Box 870324, Tuscaloosa, AL 35487, USA
9 Adler Planetarium, 1300 S. Lakeshore Drive, Chicago, IL 60605
10 Institute of Cosmology and Gravitation, University of Portsmouth, Dennis Sciama Building, Burnaby Road, Portsmouth, PO1 3FX, UK
11 South East Physics Network; SEPNet; www.sepnet.ac.uk
12 Center for Astrophysics and Space Sciences, Department of Physics, University of California, 9500 Gilman Drive, San Diego, CA 92093, USA
13 Universidad de Concepción, Departamento de Astronomía, Casilla 160-C, Concepción, Chile
14 CSIRO Astronomy & Space Science, PO Box 76, Epping, NSW 1710, Australia
15 Department of Astronomy and Yonsei University Observatory, Yonsei University, Seoul 120-749, Republic of Korea
2
ABSTRACT
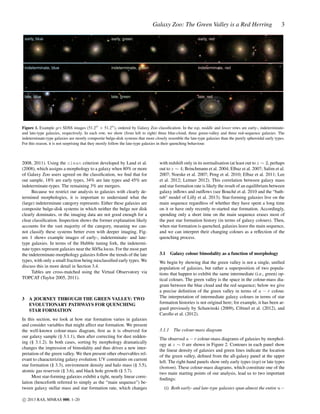
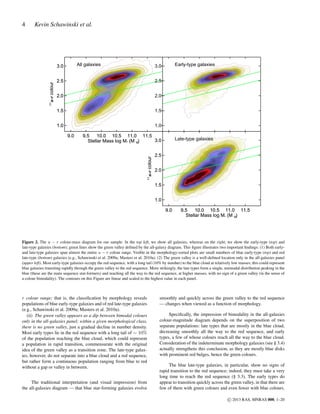
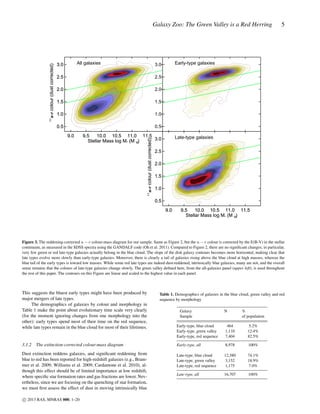
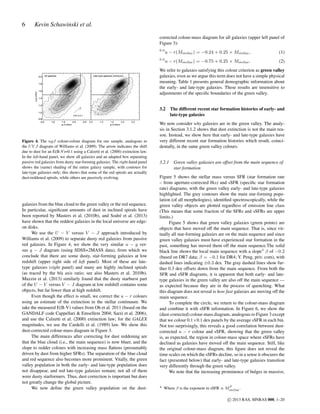
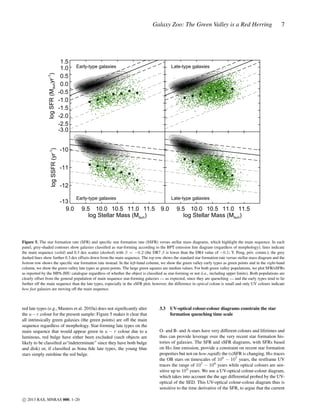
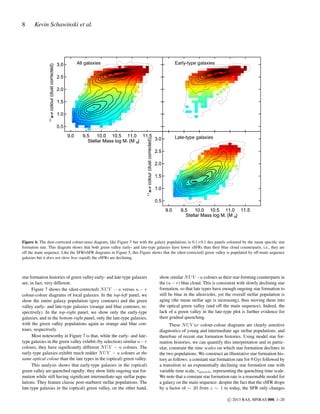
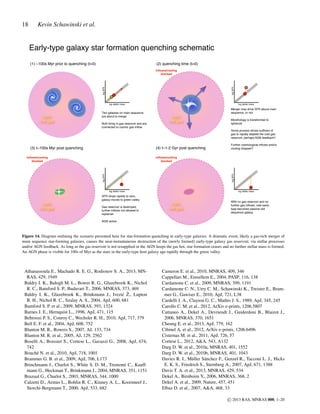
We use SDSS+GALEX+Galaxy Zoo data to study the quenching of star formation in lowredshift galaxies. We show that the green valley between the blue cloud of star-forming galaxies and the red sequence of quiescent galaxies in the colour-mass diagram is not a single transitional state through which most blue galaxies evolve into red galaxies. Rather, an analysis
that takes morphology into account makes clear that only a small population of blue earlytype galaxies move rapidly across the green valley after the morphologies are transformed
from disk to spheroid and star formation is quenched rapidly. In contrast, the majority of blue
star-forming galaxies have significant disks, and they retain their late-type morphologies as
their star formation rates decline very slowly. We summarize a range of observations that lead
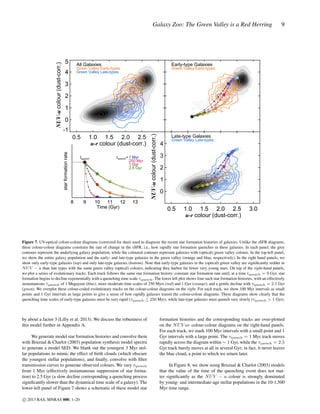
to these conclusions, including UV-optical colours and halo masses, which both show a striking dependence on morphological type. We interpret these results in terms of the evolution of
cosmic gas supply and gas reservoirs. We conclude that late-type galaxies are consistent with
a scenario where the cosmic supply of gas is shut off, perhaps at a critical halo mass, followed
by a slow exhaustion of the remaining gas over several Gyr, driven by secular and/or environmental processes. In contrast, early-type galaxies require a scenario where the gas supply
and gas reservoir are destroyed virtually instantaneously, with rapid quenching accompanied
by a morphological transformation from disk to spheroid. This gas reservoir destruction could
be the consequence of a major merger, which in most cases transforms galaxies from disk
to elliptical morphology, and mergers could play a role in inducing black hole accretion and
possibly AGN feedback.
Key words: galaxies: evolution; galaxies: active; galaxies: spiral; galaxies: elliptical and
lenticular, cD
c 2013 RAS
2. 2
1
Kevin Schawinski et al.
INTRODUCTION
Ever since the discovery of the bimodality in galaxy colour in the
galaxy colour-magnitude and colour-mass diagrams from largescale surveys (Strateva et al. 2001; Baldry et al. 2004, 2006), the
colour space between the two main populations — the green valley — has been viewed as the crossroads of galaxy evolution. The
galaxies in the green valley were thought to represent the transition
population between the blue cloud of star-forming galaxies and the
red sequence of quenched, passively evolving galaxies (e.g., Bell
et al. 2004; Wyder et al. 2007; Schiminovich et al. 2007; Martin et al. 2007; Faber et al. 2007; Mendez et al. 2011; Gonçalves
et al. 2012). Roughly speaking, all galaxies were presumed to follow similar evolutionary tracks across the green valley, with a fairly
rapid transition implied by the relative scarcity of galaxies in the
green valley compared to the blue cloud or red sequence.
The intermediate galaxy colours of green valley galaxies have
been interpreted as evidence for the recent quenching of star formation (Salim et al. 2007). The clustering of active galactic nuclei
(AGN) host galaxies in the green valley further suggested a role
for AGN feedback in particular (e.g., Nandra et al. 2007; Hasinger
2008; Silverman et al. 2008). Galaxies in the green valley have specific star formation rates (sSFR) lower than the “main sequence"
of star formation in galaxies, which is a tight correlation between
galaxy stellar mass and star formation rate, presumably as a result of quenching (e.g. Brinchmann et al. 2004; Elbaz et al. 2007;
Salim et al. 2007; Noeske et al. 2007; Peng et al. 2010; Elbaz et al.
2011; Lee et al. 2012; Leitner 2012)). Most star-forming galaxies
live on the main sequence, so tracing the populations leaving the
main sequence – those with lower sSFRs – probes the quenching
mechanism(s) and, as Peng et al. (2010) showed, there may be at
least two very different quenching processes.
Ultraviolet light comes predominantly from newly formed
massive stars, which makes UV observations an excellent probe of
the current rate of star formation. In this paper, we use UV-optical
colours from GALEX photometry (see e.g., Martin et al. 2007) to
investigate the rate at which galaxies are decreasing their sSFR (i.e.,
how rapidly they change colour), and whether this correlates with
morphology. Essentially, we use galaxy colours as stellar population clocks, an approach first conceived and applied by Tinsley and
collaborators (Tinsley 1968; Tinsley & Gunn 1976; Tinsley & Larson 1978).
We interpret the evolutionary tracks of disks in terms of
the gas supply and how star formation depletes the gas reservoir
(Schmidt 1959). Interestingly, what had appeared to be outliers
from the general parent galaxy population — namely, blue early
types (Schawinski et al. 2009a) and red late types (Masters et al.
2010a) — far from being curiosities, are instead a valuable clue to
galaxy evolution.
Morphology has not previously been a major ingredient in interpretations of the colour-mass diagram. Now that reliable morphological classifications have been made possible by citizen scientists in the Galaxy Zoo project (Lintott et al. 2008, 2011), we are
able to investigate the relation of galaxy morphology to colour and
mass. We also consider galaxy content and environment, now that
standardized information is available for large galaxy samples (e.g.
Baldry et al. 2004; Yang et al. 2007; Peng et al. 2010).
The Galaxy Zoo data have already enabled many insights
about the link between galaxy evolution and colour (Schawinski et al. 2009a; Masters et al. 2010a) and about the link between galaxy evolution and environment (e.g., Bamford et al. 2009;
Skibba et al. 2009), mergers (Darg et al. 2010a,b; Kaviraj et al.
2012; Teng et al. 2012), unusual galaxy types (Cardamone et al.
2009; Lintott et al. 2009; Keel et al. 2012), and specific morphological features such as bars (e.g., Masters et al. 2011; Hoyle et al.
2011; Skibba et al. 2012; Masters et al. 2012; Cheung et al. 2013;
Melvin et al. 2014). In this paper, Galaxy Zoo morphologies provide the key to understanding that early- and late-type galaxies,
even those with similar green optical colours, follow distinct evolutionary trajectories involving fundamentally different quenching
modes.
Throughout this paper, we use a standard ΛCDM Cosmology
(Ωm = 0.3, ΩΛ = 0.7 and H0 = 70 km−1 s−1 ), consistent with
observational measurements (Komatsu et al. 2011). All magnitudes
are in the AB system.
2
DATA
2.1
Catalog generation, SDSS, and multi-wavelength data
We briefly describe the data used in this paper. The galaxy sample is based on public photometric and spectroscopic data products from the Sloan Digital Sky Survey (SDSS) Data Release 7
(York et al. 2000; Abazajian et al. 2009). The initial sample selection and properties are described in Schawinski et al. (2010b) and
this catalogue is available on the web1 . The sample is limited in
redshift to 0.02 < z < 0.05 and limited in absolute luminosity
to Mz,Petro < −19.50 AB, in order to create an approximately
mass-limited sample. We adopt K corrections to z=0.0 from the
NYU-VAGC (Blanton et al. 2005; Padmanabhan et al. 2008; Blanton & Roweis 2007). The typical u − r → 0.0 u − r K correction is ∼ 0.05 mag, and omitting the correction does not change
any results significantly. We also obtain near-IR magnitudes from
2MASS (Skrutskie et al. 2006) via the NUY-VAGC.
We obtain aperture- and extinction-corrected star formation
rates and stellar masses from the MPA-JHU catalog (Kauffmann
et al. 2003; Brinchmann et al. 2004), which are calculated from the
SDSS spectra and broad-band photometry. The spectroscopic classifications, especially the AGN-classifications, derive from analysis with the GANDALF (Gas AND Absorption Line Fitting) code
(Cappellari & Emsellem 2004; Sarzi et al. 2006). Ultraviolet photometry for 71% of our sample comes from the Galaxy Evolution
Explorer (GALEX; Martin et al. 2005), matched via the Virtual Observatory. Observed optical and ultraviolet fluxes are both corrected
for dust reddening using estimates of internal extinction from the
public2 stellar continuum fits performed by Oh et al. (2011), applying the Cardelli et al. (1989) law.
2.2
Galaxy Zoo visual morphology classifications
We use Galaxy Zoo 1 visual classifications of galaxy morphologies3 from the Galaxy Zoo citizen science project (Lintott et al.
1
This publication has been made possible by the participation of more than 250,000 volunteers in the Galaxy Zoo
project. Their contributions are individually acknowledged at
http://www.galaxyzoo.org/Volunteers.aspx.
2 E-mail: kevin.schawinski@phys.ethz.ch, Twitter: @kevinschawinski
1
2
3
See http://data.galaxyzoo.org/.
See http://gem.yonsei.ac.kr/∼ksoh/wordpress/.
Data publicly available at http://data.galaxyzoo.org.
c 2013 RAS, MNRAS 000, 1–20
3. Galaxy Zoo: The Green Valley is a Red Herring
early, blue
early, green
early, red
indeterminate, blue
indeterminate, green
indeterminate, red
late, blue
late, green
3
late, red
Figure 1. Example gri SDSS images (51.2 × 51.2 ), ordered by Galaxy Zoo classification. In the top, middle and lower rows are early-, indeterminateand late-type galaxies, respectively. In each row, we show (from left to right) three blue-cloud, three green-valley and three red-sequence galaxies. The
indeterminate-type galaxies are mostly composite bulge-disk systems that more closely resemble the late-type galaxies than the purely spheroidal early types.
For this reason, it is not surprising that they mostly follow the late-type galaxies in their quenching behaviour.
2008, 2011). Using the clean criterion developed by Land et al.
(2008), which assigns a morphology to a galaxy when 80% or more
of Galaxy Zoo users agreed on the classification, we find that for
out sample, 18% are early types, 34% are late types and 45% are
indeterminate-types. The remaining 3% are mergers.
Because we restrict our analysis to galaxies with clearly determined morphologies, it is important to understand what the
(large) indeterminate category represents. Either these galaxies are
composite bulge-disk systems in which neither the bulge nor disk
clearly dominates, or the imaging data are not good enough for a
clear classification. Inspection shows the former explanation likely
accounts for the vast majority of the category, meaning we cannot classify these systems better even with deeper imaging. Figure 1 shows example images of early-, indeterminate- and latetype galaxies. In terms of the Hubble tuning fork, the indeterminate types represent galaxies near the S0/Sa locus. For the most part
the indeterminate-morphology galaxies follow the trends of the late
types, with only a small fraction being misclassified early types. We
discuss this in more detail in Section 3.4.
Tables are cross-matched using the Virtual Observatory via
TOPCAT (Taylor 2005, 2011).
3
A JOURNEY THROUGH THE GREEN VALLEY: TWO
EVOLUTIONARY PATHWAYS FOR QUENCHING
STAR FORMATION
In this section, we look at how star formation varies in galaxies
and consider variables that might affect star formation. We present
the well-known colour-mass diagram, first as it is observed for
our galaxy sample (§ 3.1.1), then after correcting for dust reddening (§ 3.1.2). In both cases, sorting by morphology dramatically
changes the impression of bimodality and thus drives a new interpretation of the green valley. We then present other observables relevant to characterizing galaxy evolution: UV constraints on current
star formation (§ 3.3), environment density and halo mass (§ 3.5),
atomic gas reservoir (§ 3.6), and black hole growth (§ 3.7).
Most star-forming galaxies exhibit a tight, nearly linear correlation (henceforth referred to simply as the “main sequence") between galaxy stellar mass and star formation rate, which changes
c 2013 RAS, MNRAS 000, 1–20
with redshift only in its normalisation (at least out to z ∼ 2, perhaps
out to z ∼ 4; Brinchmann et al. 2004; Elbaz et al. 2007; Salim et al.
2007; Noeske et al. 2007; Peng et al. 2010; Elbaz et al. 2011; Lee
et al. 2012; Leitner 2012). This correlation between galaxy mass
and star formation rate is likely the result of an equilibrium between
galaxy inflows and outflows (see Bouché et al. 2010 and the “bathtub" model of Lilly et al. 2013). Star-forming galaxies live on the
main sequence regardless of whether they have spent a long time
on it or have only recently re-started star formation. Accordingly,
spending only a short time on the main sequence erases most of
the past star formation history (in terms of galaxy colours). Then,
when star formation is quenched, galaxies leave the main sequence,
and we can interpret their changing colours as a reflection of the
quenching process.
3.1
Galaxy colour bimodality as a function of morphology
We begin by showing that the green valley is not a single, unified
population of galaxies, but rather a superposition of two populations that happen to exhibit the same intermediate (i.e., green) optical colours. The green valley is the space in the colour-mass diagram between the blue cloud and the red sequence; below we give
a precise definition of the green valley in terms of u − r colour.
The interpretation of intermediate galaxy colours in terms of star
formation histories is not original here; for example, it has been argued previously by Schawinski (2009), Cibinel et al. (2012), and
Carollo et al. (2012).
3.1.1
The colour-mass diagram
The observed u − r colour-mass diagrams of galaxies by morphology at z ∼ 0 are shown in Figure 2. Contours in each panel show
the linear density of galaxies and green lines indicate the location
of the green valley, defined from the all-galaxy panel at the upper
left. The right-hand panels show only early types (top) or late types
(bottom). These colour-mass diagrams, which constitute one of the
two main starting points of our analysis, lead us to two important
findings:
(i) Both early- and late-type galaxies span almost the entire u −
4. 4
Kevin Schawinski et al.
All galaxies
3.0
2.5
2.0
2.0
1.5
1.0
1.0
0.0
2.5
1.5
u-r colour
Early-type galaxies
3.0
9.5
10.0 10.5 11.0 11.5
9.0
9.5
10.0 10.5
Late-type galaxies
3.0
Stellar Mass log M* (M O)
•
11.0
11.5
2.5
2.0
0.0
u-r colour
9.0
1.5
1.0
9.0
9.5
10.0 10.5 11.0 11.5
Stellar Mass log M* (M O)
•
Figure 2. The u − r colour-mass diagram for our sample. In the top left, we show all galaxies, whereas on the right, we show the early-type (top) and
late-type galaxies (bottom); green lines show the green valley defined by the all-galaxy diagram. This figure illustrates two important findings: (1) Both earlyand late-type galaxies span almost the entire u − r colour range. Visible in the morphology-sorted plots are small numbers of blue early-type (top) and red
late-type (bottom) galaxies (e.g., Schawinski et al. 2009a; Masters et al. 2010a). (2) The green valley is a well-defined location only in the all-galaxies panel
(upper left). Most early-type galaxies occupy the red sequence, with a long tail (10% by number) to the blue cloud at relatively low masses; this could represent
blue galaxies transiting rapidly through the green valley to the red sequence. More strikingly, the late types form a single, unimodal distribution peaking in the
blue (these are the main sequence star-formers) and reaching all the way to the red sequence, at higher masses, with no sign of a green valley (in the sense of
a colour bimodality). The contours on this Figure are linear and scaled to the highest value in each panel.
r colour range; that is, the classification by morphology reveals
populations of blue early-type galaxies and of red late-type galaxies
(e.g., Schawinski et al. 2009a; Masters et al. 2010a).
(ii) The green valley appears as a dip between bimodal colours
only in the all-galaxies panel; within a given morphological class,
there is no green valley, just a gradual decline in number density.
Most early types lie in the red sequence with a long tail of ∼ 10%
of the population reaching the blue cloud, which could represent
a population in rapid transition, commensurate with the original
idea of the green valley as a transition zone. The late-type galaxies, however, do not separate into a blue cloud and a red sequence,
but rather form a continuous population ranging from blue to red
without a gap or valley in between.
The traditional interpretation (and visual impression) from
the all-galaxies diagram — that blue star-forming galaxies evolve
smoothly and quickly across the green valley to the red sequence
— changes when viewed as a function of morphology.
Specifically, the impression of bimodality in the all-galaxies
colour-magnitude diagram depends on the superposition of two
separate populations: late types that are mostly in the blue cloud,
decreasing smoothly all the way to the red sequence, and early
types, a few of whose colours reach all the way to the blue cloud.
Consideration of the indeterminate morphology galaxies (see § 3.4)
actually strengthens this conclusion, as they are mostly blue disks
with prominent red bulges, hence the green colours.
The blue late-type galaxies, in particular, show no signs of
rapid transition to the red sequence; indeed, they must take a very
long time to reach the red sequence (§ 3.3). The early types do
appear to transition quickly across the green valley, in that there are
few of them with green colours and even fewer with blue colours.
c 2013 RAS, MNRAS 000, 1–20
5. u-r colour (dust corrected)
Galaxy Zoo: The Green Valley is a Red Herring
All galaxies
3.0
Early-type galaxies
3.0
2.5
2.0
2.0
1.5
1.5
1.0
1.0
0.5
0.5
0.0
2.5
5
u-r colour (dust corrected)
9.5
10.0 10.5 11.0 11.5
9.0 Late-type 10.0 10.5
9.5
galaxies
3.0
Stellar Mass log M* (M O)
•
11.0
11.5
2.5
2.0
1.5
1.0
0.0
9.0
0.5
9.0
9.5
10.0 10.5 11.0 11.5
Stellar Mass log M* (M O)
•
Figure 3. The reddening-corrected u − r colour-mass diagram for our sample. Same as Figure 2, but the u − r colour is corrected by the E(B-V) in the stellar
continuum, as measured in the SDSS spectra using the GANDALF code (Oh et al. 2011). Compared to Figure 2, there are no significant changes; in particular,
very few green or red late-type galaxies actually belong in the blue cloud. The slope of the disk galaxy contours becomes more horizontal, making clear that
late types evolve more slowly than early-type galaxies. Moreover, there is clearly a tail of galaxies rising above the blue cloud at high masses, whereas the
blue tail of the early types is toward low masses. While some red late types are indeed dust-reddened, intrinsically blue galaxies, many are not, and the overall
sense remains that the colours of late-type galaxies change slowly. The green valley defined here, from the all-galaxies panel (upper left), is used throughout
the rest of this paper. The contours on this Figure are linear and scaled to the highest value in each panel.
This suggests the bluest early types might have been produced by
major mergers of late types.
The demographics of galaxies by colour and morphology in
Table 1 make the point about evolutionary time scale very clearly
(for the moment ignoring changes from one morphology into the
other): early types spend most of their time on the red sequence,
while late types remain in the blue cloud for most of their lifetimes.
3.1.2
The extinction-corrected colour-mass diagram
Dust extinction reddens galaxies, and significant reddening from
blue to red has been reported for high-redshift galaxies (e.g., Brammer et al. 2009; Williams et al. 2009; Cardamone et al. 2010), although this effect should be of limited importance at low redshift,
where specific star formation rates and gas fractions are lower. Nevertheless, since we are focusing on the quenching of star formation,
we must first assess the effect of dust in moving intrinsically blue
c 2013 RAS, MNRAS 000, 1–20
Table 1. Demographics of galaxies in the blue cloud, green valley and red
sequence by morphology
Galaxy
Sample
N
%
of population
Early-type, blue cloud
Early-type, green valley
Early-type, red sequence
464
1,110
7,404
5.2%
12.4%
82.5%
Early-type, all
8,978
100%
Late-type, blue cloud
Late-type, green valley
Late-type, red sequence
12,380
3,152
1,175
74.1%
18.9%
7.0%
Late-type, all
16,707
100%
6. 6
Kevin Schawinski et al.
corrected colour-mass diagram for all galaxies (upper left panel of
Figure 3):
0.0
2.0
All galaxies
(1)
u − r(Mstellar ) = −0.75 + 0.25 × Mstellar .
(2)
We refer to galaxies satisfying this colour criterion as green valley
galaxies, even as we argue this term does not have a simple physical
meaning. Table 1 presents general demographic information about
the early- and late-type galaxies. These results are insensitive to
adjustments of the specific boundaries of the green valley.
Late-type galaxies (contours)
1.8
u-g colour
u − r(Mstellar ) = −0.24 + 0.25 × Mstellar ,
0.0
1.6
1.4
1.2
3.2
1.0
E(B-V)=0.1
0.8
0.5
1.0
1.5
2.0
g-J colour
2.5
0.5
1.0
1.5
2.0
g-J colour
2.5
Figure 4. The ugJ colour-colour diagram for our sample, analogous to
the U V J diagram of Williams et al. (2009). The arrow indicates the shift
due to dust for an E(B-V)=0.1 using a Calzetti et al. (2000) extinction law.
In the left-hand panel, we show all galaxies and an adapted box separating
passive red galaxies from dusty star-forming galaxies. The right-hand panel
shows the (same) shading of the entire galaxy sample, with contours for
late-type galaxies only; this shows that some of the red spirals are actually
dust-reddened spirals, while others are passively evolving.
galaxies from the blue cloud to the green valley or the red sequence.
In particular, significant amounts of dust in inclined spirals have
been reported by Masters et al. (2010b), and Sodré et al. (2013)
have shown that the reddest galaxies in the local universe are edgeon disks.
We use the U − V versus V − J approach introduced by
Williams et al. (2009) to separate dusty red galaxies from passive
red galaxies. In Figure 4, we show the very similar u − g versus g − J diagram (using SDSS+2MASS data), from which we
conclude that there are some dusty, star-forming galaxies at low
redshift (upper right side of left panel). Most of these are latetype galaxies (right panel) and many are highly inclined spirals
(as traced by the b/a axis ratio; see also Masters et al. 2010b).
Muzzin et al. (2013) similarly found that the dusty starburst part
of the U − V versus V − J diagram at low redshift contains some
objects, but far fewer than at high redshift.
Even though the effect is small, we correct the u − r colours
using an estimate of the extinction in the stellar continuum. We
take the measured E(B-V) values from Oh et al. 2011 (based on the
GANDALF code Cappellari & Emsellem 2004; Sarzi et al. 2006),
and use the Calzetti et al. (2000) extinction law; for the GALEX
magnitudes, we use the Cardelli et al. (1989) law. We show this
dust-corrected colour-mass diagram in Figure 3.
The main differences after correcting for dust reddening are
that the blue cloud (i.e., the main sequence) is now bluer, and the
slope to redder colours with increasing mass flattens (presumably
driven by dust from higher SFRs). The separation of the blue cloud
and red sequence also becomes more prominent. Vitally, the green
valley population in both the early- and late-type population does
not disappear, and red late-type galaxies remain; not all of them
were dusty starformers. Thus, dust correction is important but does
not greatly change the global picture.
We now define the green valley population on the dust-
The different recent star formation histories of early- and
late-type galaxies
We now consider why galaxies are in the green valley. The analysis in Section 3.1.2 shows that dust extinction is not the main reason. Instead, we show here that early- and late-type galaxies have
very different recent star formation histories which result, coincidentally, in the same green valley colours.
3.2.1
Green valley galaxies are offset from the main sequence of
star formation
Figure 5 shows the stellar mass versus SFR (star formation rate
– from aperture-corrected Hα) and sSFR (specific star formation
rate) diagrams, with the green valley early- and late-type galaxies
highlighted. The grey contours show the main star-forming population (of all morphologies), identified spectroscopically, while the
green valley objects are plotted regardless of emission line class
(This means that some fraction of the SFRs and sSFRs are upper
limits.)
Figure 5 shows that green valley galaxies (green points) are
objects that have moved off the main sequence. That is, since virtually all star-forming galaxies are on the main sequence and since
green valley galaxies must have experienced star formation in the
past, something has moved them off the main sequence.The solid
black line shows the local main sequence with a slope4 β of −0.2
(based on DR7 data; β = −0.1 for DR4; Y. Peng, priv. com), with
dashed lines indicating ±0.3 dex. The gray dashed lines show further 0.3 dex offsets down from the main sequence. From both the
SFR and sSFR diagrams, it is apparent that both early- and latetype galaxies in the green valley are also off the main sequence —
as expected because they are in the process of quenching. What
this diagram does not reveal is how fast galaxies are moving off the
main sequence.
To complete the circle, we return to the colour-mass diagram
and combine it with sSFR information. In Figure 6, we show the
(dust-corrected) colour-mass diagram, analogous to Figure 3 except
that we colour 0.1×0.1 dex panels by the average sSFR in each bin.
Not too surprisingly, this reveals a good correlation between dustcorrected u − r colour and sSFR, showing that the green valley
is, as expected, the region in colour-mass space where sSFRs have
declined as galaxies have moved off the main sequence. Still, like
the original colour-mass diagram, this figure does not reveal the
time scales on which the sSFRs decline, so in a sense it obscures the
fact (presented below) that early- and late-type galaxies transition
very differently through the green valley.
We note that the increasing prominence of bulges in massive,
4
β
Where β is the exponent in sSFR ∝ Mstellar .
c 2013 RAS, MNRAS 000, 1–20
7. log SSFR (yr-1)
log SFR (Msunyr-1)
Galaxy Zoo: The Green Valley is a Red Herring
1.5
1.0
0.5
0.0
-0.5
-1.0
-1.5
-2.0
-2.5
-3.0
Early-type galaxies
7
Late-type galaxies
log Stellar Mass (Msun)
-10
-11
-12
-13
9.0
Early-type galaxies
9.5 10.0 10.5 11.0 11.5
log Stellar Mass (Msun)
Late-type galaxies
9.0
9.5 10.0 10.5 11.0 11.5
log Stellar Mass (Msun)
Figure 5. The star formation rate (SFR) and specific star formation rate (SSFR) versus stellar mass diagrams, which highlight the main sequence. In each
panel, grey-shaded contours show galaxies classified as star-forming according to the BPT emission line diagram (regardless of morphology); lines indicate
the main sequence (solid) and 0.3 dex scatter (dashed) with β = −0.2 (the DR7 β is lower than the DR4 value of −0.1; Y. Peng, priv. comm.); the grey
dashed lines show further 0.3 dex offsets down from the main sequence. The top row shows the standard star formation rate versus stellar mass diagram and the
bottom row shows the specific star formation rate instead. In the left-hand column, we show the green valley early types as green points and in the right-hand
column, we show the green valley late types as green points. The large green squares are median values. For both green valley populations, we plot SFR/sSFRs
as reported by the MPA-JHU catalogue regardless of whether the object is classified as star-forming or not (i.e., including upper limits). Both populations are
clearly offset from the general population of main sequence star-forming galaxies — as expected, since they are quenching — and the early types tend to lie
further off the main sequence than the late types, especially in the sSFR plot; however, the difference in optical colour is small and only UV colours indicate
how fast galaxies are moving off the main sequence.
red late types (e.g., Masters et al. 2010a) does not significantly alter
the u − r colour for the present sample: Figure 5 makes it clear that
all intrinsically green galaxies (the green points) are off the main
sequence regardless of morphology. Star-forming late types on the
main sequence that would appear green in u − r colour due to a
luminous, red bulge have either been excluded (such objects are
likely to be classified as“indeterminate” since they have both bulge
and disk) or, if classified as bona fide late types, the young blue
stars simply outshine the red bulge.
c 2013 RAS, MNRAS 000, 1–20
3.3
UV-optical colour-colour diagrams constrain the star
formation quenching time scale
O- and B- and A-stars have very different colours and lifetimes and
thus can provide leverage over the very recent star formation histories of galaxies. The SFR and sSFR diagrams, with SFRs based
on Hα line emission, provide a constraint on recent star formation
properties but not on how rapidly the (s)SFR is changing. Hα traces
the OB stars on timescales of 106 − 107 years, the restframe UV
traces the range of 107 − 108 years while optical colours are sensitive up to 109 years. We use a UV-optical colour-colour diagram,
which takes into account the the age differential probed by the UVoptical of the SED. This UV-optical colour-colour diagram thus is
sensitive to the time derivative of the SFR, to argue that the current
8. Kevin Schawinski et al.
All galaxies
3.0
Early-type galaxies
2.5
2.0
1.5
1.0
0.0
u-r colour (dust corrected)
8
0.5
u-r colour (dust corrected)
9.5
10.0 10.5 11.0 11.5
3.0
Stellar Mass log M* (M O)
•
Late-type galaxies
2.5
2.0
1.5
1.0
0.0
9.0
0.5
9.0
9.5
10.0 10.5 11.0 11.5
Stellar Mass log M* (M O)
•
Figure 6. The dust-corrected colour-mass diagram, like Figure 3 but with the galaxy populations in 0.1×0.1 dex panels coloured by the mean specific star
formation rate. This diagram shows that both green valley early- and late-type galaxies have lower sSFRs than their blue cloud counterparts, i.e., they are
off the main sequence. Like the SFR/sSFR diagrams in Figure 5, this Figure shows that the (dust-corrected) green valley is populated by off-main sequence
galaxies but it does not show how rapidly the sSFRs are declining.
star formation histories of green valley early- and late-type galaxies
are, in fact, very different.
Figure 7 shows the (dust-corrected) N U V − u versus u − r
colour-colour diagrams of local galaxies. In the top-left panel, we
show the entire galaxy population (grey contours) and the green
valley early- and late-type galaxies (orange and blue contours, respectively). In the top-right panel, we show only the early-type
galaxies, and in the bottom-right panel, only the late-type galaxies,
with the green valley populations again as orange and blue contours, respectively.
Most noteworthy in Figure 7 is that, while the early- and latetype galaxies in the green valley exhibit (by selection) similar u − r
colours, they have significantly different N U V − u colours. The
early-type galaxies exhibit much redder N U V − u colours at the
same optical colour than the late types in the (optical) green valley.
This analysis shows that early-type galaxies in the (optical)
green valley are quenched rapidly: they show little ongoing star formation while still having significant intermediate-age stellar populations. They feature classic post-starburst stellar populations. The
late-type galaxies in the (optical) green valley, on the other hand,
show similar N U V −u colours as their star-forming counterparts in
the (u − r) blue cloud. This is consistent with slowly declining star
formation, so that late types have enough ongoing star formation to
still be blue in the ultraviolet, yet the overall stellar population is
aging (the mean stellar age is increasing), thus moving them into
the optical green valley (and off the main sequence). Indeed, the
lack of a green valley in the late-type plot is further evidence for
their gradual quenching.
These N U V ur colour-colour diagrams are clearly sensitive
diagnostics of young and intermediate age stellar populations, and
therefore of recent star formation histories. Using model star formation histories, we can quantify this interpretation and in particular, constrain the time scales on which star formation declines in
the two populations. We construct an illustrative star formation history as follows: a constant star formation rate for 9 Gyr followed by
a transition to an exponentially declining star formation rate with
variable time scale, τquench , representing the quenching time scale.
We note that a constant star formation rate is a reasonable model for
a galaxy on the main sequence: despite the fact that the sSFR drops
by a factor of ∼ 20 from z ∼ 1 to today, the SFR only changes
c 2013 RAS, MNRAS 000, 1–20
9. 5
All Galaxies
4
9
Early-type Galaxies
Green Valley Early-types
Green Valley Late-types
Green Valley Early-types
3
2
1
0
-1
star formation rate
0.5
1.0 1.5 2.0 2.5
u-r colour (dust-corr.)
tquench
8
9
τquench= 1 Myr
250 Myr
1 Gyr
2.5 Gyr
10
11
12
Time (Gyr)
NUV-u colour (dust-corr.)
Galaxy Zoo: The Green Valley is a Red Herring
Late-type Galaxies
4
Green Valley Late-types
3
2
1
0
13
0.5
1.0 1.5 2.0 2.5
u-r colour (dust-corr.)
3.0
Figure 7. UV-optical colour-colour diagrams (corrected for dust) used to diagnose the recent star formation histories of galaxies. Unlike the sSFR diagrams,
these colour-colour diagrams constrain the rate of change in the sSFR, i.e., how rapidly star formation quenches in these galaxies. In each panel, the grey
contours represent the underlying galaxy population, while the coloured contours represent galaxies with (optical) green valley colours. In the top-left panel,
we show the entire galaxy population and the early- and late-type galaxies in the green valley (orange and blue, respectively). In the right hand panels, we
show only early-type galaxies (top) and only late-type galaxies (bottom). Note that early-type galaxies in the (optical) green valley are significantly redder in
N U V − u than late types with the same green valley (optical) colours, indicating they harbor far fewer very young stars. On top of the right-hand panels,
we plot a series of evolutionary tracks. Each track follows the same star formation history: constant star formation rate until, at a time tquench = 9 Gyr, star
formation begins to decline exponentially with a quenching time scale τquench . The lower left plot shows four such star formation histories, with an effectively
instantaneous τquench of 1 Megayear (blue); more moderate time scales of 250 Myrs (red) and 1 Gyr (orange); and a gentle decline with τquench = 2.5 Gyr
(green). We overplot these colour-coded evolutionary tracks on the colour-colour diagrams on the right. For each track, we show 100 Myr intervals as small
points and 1 Gyr intervals as large points to give a sense of how rapidly galaxies transit the colour-colour diagrams. These diagrams show clearly that the
quenching time scales of early-type galaxies must be very rapid (τquench 250 Myr), while late-type galaxies must quench very slowly (τquench > 1 Gyr).
by about a factor 3 (Lilly et al. 2013). We discuss the robustness of
this model further in Appendix A.
We generate model star formation histories and convolve them
with Bruzual & Charlot (2003) population synthesis model spectra
to generate a model SED. We blank out the youngest 3 Myr stellar populations to mimic the effect of birth clouds (which obscure
the youngest stellar populations), and finally, convolve with filter
transmission curves to generate observed colours. We vary τquench
from 1 Myr (effectively instantaneous suppression of star formation) to 2.5 Gyr (a slow decline corresponding a quenching process
significantly slower than the dynamical time scale of a galaxy). The
lower-left panel of Figure 7 shows a schematic of these model star
c 2013 RAS, MNRAS 000, 1–20
formation histories and the corresponding tracks are over-plotted
on the N U V ur colour-colour diagrams on the right-hand panels.
For each track, we mark 100 Myr intervals with a small point and 1
Gyr intervals with a large point. The τquench = 1 Myr track moves
rapidly across the diagram within ∼ 1 Gyr, while the τquench = 2.5
Gyr track barely moves at all in several Gyr; in fact, it never leaves
the blue cloud, a point to which we return later.
In Figure 8, we show using Bruzual & Charlot (2003) models
that the value of the time of the quenching event does not matter significantly as the N U V − u colour is strongly dominated
by young- and intermediate-age stellar populations in the 10-1,500
Myr time range.
10. 10
Kevin Schawinski et al.
5
4
All Galaxies
4
NUV-u colour (dust-corr.)
NUV-u colour
3
2
1
3
2
1
0
0
6
8
10
Time (Gyr)
-1
12
Figure 8. The evolution of the N U V − u colour based on BC03 models
following the simple quenching model described in Section 3.3. At some
time tquench , a constant SFR star formation history is interrupted and enters
an exponential decline with τ = 100 Myr. We vary tquench from 7 to 10
Gyr age to show that the precise quenching time has no significant effect on
the N U V − u colour after the rapid (∼ 100 Myr)colour transition. This
figure illustrates the sensitivity of the N U V − u colour to short timescales
in the 10-1,500 Myr range. With a dynamic range of nearly 4 mag, this
colour is ideal for tracing quenching time scales.
We compare these tracks to the observed locations of earlyand late-type galaxies on the N U V ur diagram. The early-type
galaxies in the green valley are well matched by tracks with very
short τquench . Both the instantaneous truncation track and the track
with τquench = 250 Myr pass straight through the early-type green
valley locus before reaching the red sequence. The τquench = 1
Gyr track misses the main early-type locus and in fact stalls in the
green valley. If early-type galaxies were quenching as slowly as
τquench = 1 Gyr, they would build up in the green valley, which is
not observed (Figure 3).
The late-type galaxies in the green valley are inconsistent with
most quenching tracks. The τquench = 1 Gyr barely goes through
the late-type blue cloud locus. Only the τquench = 2.5 Gyr track
passes through the bulk of the population. This indicates that long
quenching time scales (several Gyrs) are required to explain the
colour-colour evolution of late types.
We conclude from the N U V ur colour-colour diagram that
early- and late-type galaxies follow very different evolutionary
pathways to and through the green valley. Early-type galaxies undergo a rapid end to star formation, transiting the green valley
rapidly, perhaps as rapidly as stellar evolution allows. By the time
they appear in the green valley, most if not all star formation has
ceased. Late-type galaxies, in contrast, experience at most a slow
decline in star formation and gradual departure from the main sequence. The slowly declining star formation leads to increasingly
red optical colours but not necessarily redder UV-optical colours,
because extremely young, luminous stars continue to form.
3.4
Green Valley Early-types
Green Valley Late-types
Green Valley Indeterminatetypes
Caveat: Indeterminate-type galaxies
We now revisit the question of the large population of
indeterminate-type galaxies (the galaxies that did not receive at
least 80% agreement in any morphological category). As is ap-
0.5
1.0
1.5
2.0
u-r colour (dust-corr.)
2.5
3.0
Figure 9. N U V ur diagram, similar to the upper left panel in Figure 7 but
showing the indeterminate-type galaxies as green contours, with early types
as orange contours and late types as blue contours. The bulk of the green
valley indeterminate-types overlap the green valley late-type locus, with
somewhat redder colours, with a minority scattering to the early-type locus.
This supports a picture where the indeterminate-types quenching slowly,
similar to the late types, with the minority misclassified early types possibly
quenching more rapidly.
parent in Figure 1, most of the indeterminate-types show disk features. In Figure 9, we show the N U V ur diagram (dust-corrected)
analogous to Figure 7, but with the green valley indeterminate-type
galaxies overplotted as green contours. The bulk of the green valley
indeterminate-types overlap the green valley late-type locus, with
somewhat redder colours, with a minority scattering to the earlytype locus, no doubt because some of them have big red bulges.
The indeterminate-types thus mostly quench slowly, similar to the
late types, with a minority being misclassified early types, which
quench rapidly.
The indeterminate-types do not appear to represent an intermediate quenching pathway between the extremes of early- and
late-type galaxies. Instead, most follow the late types (likely related
to also having a disk), with a minority following the early types,
presumably because they are misclassified early types. A more precise investigation of how the indeterminates fit into the general picture presented here will have to rely on future, better imaging data.
3.5
Local environment, halo mass and satellite fraction of
galaxies in the green valley
We now investigate whether the environments of early- and latetype galaxies in the green valley can be linked to their very different recent star formation histories. We use the Yang et al. (2007)
group catalogue which yields a statistical estimate of the halo mass
for each galaxy group, and whether any galaxy is the most massive/luminous in the group (central vs. satellite).
In Figure 10, we show the colour-mass diagram of both early(top) and late-type (bottom) galaxies split by halo mass (at Mhalo =
1012 M /h). The value 1012 M is motivated by previous work
on halo quenching (e.g., Cattaneo et al. 2006; Dekel & Birnboim
2006).
We find a striking difference between the early- and late-type
galaxies. The green valley early-type galaxies are present in both
c 2013 RAS, MNRAS 000, 1–20
11. Early-type galaxies
3.0
11
Early-type galaxies
2.5
2.0
1.5
1.0
0.0
u-r colour (dust corrected)
Galaxy Zoo: The Green Valley is a Red Herring
Mhalo < 1012 Msun/h
Mhalo > 1012 Msun/h
Late-type galaxies
3.0
Late-type galaxies
2.5
2.0
1.5
1.0
0.0
u-r colour (dust corrected)
0.5
Mhalo < 1012 Msun/h
0.5
9.0
9.5
10.0 10.5 11.0 11.5
Stellar Mass log M* (M O)
•
Mhalo > 1012 Msun/h
9.0
9.5
10.0 10.5 11.0 11.5
Stellar Mass log M* (M O)
•
Figure 10. Dust-corrected colour-stellar mass diagrams of early- and late-type galaxies (top- and bottom rows) split by halo mass (from Yang et al. 2007) into
low mass (left) and high mass haloes (right; split at Mhalo = 1012 M /h). Only small, qualitative differences are seen in the early-type galaxies, whereas
quite striking differences appear in the late types. The green valley early types are present in both low and high-mass haloes; in low-mass haloes, they are
mostly centrals, and in high mass haloes, mostly satellites. In contrast, the blue cloud late types are mostly in low-mass haloes, while the green valley late
types are mostly in massive haloes, and are largely centrals.This makes clear that quenching of star formation in late-type galaxies is closely related to halo
mass; those with Mhalo = 1012 M /h are partly or mostly quenched, suggesting that accretion of mass through the halo slows or stops above this value.
low- and high-mass haloes. The late types show a very dramatic
split: the blue cloud (i.e., main sequence) late types are mostly in
low-mass haloes, while the green valley and red sequence late types
(i.e., partially or mostly quenched) are almost exclusively in high
mass haloes. In other words, early types quench in all environments
whereas the quenching in late types is clearly different above and
below a halo mass of 1012 M /h.
Similar results were reported previously by Skibba et al.
(2009), who found that late-type quenching is associated with environment, and that late types may be able to quench without an associated morphological transformation. For an in-depth discussion
of the stellar mass to halo mass relationship, see Behroozi et al.
(2010)
3.6
Atomic hydrogen gas in green valley galaxies
We now turn to another aspect of quenching: the gas supply for star
formation. Based on the previous sections, we would expect latec 2013 RAS, MNRAS 000, 1–20
type galaxies in the green valley to retain sizable reservoirs of gas
to sustain ongoing, though slowly declining, star formation, while
early-type galaxies should be gas poor to account for a rapid drop
in new star formation.
In order to test this hypothesis, we matched our sample to the
HI database from the 40% Arecibo Legacy Fast ALFA Survey (ALFALFA; Haynes et al. 2011). In Table 2, we report the numbers of
early- and late-type galaxies in the green valley that were covered
and detected in the ALFALFA survey.
We find that 48% of all green valley late-type galaxies were
detected in HI by the ALFALFA survey, consistent with many of
them retaining significant gas reservoirs. In contrast, only 8% of
green valley early-type galaxies were detected in HI, supporting the
picture that their star formation was quenched rapidly by removing
(or ionizing) the available gas.
On a related note, we have an ongoing program to observe
the HI kinematics of green valley early-type galaxies and find that
12. Kevin Schawinski et al.
5
All Galaxies
Early-type Galaxies
Green Valley Early-types
Green Valley Late-types
4
Green Valley Early-types
3
2
1
0
Seyfert AGN
-1
star formation rate
0.5
1.0 1.5 2.0 2.5
u-r colour (dust-corr.)
τquench= 1 Myr
250 Myr
1 Gyr
2.5 Gyr
tquench
8
9
10
11
12
Time (Gyr)
NUV-u colour (dust-corr.)
12
Late-type Galaxies
4
Green Valley Late-types
3
Seyfert AGN
2
1
0
13
0.5
1.0 1.5 2.0 2.5
u-r colour (dust-corr.)
3.0
Figure 11. N U V ur diagram, same as Figure 7, but showing the emission line-selected AGN host galaxies as green points. This diagram places these AGN host
galaxies in the context of quenching scenarios: both early-type and late-type AGN hosts lie squarely in the (optical) green valley, a few hundred Megayears or
longer after the quenching event. In both cases, the AGN identified via emission lines cannot be responsible for the quenching, as they appear several hundred
Megayears along the quenching tracks.
Table 2. HI properties of galaxies in the green valley (from 40% ALFALFA
data)
Sample
Green Valley...
N
covered
N
detected
N
un-detected
HI Detection
fraction
Early-type Galaxies
Late-type Galaxies
349
912
28
435
321
477
8%
48%
most of them show highly disturbed gas kinematics consistent with
having experienced recent mergers (Wong et al. in prep).
3.7
Black hole growth and galaxies in the green valley
We now turn to the question of how the growth of supermassive
black holes in the centers of galaxies might be related to the separate evolutionary pathways for quenching star formation in early-
and late-type galaxies. In fact, the present work provides context
for interpreting our earlier Galaxy Zoo AGN host galaxy study
(Schawinski et al. 2010b).
In Figure 11, we show the same N U V ur colour-colour diagram as in Figure 7, with emission line-selected AGN host galaxies added as green points (see Schawinski et al. 2010b for AGN
selection details). All AGN are narrow-line Type 2 (obscured)
AGN, so there should be no contribution of AGN continuum to the
UV/optical colours. Both early- (top right) and late-type (bottom
right) AGN host galaxies cluster in the (optical) green valley. This
is why it has been suggested previously that black hole accretion
is correlated with a decline in sSFR (and therefore green colours;
e.g., Schawinski et al. 2007b; Wild et al. 2007; Nandra et al. 2007;
Silverman et al. 2008).
Comparing to the evolutionary tracks in Figures 7 and 11, it is
clear that in most cases, AGN signatures become visible well past
quenching time. We make no assumption on the AGN life time here,
but consider when, during the evolutionary stage of the host galaxy,
black hole accretion is favoured. This delay between the shutdown
of star formation and the detection of (emission-line selected) AGN
c 2013 RAS, MNRAS 000, 1–20
13. Galaxy Zoo: The Green Valley is a Red Herring
has been noted previously (Schawinski et al. 2007b; Wild et al.
2007; Davies et al. 2007; Schawinski et al. 2009c,c); several hundred Myr or more must elapse between the end of star formation
in early types and the detection of an optical AGN (Gyrs for the
late types), even assuming instantaneous quenching (see discussion in Schawinski et al. 2007b, 2009c). This implies that the AGN
radiation from green valley early-type galaxies is not responsible
for the rapid quenching of star formation seen in them. Rather, the
AGN activity is plausibly an after-effect of the event that triggered
quenching, rather than its cause.
In late-type galaxies (Fig. 11, bottom right), black hole accretion is visible in the green valley and continues as the galaxy slowly
ages to redder colours. The N U V − u colour shows that many
late-type galaxies — including the AGN host galaxies — still have
young stars (see also Cortese 2012).
These statements are inferred from a sample of emission lineselected AGN; it is important to check whether AGN samples based
on other (more inclusive) selections show the same trends.
4.1
4
ψ=
DISCUSSION: EVOLUTIONARY TRACKS RELATED
TO THE END OF STAR FORMATION
We have used a series of observational results, informed by morphological classifications, to develop a broad picture of how and
why early- and late-type galaxies at z ∼ 0 transform from blue
star-forming galaxies into passively evolving red galaxies. Here we
review the evidence presented in Section 3, then discuss our interpretation.
We first verified that dust extinction, while present, is not the
main reason most galaxies have green colours. We then assessed the
recent star formation properties of green valley galaxies, as traced
by emission lines and by the location of green valley galaxies compared to the main sequence. Both indicators show that low star formation rates are the reason green valley galaxies — regardless of
morphology — exhibit green optical colours.
We then considered the UV-optical colours of galaxies in the
optical (u − r) green valley, the UV (from GALEX) being more
sensitive to the youngest stars than purely optical colours. We found
that, when early-type galaxies are in the (optical) green valley, their
UV-optical colours are much redder than those of late-type green
valley galaxies. This supports the idea that the two morphological
classes have fundamentally different recent star formation histories
(i.e. different UV-u colors), even after the initial stellar populations
have aged in a similar way (i.e. optical colors are green). We used
model evolutionary tracks to show that this difference corresponds
to very different time scales on which star formation declines: in
early-type galaxies, the quenching time scale is much shorter (<
250 Myr) than in late-type galaxies (> 1 Gyr).
All this evidence leads to a coherent physical picture where a
quenching event destroys the (quasi) equilibrium state of main sequence star-forming galaxies, moving them off the main sequence
into the green valley. The data clearly show that the time scale for
this colour evolution is strongly tied to morphology. We now argue
that two quenching pathways — for early-type and for late-type
galaxies — can be tied to two different scenarios for destroying gas
reservoirs, i.e., to two different physical quenching mechanisms.
Because most star-forming galaxies start on the main sequence of
star formation, where a simple regulator balances cosmological inflows of gas with outflows (Lilly et al. 2013), we take the main
sequence as the starting point of the evolutionary models discussed
below.
c 2013 RAS, MNRAS 000, 1–20
13
The evolution of late-type galaxies
We have shown that the star formation histories of late-type galaxies are consistent with a very gradual quenching, corresponding to
an exponential time scale of a gigayear or more. A natural explanation is that the baryon supply is disrupted, so that the star formation
rate declines slowly in response to the depletion of the gas reservoir. The disruption could be due to halo mass quenching (e.g.,
Cattaneo et al. 2006), the end of cold streams and the development
of a hot halo due to shocks (Dekel & Birnboim 2006; Dekel et al.
2009), or simply the continued expansion of the virial radius to a
point where cooling from the halo to the disk becomes inefficient
(i.e., too slow). While other environmental processes may also play
a role — for example, ram pressure, stripping, or harassment (see
Tonnesen 2011 and Vollmer 2013 for recent reviews) — these local considerations cannot explain the global behavior of late-type
galaxies as a class.
The rate at which star formation exhausts gas can be written
in a dynamical form as (Guiderdoni et al. 1998; Hatton et al. 2003;
Kaviraj et al. 2011):
Mgas
,
τdyn
(3)
where ψ is the SFR, Mgas is the gas reservoir available for star
formation, τdyn is the dynamical time scale, and is the (fixed) efficiency of star formation (we assume the universal value = 2%;
e.g., Kennicutt 1998). The dynamical time scale for the disk of a
massive galaxy is on the order of τdyn ∼ 50 − 300 Myr. The
mass of the gas reservoir is a free parameter set by the initial conditions. Once the initial gas reservoir is specified and a reasonable
dynamical time scale is chosen, Eqn. 3 can be solved to describe
the evolution of the system. The e-folding time for the declining
star formation rate is τdyn / , which is several Gyr for the adopted
parameters5 . That is, galaxies with a gas reservoir that does not get
replenished from outside will continue to form stars for a very long
time, peeling off from the main sequence of star formation very
slowly, as previously argued by Kaviraj et al. (2011). In Figure 12,
we show how the specific star formation rates, u − r colours, and
gas fractions evolve according to Eqn. 3 for a range of quenching
time scales.
The evolution of late-type galaxies corresponds to the longer
time scale tracks in Figure 12. This means there is enough time to
develop a significant population of late types in the green valley
and, eventually, the red sequence. Late-type galaxies in the green
valley should still have substantial gas reservoirs that fuel ongoing
star formation. Initial data from HI data support this (Section 3.6).
The start of quenching may occur at (very) high redshift, as
it can take several Gyrs for the effects of a slowly declining star
formation rate to become apparent. In this context, red spirals (e.g.,
van den Bergh 1976; Wolf et al. 2009; Masters et al. 2010a) are
simply late-type galaxies whose cutoff happened relatively early.
The observation of Masters et al. (2010a) and Cortese (2012) that
red spirals still show signs of low-level star formation make sense
— they are simply very far along the exponential decline in SFR
off the main sequence.
The reddest colours in late-type galaxies preferentially occur
in high mass haloes (Fig. 10), supporting the suggestion that the gas
supply is somehow regulated by environmental factors. Of course,
5
This time scale for gas depletion corresponds to what happens in the
“bathtub” model of Lilly et al. (2013) when the gas supply to the reservoir
is shut off.
14. 14
Kevin Schawinski et al.
log SSFR (yr-1)
-9
-10
-11
-12
-13
u-r colour
-14
2.5
2.0
1.5
log fgas (M O)
•
1.0
0.5
0.0
-0.5
-1.0
-1.5
-2.0
-2.5
-3.0
τquench=
1 Myr
250 Myr
1 Gyr
2.5 Gyr
7
8
9
10
11
12
13
14
Time (Gyr)
Figure 12. Diagram showing the evolution of a galaxy corresponding to the quenching scenarios discussed in the text. The star formation rate is constant until
quenching begins at t = 9 Gyr, then declines exponentially with τquench ∈ {1, 250, 1000, 2500} Myr. (Top panel:) evolution of the specific star formation
rate (sSFR); (middle panel:) u − r colour evolution; (bottom panel:) gas fraction, inferred from the star formation rate by inverting the Schmidt law (Eqn. 3).
other factors besides halo mass can increase the pace of gas depletion following the original quenching event — and this must
happen: Figure 7 shows some objects with quenching time scales
slightly shorter than that expected from canonical parameters.
For example, bars naturally shorten gas consumption time
scales, by driving gas into the central regions of galaxies where it
can be consumed more quickly. Masters et al. (2011, 2012) found
that the incidence of bars in massive late-type galaxies increases as
they become redder. This could be a side effect of quenching —
models show that bars form more quickly in gas-poor disks (e.g.,
Athanassoula et al. 2013) — but if secular evolution along a bar is
an efficient process, the presence of a bar could also speed up the
quenching time such that the transition happens more rapidly than
the several Gyrs expected from the simple Schmidt law. Masters
et al. (2012) show that high bar fractions in spirals are associated
with lower HI gas content, and there are hints that at a fixed HI
content barred galaxies are optically redder than unbarred galaxies.
Several works (Sheth et al. 2008; Cameron et al. 2010; Melvin et
al. in prep) show that the fraction of disk galaxies with bars also
seems to have been increasing since z ∼ 1 Sheth et al. (2008);
Cameron et al. (2010). Thus, secular processes like bar formation
may be intimately tied to quenching in late-type galaxies; even if
they appear after the initial quenching event, they would help drive
out the remaining gas reservoir, thus accelerating the rate at which
late types become fully gas- and star-formation free.
Environment as a late-stage accelerator or modifier of quenching is naturally supported by the strong effect of halo mass on
the presence of green and red late types (Section 3.5). Other recent observational studies have argued that environment or satellite
quenching should act fast, at least once it begins (e.g., Muzzin et al.
2012; Wetzel et al. 2013).
Other environmental effects can accelerate the quenching process by further removing gas but not too quickly, as we do not
see late-type galaxies with short quenching timescales. We note
that these modulating effects (secular processes and environment)
mean that most likely we cannot accurately reconstruct the time of
quenching for present-day green and red (i.e., off-main sequence)
late types.
Now we consider the possible role of AGN feedback in the
evolution of late-type galaxies.The majority of black holes growing locally and at high redshift are hosted in late-type galaxies,
clearly driven by secular processes rather than major mergers (e.g.,
c 2013 RAS, MNRAS 000, 1–20
15. Galaxy Zoo: The Green Valley is a Red Herring
Schawinski et al. 2010b, 2011, 2012; Cisternas et al. 2011; Kocevski et al. 2012; Simmons et al. 2012; Treister et al. 2012). The
fraction of green valley galaxies that host AGN is higher than in
blue star-forming galaxies (Fig. 11). This could be due in part to
an observational bias (the difficulty of seeing AGN signatures in
SDSS spectra against a more luminous stellar component), but sensitive multiwavelength searches for “missed” AGN in nearby starforming galaxies (e.g., Goulding et al. 2010) do not find enough
to balance the numbers. Moreover, hard X-ray selection should not
be confused by star formation, yet this technique also detects few
to no (high luminosity) AGN in the blue cloud (Schawinski et al.
2009c). We conclude the prevalence of AGN in green valley galaxies is likely real rather than a selection effect.
The alternative is that the onset of quenching in late-type
galaxies leads to increased black hole growth about 1 Gyr later.
The delay could be explained naturally by the time required for accreting matter to lose angular momentum. In this case, black hole
feeding would be due to secular processes (since major mergers
would disrupt the disk morphology) and could not significantly
speed up the quenching (or the AGN hosts would transition much
more rapidly across N U V ur colour space); it would be a consequence of the host galaxy quenching, not the cause. Perhaps a declining sSFR favors black hole growth: Davies et al. (2007) suggested that the absence of strong stellar feedback (core collapse
supernovae, O-star winds) makes it easier to transport gas to the
center, and also that mass loss from Asymptotic Giant Branch stars
could easily fuel black hole accretion because of both the larger
amount of material and its lower velocity.
Peng et al. (2010) identified two distinct quenching mechanisms at work in galaxies: environment and mass quenching (without identifying the physical mechanisms). From the data presented
in Section 3.5, one might speculate that early-type galaxies are
mass quenched (no strong dependence on environment) and late
types are environment quenched (strong dependence on environment). A test of this hypothesis would be the mass functions of
green valley early- and late-type galaxies: if the quenching pathway we identify in early types is mass quenching (see below), then
the green valley early types should have the same mass function as
the passive galaxies (in terms of M ∗ and faint end slope αs , the
normalisation Φ∗ will depend on transition time scale); similarly,
if the quenching pathway we identify in late types is environment
quenching, then the green valley late types should have the same
mass function as the star-forming galaxies.
4.2
The evolution of early-type galaxies
The end of star formation in early-type galaxies in the local Universe proceeds in a fundamentally different fashion than in the latetype galaxies. In local early types, quenching occurs in low-mass
galaxies and is marked by a very rapid shutdown of star formation on time scales consistent with instantaneous suppression, or at
most τquench ∼ 250 Myr (c.f. Schawinski et al. 2007b). This rapid
suppression is inconsistent with the simple gas exhaustion scenario
outlined for late-type galaxies; the Schmidt law does not allow star
formation to deplete a substantial gas reservoir so rapidly (a point
made strongly by Kaviraj et al. 2011). The quenching mechanism
should also be linked to the destruction of the disk morphology of
the likely progenitor(s).
A major merger (Schawinski et al. 2010a) could simultaneously transform the galaxy morphology from disk to spheroid and
cause rapid depletion of the cold gas reservoir. Deep imaging of
blue early types does reveal tidal features indicative of a major
c 2013 RAS, MNRAS 000, 1–20
15
merger (Schawinski et al. 2010a) but Wong et al. (2012) have
shown that galaxies with post-starburst spectral features already
have early-type morphologies, emphasizing that the morphological
transformation must be rapid.
Studies of gas kinematics (molecular, ionised) show that most
early-type galaxies, and specifically those in the green valley, have
gas with an external origin, most likely due to merger activity (Sarzi
et al. 2006; Shapiro et al. 2010; Davis et al. 2013; Khochfar &
Burkert 2003). These blue precursors must have similar masses
but bluer (intrinsic) colours than the AGN early-type hosts (see
Figure 3 and Schawinski et al. 2007b, 2009a). Observations of a
small sample of early types along this evolutionary path from the
blue cloud to the red sequence shows that the large molecular gas
reservoirs of blue early-type galaxies do disappear rapidly, at a rate
significantly faster than can be explained by star formation alone
(Schawinski et al. 2009b).
We note that, as with the green valley late types, the quenching event — i.e., the point at which the gas fuelling star formation
was destroyed — had to occur before the galaxy reaches the green
valley. Given the short time between quenching and arrival in the
green valley (only a few hundred Megayears), it may be easier to
identify this progenitor population than in late types. So far, Schawinski et al. (2009b) found that green valley (Seyfert AGN) earlytype galaxies were undetected in molecular gas and that the gas
disappeared rapidly during the transition from purely star-forming
to an AGN+star formation mixed phase.
Naturally, today’s galaxies host both stellar populations
formed in situ and those brought in via progenitors in minor and
major mergers. In this general picture, star formation in early-type
galaxies ceases and then does not re-start except for a minor frosting of new stellar populations (seen mostly in the ultraviolet; e.g.,
Yi et al. 2005; Schawinski et al. 2007a; Kaviraj et al. 2007), except
when a new disk forms through the acquisition of a sufficient supply of cold gas, at which point the galaxy would rejoin the main
sequence.
What about the role of AGN feedback? Rapid depletion of a
large fraction of the available gas could be caused by a vigorous
starburst, as star formation uses up cold gas and stellar processes
create strong winds. Simulations show that merger-induced starbursts can lead to enhanced star formation as disk destruction leads
to the inflow of gas to the (new) galaxy centre, all on relatively short
dynamical time scales (e.g., Barnes & Hernquist 1996). However,
in this starburst-induced scenario, even a short depletion time scale
will still yield a remnant system that is not entirely quenched. The
Schmidt Law forces the star formation back to an exponentially decaying state, albeit with a shorter time scale, which in turn means
that the galaxy retains gas, and therefore continues forming stars.
Only by adding AGN feedback, which can destroy the gas reservoir, do simulations show a genuine total quenching of star formation (e.g., Springel et al. 2005).
Is it possible that AGN feedback alone destroys the gas reservoir during merger? It is true that photoionization happens almost
instantaneously, so a luminous AGN could destroy the cold gas
reservoir almost instantaneously. However, we would then expect
detectable AGN radiation before the host galaxies reach the green
valley, while they are still in the blue, star-forming phase, contrary
to what is observed (Schawinski et al. 2009c; Goulding et al. 2010).
If AGN feedback were responsible for the rapid gas reservoir destruction, then during this phase it must be either very short-lived,
heavily obscured or radiatively inefficient (Schawinski et al. 2009b;
Schawinski 2012).
A radiatively inefficient accretion flow could drive a kinetic
16. 16
Kevin Schawinski et al.
outflow (jet, disk wind, or other outflow), analogous to what Xray binaries do (e.g., Maccarone et al. 2003; Körding et al. 2006;
McHardy et al. 2006; Pakull et al. 2010). In this early phase, the
AGN would be outshone by the declining starburst; the place to
look for evidence of this kind of kinetic feedback would be at
the transition from star forming to composite spectrum in the blue
early-type galaxy population.
We note that dwarf ellipticals are not in our sample and their
quenching pathways may be very different (e.g. Boselli et al. 2008)
(viii) The time delay between the quenching event (i.e., the point
at which the external gas supply to the galaxy reservoir is cut off)
and the time that the quenching becomes apparent (by movement
out of the blue cloud and into the green valley) is long, on the order
of several gigayears. This means that studying the local green valley galaxies will not allow us to understand this quenching mode or
directly observe it in action. It also means that the green and red late
types we see today may be the amongst the first to have quenched.
The Milky Way may be on a similar trajectory to quiescence.
Early-type galaxies:
5
SUMMARY
We have used new morphological analyses from Galaxy Zoo to
map out the evolutionary pathways of local galaxies. We showed
that the paths taken by late-type and early-type galaxies through
the (optical) green valley are quite different, and that their quenching mechanisms have very different time scales. This means that
thinking of the green valley as a transition phase for all (or even
most) galaxies is overly simple. In particular, late-type galaxies do
not exhibit the colour bimodality seen in the colour-mass or colourmagnitude diagrams of the total galaxy population.
From a detailed analysis of specific star formation rates,
dust-corrected UV-optical colours and other properties, we traced
the evolution of early- and late-type galaxies through the green
valley. Both leave the main sequence and enter the green valley
as their sSFR drops, but they do so with very different rates of
change. UV-optical colours show that the rate of change in sSFR
(d/dt sSFR) — i.e., the quenching time scale — is rapid in earlytype galaxies (τ < 250 Myr), while late-type galaxies undergo
a much more gradual decline in star formation (τ > 1 Gyr).
We illustrate these morphology-related star formation quenching pathways with cartoons in Figures 13 and 14, as described here:
Late-type galaxies:
(i) The quenching of star formation is initiated by a cutoff of the
galaxy gas reservoir from the cosmic supply of fresh gas. This cutoff could be due, for example, to the halo mass reaching 1012 M ,
preventing further accretion of gas onto the galaxy, or to cooling of
the hot halo gas becoming inefficient.
(ii) This disturbance of the balance of inflows and outflows
moves the galaxy off the main sequence, as star formation uses up
the remaining gas and the gas reservoir is not replenished. Where
initially the galaxy SFR scales nearly linearly with the stellar mass
(the main sequence), it then declines exponentially after quenching
commences, with a long characteristic time scale that to first order is set by the gas reservoir at the time quenching begins and the
dynamical time scale of the galaxy disk.
(iii) Since the SFR is declining, but not zero, the stellar mass
may continue to increase as star formation converts the remaining
gas reservoir to stars.
(iv) The galaxy moves slowly out of the blue cloud and into the
green valley. Objects that were quenched this way at high redshift
may by now have reached the red sequence, accounting for the red
spiral population.
(v) The gas-depletion process can be accelerated by other physical processes, in particular secular processes and environmental
processes.
(vi) Black hole accretion appears to be favoured in late types
that have been quenched and are in the exponential decline phase.
(vii) Observations of still-significant gas reservoirs and high
dark matter halo masses support this evolutionary scenario.
(i) The quenching of star formation is triggered by the rapid destruction of the galaxy gas reservoir. This must occur rapidly and
can not be due to gas exhaustion by star formation alone.
(ii) The destruction of the gas reservoir triggers the immediate
departure from the main sequence of the galaxy. The SFR rapidly
approaches zero, which means the galaxy no longer increases its
stellar mass.
(iii) The drop in SFR corresponds to the galaxy moving out of
the blue cloud, into the green valley and to the red sequence as fast
as stellar evolution allows. The transition process in terms of galaxy
colour takes about 1 Gyr.
(iv) The rapid quenching event is effectively simultaneous with
the morphological transformation, since there are very few blue
early-type galaxies. This suggests a common origin in a major
merger.
(v) Visible radiation from black hole accretion is associated with
the green valley, i.e., only after the quenching event.
(vi) The rapidity of the gas reservoir destruction suggests that
unusually strong stellar process and/or AGN feedback (winds, ionization) are involved, perhaps in a kinetic or highly obscured phase.
(vii) To understand the physics of quenching in early types more
fully requires observations of the progenitors of the blue early types
— most likely major, gas-rich mergers — where we can see which
processes (AGN or not) destroy the gas reservoir.
ACKNOWLEDGEMENTS
We thank C. M. Carollo, S. Lilly, E. Bell and Y. Peng for useful
discussions and A. Muench for help with the VO. We also thank
the anonymous referee for helpful comments.
KS gratefully acknowledges support from Swiss National
Science Foundation Grant PP00P2_138979/1. BDS acknowledges
support from the Oxford Martin School and Worcester College, Oxford. The development of Galaxy Zoo was supported by a Jim Gray
grant from Microsoft and The Leverhulme Trust. RCN acknowledges STFC Rolling Grant ST/I001204/1 “Survey Cosmology and
Astrophysics”. SKY acknowledges the support from the National
Research Foundation of Korea to the Center for Galaxy Evolution
Research (No. 2010-0027910) and Korea Research Council of Fundamental Science and Technology (DRC Program, FY 2012). Support for the work of ET was provided by the Center of Excellence
in Astrophysics and Associated Technologies (PFB 06), by the
FONDECYT grant 1120061 and the Anillo project ACT1101. LFF
and KWW acknowledge support the US National Science Foundation under grant DRL-0941610. RAS is supported by the NSF
grant AST-1055081. SK acknowledges a Senior Research Fellowship from Worcester College, Oxford. All hail the Glow Cloud.
GALEX (Galaxy Evolution Explorer) is a NASA Small Explorer, launched in 2003 April. We gratefully acknowledge NASA’s
support for construction, operation, and science analysis for the
c 2013 RAS, MNRAS 000, 1–20
17. Galaxy Zoo: The Green Valley is a Red Herring
17
Late-type galaxy star formation quenching schematic
(1) prior to t=0
(2) t=0, quenching event
gas
cooling
galaxy
cold gas
reservoir
outflows
(SF,
AGN)
log SFR
halo
hot gas
halo
hot gas
either
gas
cooling
blocked
log stellar mass
Galaxy is on main sequence
Mstellar ~ SFRβ
galaxy
cold gas
reservoir
outflows
(SF,
AGN)
Inflows balance outflows:
system in quasi-equilibrium
(Bouche+10; Lilly+13)
log SFR
cosmological
gas inflow
blocked
cosmological
gas inflow
log stellar mass
Either cosmological inflows or
cooling from halo are stopped,
galaxy gas reservoir is now no
longer replenished
Galaxy leaves main sequence
SFR = εMgas/τdyn
(3) t~100-1000 Myr past quenching
(4) t~ several Gyr past quenching
halo
hot gas
either
gas
cooling
blocked
galaxy
cold gas
reservoir
outflows
(SF,
AGN)
halo
hot gas
either
log stellar mass
gas
cooling
blocked
log SFR
cosmological
gas inflow
blocked
log SFR
cosmological
gas inflow
blocked
log stellar mass
Several Gyr later...
SFR goes into exponential
decline, galaxy enters green
valley
Passive, red spiral galaxy
No morphological transformation > “red spiral”
Gas reservoir is slowly used
up
Very low SSFR
Figure 13. Diagram outlining the scenario presented here for star-formation quenching in late-type galaxies. Once the external supply of gas to the galaxy’s
reservoir is cut off, the galaxy will leave the main sequence, and the SFR will decay exponentially, with a long quenching time scale τquench . While no longer
on the main sequence, the galaxy nevertheless continues to convert gas to stars and thus to increase its stellar mass. Absent a major merger, this evolutionary
pathway eventually produces a passive, red, late-type galaxy. We see radiation from black hole growth during stage (3), long after the quenching event actually
took place.
GALEX mission, developed in cooperation with the Centre National d’Etudes Spatiales of France and the Korean Ministry of Science and Technology.
This publication makes use of data products from the Two
Micron All Sky Survey, which is a joint project of the University of Massachusetts and the Infrared Processing and Analysis
Center/California Institute of Technology, funded by the National
Aeronautics and Space Administration and the National Science
Foundation.
Funding for the SDSS and SDSS-II has been provided by
the Alfred P. Sloan Foundation, the Participating Institutions, the
National Science Foundation, the U.S. Department of Energy,
the National Aeronautics and Space Administration, the Japanese
Monbukagakusho, the Max Planck Society, and the Higher Education Funding Council for England. The SDSS Web Site is
http://www.sdss.org/.
The SDSS is managed by the Astrophysical Research Consortium for the Participating Institutions. The Participating Institutions are the American Museum of Natural History, Astrophysical
Institute Potsdam, University of Basel, University of Cambridge,
c 2013 RAS, MNRAS 000, 1–20
Case Western Reserve University, University of Chicago, Drexel
University, Fermilab, the Institute for Advanced Study, the Japan
Participation Group, Johns Hopkins University, the Joint Institute
for Nuclear Astrophysics, the Kavli Institute for Particle Astrophysics and Cosmology, the Korean Scientist Group, the Chinese
Academy of Sciences (LAMOST), Los Alamos National Laboratory, the Max-Planck-Institute for Astronomy (MPIA), the MaxPlanck-Institute for Astrophysics (MPA), New Mexico State University, Ohio State University, University of Pittsburgh, University
of Portsmouth, Princeton University, the United States Naval Observatory, and the University of Washington.
This publication made extensive use of the Tool for OPerations on Catalogues And Tables (TOPCAT), which can be found
at http://www.starlink.ac.uk/topcat/. This research
has made use of NASA’s ADS Service.
REFERENCES
Abazajian K. N. et al., 2009, ApJS, 182, 543
18. 18
Kevin Schawinski et al.
Early-type galaxy star formation quenching schematic
(1) ~100s Myr prior to quenching (t=0)
(2) quenching time (t=0)
log SFR
log SFR
inflows/cooling
blocked
log stellar mass
halo
hot gas
Two galaxies on main sequence
are about to merge
Both bring in gas reservoir and are
connected to cosmic gas inflow
log stellar mass
Merger may drive SFR above main
sequence, or not.
halo
hot gas
Morphology is transformed to
spheroid
Some process drives outflows of
gas to rapidly deplete the cold gas
reservoir, perhaps AGN feedback?
(4) t~1-2 Gyr post quenching
(3) t~100s Myr post quenching
log SFR
inflows/cooling
blocked
log SFR
inflows/cooling
blocked
log stellar mass
log stellar mass
SFR drops rapidly to zero,
galaxy moves to green valley
halo
hot gas
Further cosmological inflows and/or
cooling stopped?
Gas reservoir is destroyed,
further inflows not allowed to
replenish
halo
hot gas
With no gas reservoir and no
further gas inflows, new earlytype becomes passive red
sequence galaxy.
AGN active
Figure 14. Diagram outlining the scenario presented here for star-formation quenching in early-type galaxies. A dramatic event, likely a gas-rich merger of
main sequence star-forming galaxies, causes the near-instantaneous destruction of the (newly formed) early-type galaxy gas reservoir, via stellar processes
and/or AGN feedback. As long as the gas reservoir is not resupplied or the AGN keeps the gas hot, star formation ceases and no further stellar mass is formed.
An AGN phase is visible for 100s of Myr as the stars in the early-type host galaxy age rapidly through the green valley.
Athanassoula E., Machado R. E. G., Rodionov S. A., 2013, MNRAS, 429, 1949
Baldry I. K., Balogh M. L., Bower R. G., Glazebrook K., Nichol
R. C., Bamford S. P., Budavari T., 2006, MNRAS, 373, 469
Baldry I. K., Glazebrook K., Brinkmann J., Ivezi´ Ž., Lupton
c
R. H., Nichol R. C., Szalay A. S., 2004, ApJ, 600, 681
Bamford S. P. et al., 2009, MNRAS, 393, 1324
Barnes J. E., Hernquist L., 1996, ApJ, 471, 115
Behroozi P. S., Conroy C., Wechsler R. H., 2010, ApJ, 717, 379
Bell E. F. et al., 2004, ApJ, 608, 752
Blanton M. R., Roweis S., 2007, AJ, 133, 734
Blanton M. R. et al., 2005, AJ, 129, 2562
Boselli A., Boissier S., Cortese L., Gavazzi G., 2008, ApJ, 674,
742
Bouché N. et al., 2010, ApJ, 718, 1001
Brammer G. B. et al., 2009, ApJ, 706, L173
Brinchmann J., Charlot S., White S. D. M., Tremonti C., Kauffmann G., Heckman T., Brinkmann J., 2004, MNRAS, 351, 1151
Bruzual G., Charlot S., 2003, MNRAS, 344, 1000
Calzetti D., Armus L., Bohlin R. C., Kinney A. L., Koornneef J.,
Storchi-Bergmann T., 2000, ApJ, 533, 682
Cameron E. et al., 2010, MNRAS, 409, 346
Cappellari M., Emsellem E., 2004, PASP, 116, 138
Cardamone C. et al., 2009, MNRAS, 399, 1191
Cardamone C. N., Urry C. M., Schawinski K., Treister E., Brammer G., Gawiser E., 2010, ApJ, 721, L38
Cardelli J. A., Clayton G. C., Mathis J. S., 1989, ApJ, 345, 245
Carollo C. M. et al., 2012, ArXiv e-prints, 1206.5807
Cattaneo A., Dekel A., Devriendt J., Guiderdoni B., Blaizot J.,
2006, MNRAS, 370, 1651
Cheung E. et al., 2013, ApJ, 779, 162
Cibinel A. et al., 2012, ArXiv e-prints, 1206.6496
Cisternas M. et al., 2011, ApJ, 726, 57
Cortese L., 2012, A&A, 543, A132
Darg D. W. et al., 2010a, MNRAS, 401, 1552
Darg D. W. et al., 2010b, MNRAS, 401, 1043
Davies R. I., Müller Sánchez F., Genzel R., Tacconi L. J., Hicks
E. K. S., Friedrich S., Sternberg A., 2007, ApJ, 671, 1388
Davis T. A. et al., 2013, MNRAS, 429, 534
Dekel A., Birnboim Y., 2006, MNRAS, 368, 2
Dekel A. et al., 2009, Nature, 457, 451
Elbaz D. et al., 2007, A&A, 468, 33
c 2013 RAS, MNRAS 000, 1–20
19. Galaxy Zoo: The Green Valley is a Red Herring
Elbaz D. et al., 2011, A&A, 533, A119
Faber S. M. et al., 2007, ApJ, 665, 265
Gonçalves T. S., Martin D. C., Menéndez-Delmestre K., Wyder
T. K., Koekemoer A., 2012, ApJ, 759, 67
Goulding A. D., Alexander D. M., Lehmer B. D., Mullaney J. R.,
2010, MNRAS, 406, 597
Guiderdoni B., Hivon E., Bouchet F. R., Maffei B., 1998, MNRAS, 295, 877
Hasinger G., 2008, A&A, 490, 905
Hatton S., Devriendt J. E. G., Ninin S., Bouchet F. R., Guiderdoni
B., Vibert D., 2003, MNRAS, 343, 75
Haynes M. P. et al., 2011, AJ, 142, 170
Hoyle B. et al., 2011, MNRAS, 415, 3627
Kauffmann G. et al., 2003, MNRAS, 341, 33
Kaviraj S., Darg D., Lintott C., Schawinski K., Silk J., 2012, MNRAS, 419, 70
Kaviraj S. et al., 2007, ApJS, 173, 619
Kaviraj S., Schawinski K., Silk J., Shabala S. S., 2011, MNRAS,
415, 3798
Keel W. C. et al., 2012, MNRAS, 420, 878
Kennicutt, Jr. R. C., 1998, ApJ, 498, 541
Khochfar S., Burkert A., 2003, ApJ, 597, L117
Kocevski D. D. et al., 2012, ApJ, 744, 148
Komatsu E. et al., 2011, ApJS, 192, 18
Körding E. G., Jester S., Fender R., 2006, MNRAS, 372, 1366
Land K. et al., 2008, MNRAS, 388, 1686
Lee K.-S. et al., 2012, ApJ, 752, 66
Leitner S. N., 2012, ApJ, 745, 149
Lilly S. J., Carollo C. M., Pipino A., Renzini A., Peng Y., 2013,
ArXiv e-prints, 1303.5059
Lintott C. et al., 2011, MNRAS, 410, 166
Lintott C. J. et al., 2009, MNRAS, 399, 129
Lintott C. J. et al., 2008, MNRAS, 389, 1179
Maccarone T. J., Gallo E., Fender R., 2003, MNRAS, 345, L19
Martin D. C. et al., 2005, ApJ, 619, L1
Martin D. C. et al., 2007, ApJS, 173, 342
Masters K. L. et al., 2010a, MNRAS, 405, 783
Masters K. L. et al., 2010b, MNRAS, 404, 792
Masters K. L. et al., 2012, MNRAS, 424, 2180
Masters K. L. et al., 2011, MNRAS, 411, 2026
McHardy I. M., Koerding E., Knigge C., Uttley P., Fender R. P.,
2006, Nature, 444, 730
Melvin T. et al., 2014, MNRAS
Mendez A. J., Coil A. L., Lotz J., Salim S., Moustakas J., Simard
L., 2011, ApJ, 736, 110
Muzzin A. et al., 2013, ArXiv e-prints, 1303.4409
Muzzin A. et al., 2012, ApJ, 746, 188
Nandra K. et al., 2007, ApJ, 660, L11
Noeske K. G. et al., 2007, ApJ, 660, L43
Oh K., Sarzi M., Schawinski K., Yi S. K., 2011, ApJS, 195, 13
Padmanabhan N. et al., 2008, ApJ, 674, 1217
Pakull M. W., Soria R., Motch C., 2010, Nature, 466, 209
Peng Y.-j. et al., 2010, ApJ, 721, 193
Salim S. et al., 2007, ApJS, 173, 267
Sarzi M. et al., 2006, MNRAS, 366, 1151
Schawinski K., 2009, in American Institute of Physics Conference
Series, Vol. 1201, American Institute of Physics Conference Series, Heinz S., Wilcots E., eds., pp. 17–20
Schawinski K., 2012, ArXiv e-prints, 1206.2661
Schawinski K., Dowlin N., Thomas D., Urry C. M., Edmondson
E., 2010a, ApJ, 714, L108
Schawinski K. et al., 2007a, ApJS, 173, 512
c 2013 RAS, MNRAS 000, 1–20
19
Schawinski K. et al., 2009a, MNRAS, 396, 818
Schawinski K. et al., 2009b, ApJ, 690, 1672
Schawinski K., Simmons B. D., Urry C. M., Treister E., Glikman
E., 2012, MNRAS, 425, L61
Schawinski K., Thomas D., Sarzi M., Maraston C., Kaviraj S., Joo
S.-J., Yi S. K., Silk J., 2007b, MNRAS, 382, 1415
Schawinski K., Treister E., Urry C. M., Cardamone C. N., Simmons B., Yi S. K., 2011, ApJ, 727, L31
Schawinski K. et al., 2010b, ApJ, 711, 284
Schawinski K., Virani S., Simmons B., Urry C. M., Treister E.,
Kaviraj S., Kushkuley B., 2009c, ApJ, 692, L19
Schiminovich D. et al., 2007, ApJS, 173, 315
Schmidt M., 1959, ApJ, 129, 243
Shapiro K. L. et al., 2010, MNRAS, 402, 2140
Sheth K. et al., 2008, ApJ, 675, 1141
Silverman J. D. et al., 2008, ApJ, 675, 1025
Simmons B. D., Urry C. M., Schawinski K., Cardamone C., Glikman E., 2012, ApJ, 761, 75
Skibba R. A. et al., 2009, MNRAS, 399, 966
Skibba R. A. et al., 2012, MNRAS, 423, 1485
Skrutskie M. F. et al., 2006, AJ, 131, 1163
Sodré, Jr. L., Ribeiro da Silva A., Santos W. A., 2013, ArXiv eprints, 1306.6552
Springel V., Di Matteo T., Hernquist L., 2005, ApJ, 620, L79
Strateva I. et al., 2001, AJ, 122, 1861
Taylor M., 2011, Astrophysics Source Code Library, 1010
Taylor M. B., 2005, in Astronomical Society of the Pacific Conference Series, Vol. 347, Astronomical Data Analysis Software
and Systems XIV, Shopbell P., Britton M., Ebert R., eds., p. 29
Teng S. H. et al., 2012, ApJ, 753, 165
Tinsley B. M., 1968, ApJ, 151, 547
Tinsley B. M., Gunn J. E., 1976, ApJ, 203, 52
Tinsley B. M., Larson R. B., 1978, ApJ, 221, 554
Tonnesen S., 2011, in New Horizons in Astronomy, Proceedings
of the Frank N. Bash Symposium 2011, held October 9-11,
2011. Austin, Texas, USA. Edited by S. Salviander, J. Green, and
A. Pawlik. Published online at <A href=”http://pos.sissa.it/cgibin/reader/conf.cgi?confid=149”>http://pos.sissa.it/cgibin/reader/conf.cgi?confid=149</A>., id.8
Treister E., Schawinski K., Urry C. M., Simmons B. D., 2012,
ApJ, 758, L39
van den Bergh S., 1976, ApJ, 206, 883
Vollmer B., 2013, The Influence of Environment on Galaxy Evolution, Oswalt T. D., Keel W. C., eds., p. 207
Wetzel A. R., Tinker J. L., Conroy C., van den Bosch F. C., 2013,
MNRAS, 432, 336
Wild V., Kauffmann G., Heckman T., Charlot S., Lemson G.,
Brinchmann J., Reichard T., Pasquali A., 2007, MNRAS, 381,
543
Williams R. J., Quadri R. F., Franx M., van Dokkum P., Labbé I.,
2009, ApJ, 691, 1879
Wolf C. et al., 2009, MNRAS, 393, 1302
Wong O. I. et al., 2012, MNRAS, 420, 1684
Wyder T. K. et al., 2007, ApJS, 173, 293
Yang X., Mo H. J., van den Bosch F. C., Pasquali A., Li C., Barden
M., 2007, ApJ, 671, 153
Yi S. K. et al., 2005, ApJ, 619, L111
York D. G. et al., 2000, AJ, 120, 1579
A
This paper has been typeset from a TEX/ LTEX file prepared by the
author.
20. 20
Kevin Schawinski et al.
APPENDIX A: DOES THE EARLY STAR FORMATION
HISTORY OF MAIN SEQUENCE GALAXIES HAVE AN
APPRECIABLE EFFECT ON POST-QUENCHING
EVOLUTION?
(i) Model 1 (black line): fiducial model of constant SFR, followed by exponential decay, in this case with τquench = 100 Myr.
(ii) Model 2 (green dashed line): same as Model 1, but with
Gaussian random perturbations in the amplitude prior to quenching with a dispersion of a factor 2.
(iii) Model 3 (light blue line): rather than a constant SFR, the
pre-quenching star formation history is a gently exponentially declining SFR (τ = 5.0 Gyr), which builds up a more significant old
stellar population by the time of quenching. The model is tuned to
have an SSFR at the quenching time tquench = 9 Gyr that is at the
lower edge of the Main Sequence.
(iv) Model 4 (red line): same as Model 3, but with a more
strongly exponentially declining SFR prior to quenching (τ = 2.5
Gyr. This Model has an SSFR 1 dex below the Main Sequence at
tquench , and thus is (just a bit) outside the suite of galaxies whose
quenching is discussed in this paper.
All Galaxies
Green Valley Early-types
4
NUV-u colour
We use the N U V ur diagram (Figure 7) to constrain the quenching
time scales of galaxies using a simple model star formation history: constant SFR for 9 Gyr, followed by an exponential decline
of varying time scale τ . The model assumes that all star-forming
galaxies are on the main sequence prior to the quenching event, as
is appropriate to our goal of describing the bulk of normal galaxies.
But do all galaxies on the main sequence have comparable colours;
that is, are the starting points of all star forming galaxies comparable? In order to test this, we plot the colour evolution of u − r and
N U V − u in Figure A1. We explore a range of models:
5
Green Valley Late-types
3
2
1
0
0.5
1.0
1.5
2.0
u-r colour
2.5
Figure A2. The N U V ur colour diagram, similar to Figure 7, with the
same Model tracks shown as on Figure A1. All models that are on the main
sequence at the time of quenching (black, green, light blue) yield a short
quenching. The red model, which is incompatible with the Main Sequence
due to having a low SSFR at the quenching time, is somewhat offset, but still
yields a short quenching time scale on the N U V ur diagram. Together with
Figure A1, this Figure illustrates the robustness of the N U V ur diagram as
a quenching time and that all reasonable star formation histories that end
up on the main sequence are blue, and reasonable starting points for our
quenching model.
These model tracks demonstrate that a wide range of initial
star-formation histories create galaxies with similar main sequence
u − r and N U V − u colours at the point of quenching. This is
because N U V − u and u − r colours are dominated by current
and recent recent stellar populations. Thus, star formation histories
that place a galaxy on the main sequence will also result in similarly blue colours. Once quenching sets in, the movement towards
the red is similarly governed by young stellar populations and and
thus the time scales are similar regardless of the pre-quenching star
formation history.
We combine these diagrams and place the same four model
tracks on a version of Figure 7 in Figure A2. We show how those
four model tracks evolve: Models 1, 2 and 3 are virtually on top of
each other and indicate a short quenching time scale, as expected
from the assumed τquench = 100 Myr. Model 4 (red) – which is
ruled out due to its low SSFR – is offset and would indicate somewhat longer time scales, but is still not comparable to the "slow"
quenching tracks which best fit late-type galaxies. We conclude that
the time scales deduced from the N U V ur diagram are robust with
respect to initial star formation histories because the main sequence
dictates similar colours at the point of quenching.
c 2013 RAS, MNRAS 000, 1–20
21. Galaxy Zoo: The Green Valley is a Red Herring
21
4
fiducial quenching model
fiducial model +0.3 dex variation
exp. decay pre-quenching
extreme exp. decay
NUV-u colour
u-r colour
3
2
1
SSFR (yr-1)
SSFR (yr-1)
0
-9
-10
-11
-12
fiducial quenching model
fiducial model +0.3 dex variation
exp. decay pre-quenching
extreme exp. decay
3
2
1
0
-9
-10
-11
-12
0
2
4
6
8
Time (Gyr)
10
12
14
0
2
4
6
8
Time (Gyr)
10
12
14
Figure A1. Evolution of u − r colour (left) and N U V − r colour (right) as a function of time for a set of four models. Below the colour evolution of each
model, we show the specific star formation rate as a function of time. Model 1 (black line): fiducial model of constant SFR, followed by exponential decay,
in this case with τquench = 100 Myr. Model 2 (green dashed line): same as Model 1, but with random perturbations prior to quenching. Model 3 (light blue
line): rather than a constant SFR, the pre-quenching star formation history is a gently exponentially declining SFR. This SFR builds up a more significant old
stellar population by the time of quenching. The model is tuned to have an SSFR at the quenching time tquench = 9 Gyr that is at the lower edge of the
Main Sequence. Model 4 (red line): same as Model 3, but with a more strongly exponentially declining SFR prior to quenching. This Model has an SSFR ∼1
dex below the Main Sequence at tquench . Due to its low SSFR at tquench , Model 4 is incompatible with the Main Sequence. The other models, do not show
significant offsets from the fiducial quenching model as they all have the following salient features: at tquench , they have blue cloud u − r and N U V − u
colours, and after the quenching event, they become redder at essentially the same rate. Thus, all SFHs which place a galaxy on the main sequence at the point
of quenching yield similar quenching timescale.
c 2013 RAS, MNRAS 000, 1–20