Download to read offline
![International Research Journal of Engineering and Technology (IRJET) e-ISSN: 2395-0056
Volume: 09 Issue: 08 | Aug 2022 www.irjet.net p-ISSN: 2395-0072
© 2022, IRJET | Impact Factor value: 7.529 | ISO 9001:2008 Certified Journal | Page 1529
A Smart air pollution detector using SVM Classification
M.Meghana1, Dr.R.Maruthamuthu2
1student, Department of Computer Applications, Madanapalle Institute of Technology and science, India
2Asst.Professor, Department of Computer Applications, Madanapalle Institute of Technology and science, India
---------------------------------------------------------------------***---------------------------------------------------------------------
Abstract - One of the top priorities for the governments of
developing nations, especially India, is the control of thefast
rising levels of air pollution. People can takeactiontoreduce
pollution by becoming more aware of thedegreeofpollution
in their immediate surroundings. Fossil fuel combustion,
travel habits, and industrial elements like power plant
emissions all have a big impact on air pollution. The total
amount of particulate matter (PM) that affects air quality.
When it is concentrated heavily in the aerial medium, it
poses serious health risks to people. It must therefore be
controlled by regularly checking its atmospheric
concentration.
Key Words: Particulate matter, SVM classifier, Regression,
and Quality
1.INTRODUCTION
There can be both naturally occurringandartificial particles.
Examples include dust, ash, and sea spray. Burning of solid
and liquid fuels, such as when creating energy, heating a
home, or driving a car, releases particulatematter(including
soot). The size of the particles varies (i.e. the diameter or
width of the particle). The term "PM2.5" refers to the
quantity of airborne particles per cubic meter of air that
have an average diameter of less than 2.5 micrometers
Another name for it is fine particulate matter, or PM2.5.
When airborne levels of tiny particulate matter (PM2.5) are
quite high, it poses a substantial risk topeople'shealthandis
a significant portion of the pollutant index. PM2.5, or
particulate matter 2.5, lowers visibility and causes the air to
appear hazy when concentrations are high. The
identification of air pollution and forecastingofPM2.5levels
have been accomplished using a variety of machine learning
models based on a data set made up of daily atmospheric
conditions. Dan Wei forecasted Beijing'sairqualityusingthe
Naive Bayes classification and support vector machine
algorithms to get the lowest possible error. José Juan
Carbajal developed the fuzzy inference technique, which he
then applied to categorize parameters using logic and
include them in an air quality score.
1.1 Naïve Bayes Classification
A group of classification methods built on the Bayes
Theorem is known as naive Bayes classification. Every pair
of features being categorised independently from one
another is not a common principle shared by all of the
algorithms. It is a supervised learning algorithm that uses
the Bayes theorem to solve classification issues. It is mostly
employed in text classification tasks with high-dimensional
training data.
LITERATURE SURVEY
[1] A Machine Learning Approach for Air Quality
Prediction: Model Regularization and Optimization.
Dixian Zhu, Changjie Cai, Tianbao Yang, and Xun Zhou
In this study, we address the problem of air quality
forecasting by predicting the hourly concentration of air
pollutants, such as ozone, particle matter (PM 2.5), and
sulfur dioxide. One of the most used techniques, machine
learning, can effectively train a model onmassiveamounts of
data by employing powerful optimization algorithms.
Although some studies have used machine learning to
predict air quality, most of the earlier research hasonlyused
data from a few years and has only trained basic regression
models (either linear or nonlinear) to predict the hourly air
pollution concentrationBy defining the prediction across 24
hours as a multi-task learning (MTL) issue, we offer
improved models in this study to forecast the hourly air
pollution concentration based on meteorological data from
previous days. This makes it possible for us to choose a
suitable model using various regularization methods. We
suggest a practical regularization by mandating that the
prediction models forconsecutivehours be nearoneanother
and contrast it with other common regularizations for MTL,
such as ordinary Frobenius norm regularization, nuclear
norm regularization, and l 2, 1 -norm regularization. Our
tests demonstrated that the suggested parameter-reducing
formulations and consecutive-hour-related regularizations
outperform existingstandardregressionmodelsandexisting
regularizations in terms of performance
[2]. Sachit Mahajan, Ling-Jyh Chen, and Tzu-Chieh Tsai
are the authors of "An Empirical Study of PM2.5
Forecasting Using Neural Network”.
In most industrialized and developing nations, significant
efforts have been undertaken in recent years to restrict air
pollution levels. Many efforts are being undertaken to
control the levels of fine particulatematter(PM2.5),which is
thought to be one of the main causes of declining public
health. Forecasting PM2.5 levels accurately is a difficult
undertaking that has relied heavily on model-based
approaches. In this study, weinvestigatefreshapproachesto
PM2.5 hourly forecasting. In order to increase prediction](https://image.slidesharecdn.com/irjet-v9i8249-221028121735-b68e7a37/75/A-Smart-air-pollution-detector-using-SVM-Classification-1-2048.jpg)
![International Research Journal of Engineering and Technology (IRJET) e-ISSN: 2395-0056
Volume: 09 Issue: 08 | Aug 2022 www.irjet.net p-ISSN: 2395-0072
© 2022, IRJET | Impact Factor value: 7.529 | ISO 9001:2008 Certified Journal | Page 1530
accuracy, selecting the appropriate forecasting model
becomes crucial. For the prediction job, we employed the
Neural Network Autoregression (NNAR) approach.
Additionally, the research compares the predictive abilities
of the additive Holt-Winters approach, the autoregressive
integrated moving average (ARIMA) model, and the NNAR
model. Utilizing actual measurement data from the Airbox
Project for experimentation and evaluation, it can be seen
that our suggestedmethod makespredictionsaccuratelyand
with a relatively little amount of error.
[3]. Dan Wei: Predicting the degree of air pollution in a
certain city
One of the most crucial jobs for the governments of
developing countries, especiallyChina,isthemanagementof
air pollutant levels. Fine particulate matter (PM2.5) is an
important component of the pollution index since its
excessive levels in the air pose a serious threat to people's
health. When levels are high, PM2.5, or particulate matter
2.5, reduces visibility and gives the air a hazy appearance.
However, it is unclear how the concentration of these
particles and traffic andweatherconditionsinteract.Someof
these cutting-edge methods have been applied to air quality
research to further clarify these links. These studies used a
few methodologies, primarily meteorological and
occasionally traffic data, to estimate ambient air pollution
levels using Support Vector Machine (SVM) and neural
networks. In this experiment, machine learning techniques
were applied to a dataset of daily meteorological and traffic
factors in Beijing, China, in an effort to predict PM2.5 levels.
Due to the uncertainties around the precise number PM2.5
level, I simplified the issue by categorizingthe PM2.5level as
either "High" (> 115 ug/m3) or "Low" (= 115 ug/m3). The
amount was determined using the Chinese Air Quality Level
Standard, which defines mild pollution as 115 ug/m3.
[4]. Machine learning method for predictingsub-micron
air pollution indicators, by Pandey, Gaurav, Bin Zhang,
and Le Jian.
For the governments of emerging nations, especially China,
controlling air pollution levels is quickly becoming one of
their top priorities. The relationship between the
concentrationofsubmicron particlesandmeteorological and
traffic factors is poorly understood, but submicronparticles,
such as ultrafine particles (UFP, aerodynamic diameter 100
nm) and particulate matter 1.0 micrometers (PM1.0), are an
unregulated emerging health threat to people. e used a
variety of machine learning algorithms to forecast UFP and
PM1.0 levels based on observations of meteorological and
traffic factors recorded at a busy roadside in Hangzhou,
China, in order to throw some light on these links. We find
that it is possible to predict PM1.0 and UFP levels relatively
accurately and that tree-based classification models
(Alternating Decision Tree and Random Forests) perform
the best for both of these particles based on a detailed
analysis of the more than 25 classifiers employed for this
purpose. Additionally, weather factors cannot be
disregarded when projecting submicron particle levels
because they have a larger correlation with PM1.0 and UFP
levels. The overall application value of methodically
gathering and analyzing datasets using machine learning
approaches for the prediction of submicron sized ambient
air contaminants has been shown in this study.
[5]. Carbajal-Hernandez, Juan Luis P. and José Sánchez-
Fernándeza JesúsA.Carrasco-Ochoab Fuzzy logic and
autoregressive models for assessing and forecasting air
quality, by JoséFco.Martinez-Trinidad
Artificial intelligence techniques have beenappliedinrecent
years to solve environmental issues. Two models for the
evaluation and forecasting of airqualityarepresentedinthis
paper. In order to identify harmful substances that can hurt
sensitive persons in metropolitansettingsandinterfere with
their usual activities, we first create a novel computational
model for air quality assessment. In this model, we suggest
employing the Sigma operator to statistically evaluate air
quality parameters utilizing theirhistorical data information
and identifying their detrimental effects on air qualitybased
on toxicity limits, frequency averages, and deviations of
toxicological tests. Additionally,wepresenta fuzzyinference
system to classify parametersthrougha processofreasoning
and integrate them into an air quality index that categorizes
pollution levels into five stages: excellent,good, regular,bad,
and danger. The second model put out in this work uses an
autoregressive model to forecast air quality concentrations
and provides a predicted air quality index based on the
previously created fuzzy inference system. We compare the
air quality indices created for environmental agencies and
related models using information from the Mexico City
Atmospheric Monitoring System. Our findings demonstrate
that our models are a useful tool for evaluating sitepollution
and for offering recommendations to enhance contingency
actions in urban environments.
2.EXISTING SYSTEM
The current systems identify the user-selected city's air
quality and categorise it according to AQI into several
categories like good, satisfactory, moderate,poor, extremely
bad, and severe (Air Quality Index). On a monthly,weekly,or
daily basis, the data is shown. Additionally, once the values
are predicted, they remain unchanged in the event that
atmospheric conditions suddenly alter or traffic
unexpectedly increases.
Disadvantages
Have a limited degree of accuracy because they
can't foresee when pollution will be at its lowest
and highest concentrations.
Substantial mathematical answers
They are an insufficient strategy for more accurate
production estimates](https://image.slidesharecdn.com/irjet-v9i8249-221028121735-b68e7a37/75/A-Smart-air-pollution-detector-using-SVM-Classification-2-2048.jpg)
![International Research Journal of Engineering and Technology (IRJET) e-ISSN: 2395-0056
Volume: 09 Issue: 08 | Aug 2022 www.irjet.net p-ISSN: 2395-0072
© 2022, IRJET | Impact Factor value: 7.529 | ISO 9001:2008 Certified Journal | Page 1532
learning models (auto regression and logistic regression)
may be used to predict future air pollution levels and
evaluate air quality with high accuracy. The suggested
technology will make it easier for members of the general
public and meteorological department stafftorecognizeand
predict pollution levels and take the proper action in
response. Additionally, this will helppeopleintheirquestfor
information by developing a data source for small towns,
which are frequently ignored in favor of major metropolis.
REFERENCES
[1] "A machine learning techniqueto forecastingsub-micron
air pollution indicators," by Le Jian, Bin Zhang, and Gaurav
Pandey. Processes and Impacts in Environmental Science
15.5 (2013): 996–1005
[2] Predicting the level of air pollution in a specific city by
Dan Wei [2014]
[3] A Model Regularization and Optimization Approach for
Machine Learning in Air Quality Prediction. Tianbao Yang,
Dixian Zhu, Changjie Cai, and Xun Zhou. Big data and
cognitive computing [2018]. Carbajal-Hernandez, José Juan
[4] Luis P. Sánchez-Fernándeza JessA.Carrasco-Ochoa and
JoséF.Co. Martnez-Trinidad: National Polytechnic Institute,
Center of Computer Research, Av. Juan de Dios Batiz S/N,
Gustavo A. Madero, Col. Nueva, Industrial Vallejo, 07738
Mexico, D.F. Fuzzy logic and autoregressive models for the
assessment and forecasting of air quality (2012)
Doi:https://doi.org/10.1016/j.atmosenv.2012.06.004
[5] Using a neural network, Sachit Mahajan, Ling-Jyh Chen,
and Tzu-Chieh Tsai's paper An Empirical Study of PM2.5
Forecasting appeared in IEEE.](https://image.slidesharecdn.com/irjet-v9i8249-221028121735-b68e7a37/75/A-Smart-air-pollution-detector-using-SVM-Classification-4-2048.jpg)

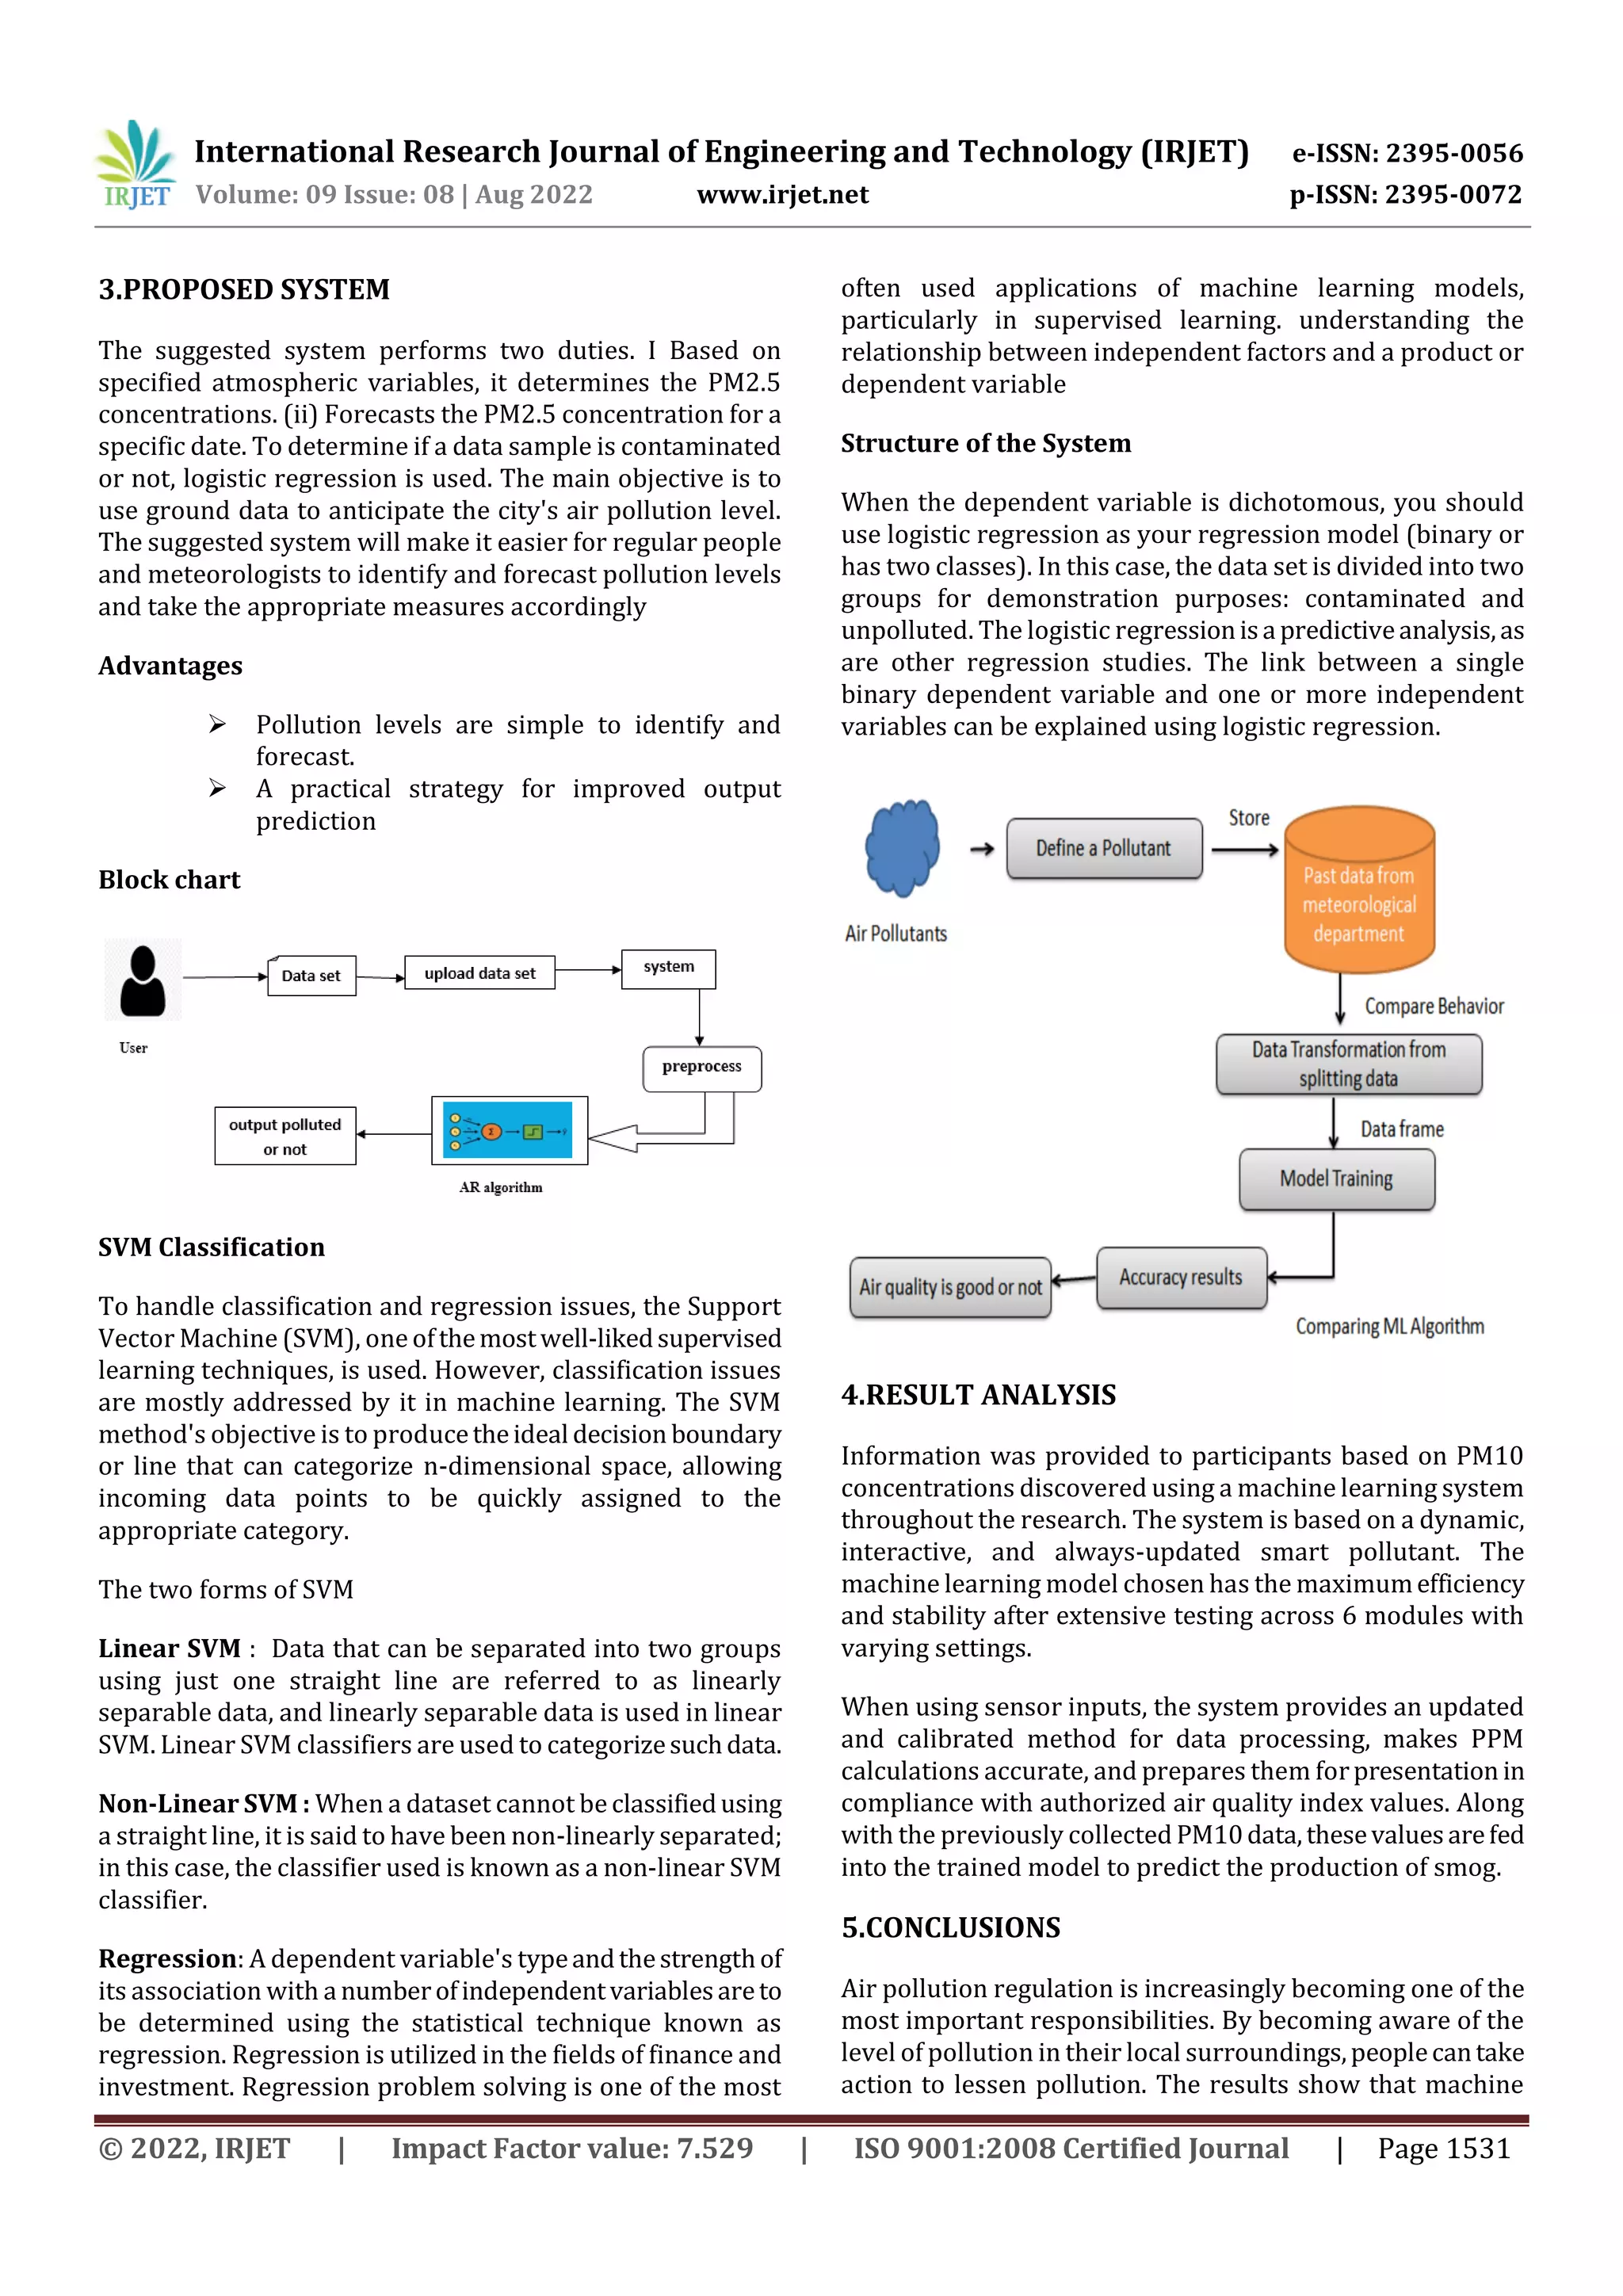
This document summarizes a research paper that proposes a smart air pollution detector using an SVM classification model. It begins with an abstract that describes the need to control rising air pollution levels in developing countries like India. It then discusses particulate matter (PM) and its health risks when concentrated. The paper proposes to regularly check PM concentration levels using machine learning techniques. It reviews related work applying models like naive Bayes, SVM and regression to predict air quality. It then describes the existing systems' limitations and proposes a system that classifies PM2.5 levels using logistic regression and forecasts levels using an SVM model for improved accuracy. The paper analyzes the results and concludes machine learning can accurately predict future pollution levels to help people be aware and take action