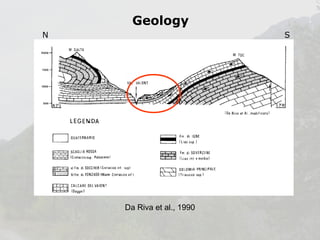
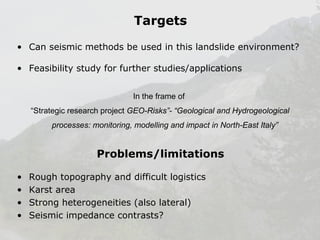
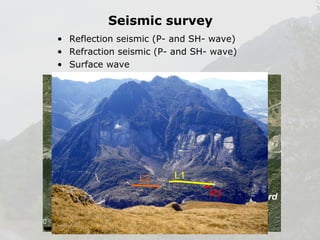
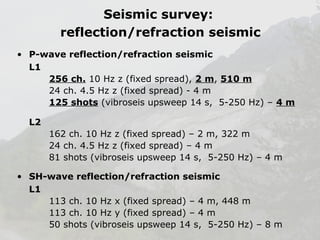
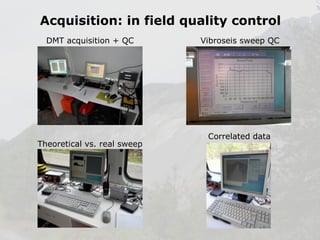
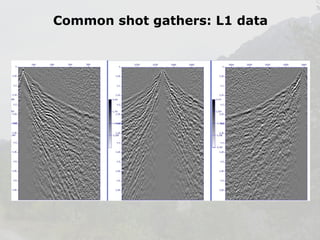
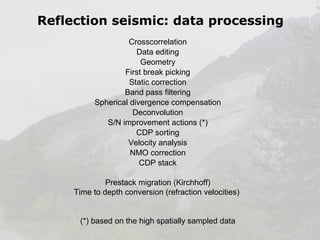
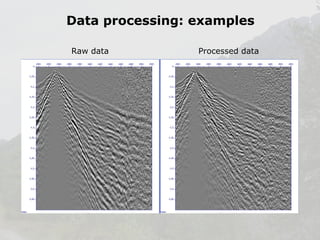
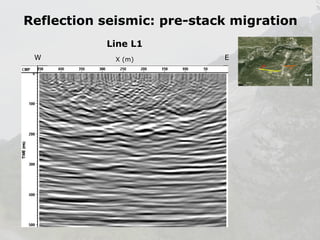
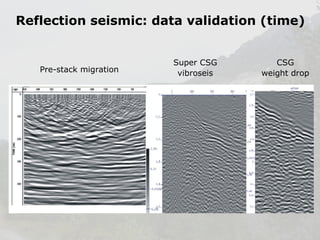
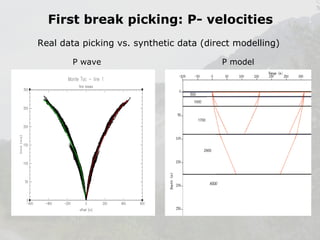
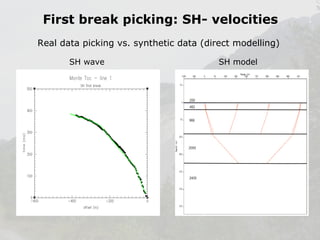
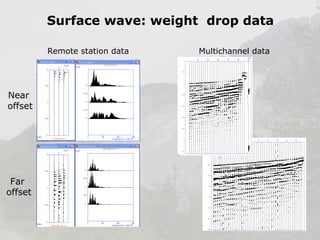
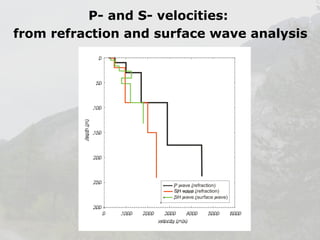
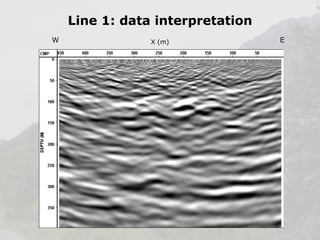
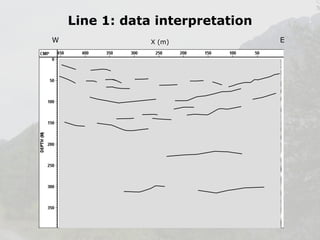
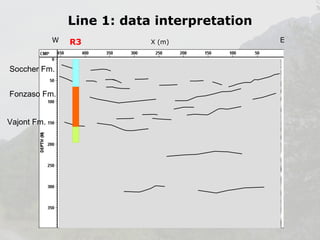
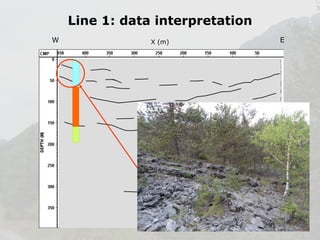
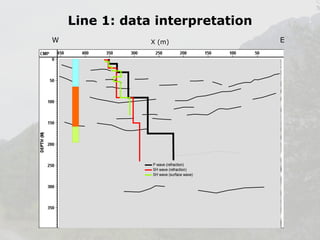
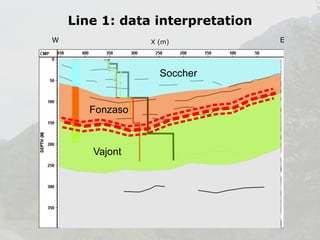
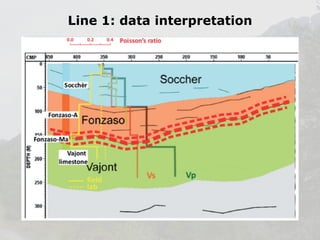
Reflection Seismic and Surface Wave analysis
on complex heterogeneous media:
the case of Mt. Toc landslide in Vajont valley
Lorenzo Petronio 1, Jacopo Boaga
1

2

and Giorgio Cassiani

2

OGS – Istituto Nazionale di Oceanografia e Geofisica Sperimentale, Trieste
2

Dipartimento di Geoscienze - Università di Padova

International Conference Vajont, 1963-2013
Thoughts and analyses after 50 year since the catastrophic landslide
October 8-10, 2013, Padua, Italy
Outline

Vajont dam and monte Toc landslide
• Geology
• Targets
• Experiment:
- Reflection seismic
- Surface wave analysis
• Data integration and results
Vajont dam and monte Toc landslide
• Vajont dam, 264.6 m (1957 – 1959)
• landslide - 9 October 1963
• around 2000 victims

Nord
0

1 Km
Monte Toc landslide
• 260 millions m3 (2000 x 1000 x 130 m)
• slide: 500 m, 110 Km/h
Geology
N

S

Da Riva et al., 1990
Targets
• Can seismic methods be used in this landslide environment?
• Feasibility study for further studies/applications
In the frame of
“Strategic research project GEO-Risks”- “Geological and Hydrogeological
processes: monitoring, modelling and impact in North-East Italy”

Problems/limitations
•
•
•
•

Rough topography and difficult logistics
Karst area
Strong heterogeneities (also lateral)
Seismic impedance contrasts?
Seismic survey:
Walkaway test and experiment preparation

• A priori information collection
• Scouting
• Walkaway test
• Data analysis
• Experiment design
Seismic survey
• Reflection seismic (P- and SH- wave)
• Refraction seismic (P- and SH- wave)
• Surface wave
Seismic survey:
reflection/refraction seismic
• P-wave reflection/refraction seismic
L1
256 ch. 10 Hz z (fixed spread), 2 m, 510 m
24 ch. 4.5 Hz z (fixed spread) - 4 m
125 shots (vibroseis upsweep 14 s, 5-250 Hz) – 4 m
L2
162 ch. 10 Hz z (fixed spread) – 2 m, 322 m
24 ch. 4.5 Hz z (fixed spread) – 4 m
81 shots (vibroseis upsweep 14 s, 5-250 Hz) – 4 m
• SH-wave reflection/refraction seismic
L1
113 ch. 10 Hz x (fixed spread) – 4 m, 448 m
113 ch. 10 Hz y (fixed spread) – 4 m
50 shots (vibroseis upsweep 14 s, 5-250 Hz) – 8 m
Seismic survey: surface wave
• Surface wave
L1
256 ch. 10 Hz z (fixed spread) – 2 m, 510 m
24 ch. 4.5 Hz z (fixed spread) - 4 m
48 ch. 4.5 Hz z (fixed spread) – 10 m
2 remote stations 3ch 1 Hz x, y, z
9 shots (weight drop – about 240 Kg; H=6, 10 and 14 m)
Acquisition: seismic sources
Mini-vibroseis

Weight drop
Acquisition: seismic receivers
10 Hz geophones (Z and 3C)

10 Hz and 4.5 Hz geophones (Z)

1 Hz geophone (3C)
Acquisition: data recording
DMT Summit telemetry system +
24 ch. compact unit
Sampling rate:
Data length:

1 ms
Vibroseis, 16 s
2 s correlated data (GF)
Weight drop, 10 s
GPS synchronization

Orion remote stations
Sampling rate:
Data length:

2 ms
Weight drop, 10 s
GPS synchronization

Geode seismograph (48 ch.)
Sampling rate:
Data length:

1 ms
Weight drop, 10 s
Synchronized with DMT
Acquisition: in field quality control
DMT acquisition + QC

Theoretical vs. real sweep

Vibroseis sweep QC

Correlated data
Common shot gathers: L1 data
Reflection seismic: data processing
Crosscorrelation
Data editing
Geometry
First break picking
Static correction
Band pass filtering
Spherical divergence compensation
Deconvolution
S/N improvement actions (*)
CDP sorting
Velocity analysis
NMO correction
CDP stack
Prestack migration (Kirchhoff)
Time to depth conversion (refraction velocities)
(*) based on the high spatially sampled data
Data processing: examples
Raw data

Processed data
Reflection seismic: pre-stack migration
Line L1
W

X (m)

E
Reflection seismic: data validation (time)

Pre-stack migration

Super CSG
vibroseis

CSG
weight drop
First break picking: P- velocities
Real data picking vs. synthetic data (direct modelling)
P wave

P model
First break picking: SH- velocities
Real data picking vs. synthetic data (direct modelling)
SH wave

SH model
Surface wave: weight drop data
Remote station data

Near
offset

Far
offset

Multichannel data
P- and S- velocities:
from refraction and surface wave analysis
Line 1: data interpretation
W

X (m)

E
Line 1: data interpretation
W

X (m)

E
Line 1: data interpretation
W

Soccher Fm.
Fonzaso Fm.
Vajont Fm.

R3

X (m)

E
Line 1: data interpretation
W

X (m)

E
Line 1: data interpretation
W

X (m)

E
Line 1: data interpretation
W

X (m)

E
Line 1: data interpretation
Conclusions
• Walkaway test for the tuning of the acquisition
parameters (i.e., geometry) is necessary to obtain reliable
data
• The integration of different seismic techniques (supported
by geology) is a key factor for data validation and
interpretation
• Reflection/refraction seismic and surface wave analysis
can be used as investigation tools in complex area

9oct 1 petronio-reflection seismic

  • 1.
    Reflection Seismic andSurface Wave analysis on complex heterogeneous media: the case of Mt. Toc landslide in Vajont valley Lorenzo Petronio 1, Jacopo Boaga 1 2 and Giorgio Cassiani 2 OGS – Istituto Nazionale di Oceanografia e Geofisica Sperimentale, Trieste 2 Dipartimento di Geoscienze - Università di Padova International Conference Vajont, 1963-2013 Thoughts and analyses after 50 year since the catastrophic landslide October 8-10, 2013, Padua, Italy
  • 2.
    Outline Vajont dam andmonte Toc landslide • Geology • Targets • Experiment: - Reflection seismic - Surface wave analysis • Data integration and results
  • 3.
    Vajont dam andmonte Toc landslide • Vajont dam, 264.6 m (1957 – 1959) • landslide - 9 October 1963 • around 2000 victims Nord 0 1 Km
  • 4.
    Monte Toc landslide •260 millions m3 (2000 x 1000 x 130 m) • slide: 500 m, 110 Km/h
  • 5.
  • 6.
    Targets • Can seismicmethods be used in this landslide environment? • Feasibility study for further studies/applications In the frame of “Strategic research project GEO-Risks”- “Geological and Hydrogeological processes: monitoring, modelling and impact in North-East Italy” Problems/limitations • • • • Rough topography and difficult logistics Karst area Strong heterogeneities (also lateral) Seismic impedance contrasts?
  • 7.
    Seismic survey: Walkaway testand experiment preparation • A priori information collection • Scouting • Walkaway test • Data analysis • Experiment design
  • 8.
    Seismic survey • Reflectionseismic (P- and SH- wave) • Refraction seismic (P- and SH- wave) • Surface wave
  • 9.
    Seismic survey: reflection/refraction seismic •P-wave reflection/refraction seismic L1 256 ch. 10 Hz z (fixed spread), 2 m, 510 m 24 ch. 4.5 Hz z (fixed spread) - 4 m 125 shots (vibroseis upsweep 14 s, 5-250 Hz) – 4 m L2 162 ch. 10 Hz z (fixed spread) – 2 m, 322 m 24 ch. 4.5 Hz z (fixed spread) – 4 m 81 shots (vibroseis upsweep 14 s, 5-250 Hz) – 4 m • SH-wave reflection/refraction seismic L1 113 ch. 10 Hz x (fixed spread) – 4 m, 448 m 113 ch. 10 Hz y (fixed spread) – 4 m 50 shots (vibroseis upsweep 14 s, 5-250 Hz) – 8 m
  • 10.
    Seismic survey: surfacewave • Surface wave L1 256 ch. 10 Hz z (fixed spread) – 2 m, 510 m 24 ch. 4.5 Hz z (fixed spread) - 4 m 48 ch. 4.5 Hz z (fixed spread) – 10 m 2 remote stations 3ch 1 Hz x, y, z 9 shots (weight drop – about 240 Kg; H=6, 10 and 14 m)
  • 11.
  • 12.
    Acquisition: seismic receivers 10Hz geophones (Z and 3C) 10 Hz and 4.5 Hz geophones (Z) 1 Hz geophone (3C)
  • 13.
    Acquisition: data recording DMTSummit telemetry system + 24 ch. compact unit Sampling rate: Data length: 1 ms Vibroseis, 16 s 2 s correlated data (GF) Weight drop, 10 s GPS synchronization Orion remote stations Sampling rate: Data length: 2 ms Weight drop, 10 s GPS synchronization Geode seismograph (48 ch.) Sampling rate: Data length: 1 ms Weight drop, 10 s Synchronized with DMT
  • 14.
    Acquisition: in fieldquality control DMT acquisition + QC Theoretical vs. real sweep Vibroseis sweep QC Correlated data
  • 15.
  • 16.
    Reflection seismic: dataprocessing Crosscorrelation Data editing Geometry First break picking Static correction Band pass filtering Spherical divergence compensation Deconvolution S/N improvement actions (*) CDP sorting Velocity analysis NMO correction CDP stack Prestack migration (Kirchhoff) Time to depth conversion (refraction velocities) (*) based on the high spatially sampled data
  • 17.
    Data processing: examples Rawdata Processed data
  • 18.
    Reflection seismic: pre-stackmigration Line L1 W X (m) E
  • 19.
    Reflection seismic: datavalidation (time) Pre-stack migration Super CSG vibroseis CSG weight drop
  • 20.
    First break picking:P- velocities Real data picking vs. synthetic data (direct modelling) P wave P model
  • 21.
    First break picking:SH- velocities Real data picking vs. synthetic data (direct modelling) SH wave SH model
  • 22.
    Surface wave: weightdrop data Remote station data Near offset Far offset Multichannel data
  • 23.
    P- and S-velocities: from refraction and surface wave analysis
  • 24.
    Line 1: datainterpretation W X (m) E
  • 25.
    Line 1: datainterpretation W X (m) E
  • 26.
    Line 1: datainterpretation W Soccher Fm. Fonzaso Fm. Vajont Fm. R3 X (m) E
  • 27.
    Line 1: datainterpretation W X (m) E
  • 28.
    Line 1: datainterpretation W X (m) E
  • 29.
    Line 1: datainterpretation W X (m) E
  • 30.
    Line 1: datainterpretation
  • 31.
    Conclusions • Walkaway testfor the tuning of the acquisition parameters (i.e., geometry) is necessary to obtain reliable data • The integration of different seismic techniques (supported by geology) is a key factor for data validation and interpretation • Reflection/refraction seismic and surface wave analysis can be used as investigation tools in complex area