Neo4j - How KGs are shaping the future of Generative AI at AWS Summit London ...
9oct 4 crosta-monitoring and modelling
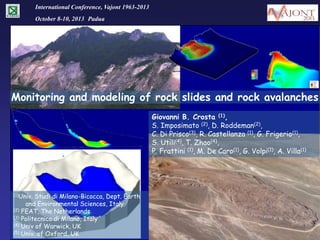
1. International Conference, Vajont 1963-2013
October 8-10, 2013 Padua
Monitoring and modeling of rock slides and rock avalanches
Giovanni B. Crosta (1),
S. Imposimato (2), D. Roddeman(2),
C. Di Prisco(3), R. Castellanza (1), G. Frigerio(1),
S. Utili(4), T. Zhao(4),
P. Frattini (1), M. De Caro(1), G. Volpi(1), A. Villa(1)
(1)Univ.
Studi di Milano-Bicocca, Dept. Earth
and Environmental Sciences, Italy
(2) FEAT, The Netherlands
(3) Politecnico di Milano, Italy
(4) Univ of Warwick, UK
(5) Univ. of Oxford, UK
Crosta G.B.
2. Topics
A short unifying personal journey from
monitoring to evolution/runout modeling
La Saxe rockslide
• ‘rock slides’ can evolve to collapse
• assessment of evolution in time and space
Effect of erosion
Failure
Cumulat. Displ.
Formation of a
continuous failure
surface
Pre-failure
Displacement rate, released en.,
cumulative displacement
1) Forecasting displacement evolution
model implementable in EWS
Reactivations
Post failure
Critical phase
Seasonal, annual activity
Collapse
Failure
Alert
PreResidual fail
alert
time
Effect of slope geometry
and erodible materials
Impact with water
t3
t1
t2
2) Spreading and interaction with
material along the path: lab scale
experiments, field observations,
2D and 3D numerical modeling
with a special eye on Vajont
rockslide
Crosta G.B.
3. Monitoring displacements
Ground surface & deep displacements
Understand evolution/state of activity
La Saxe rockslide, Italy
Sensitivity to perturbations
• Seasonal
• Sudden acceleration
• behaviour in absence of
perturbations
Thresholds for EWS
Multi parametric
DMS probe
Crosta G.B.
4. Monitoring displacements
Time lag
?
?
piezo
?
•
Multi parametric
DMS probe
2011-2013
Failure surface and piezometric head
geometry by multiple measuring
points e.g. slide thickness
•
State of activity at depth surficial
•
Delay in activation Time lag with
•
Thickness of shear zone spatial
•
•
Weakening – strengthening
Slow continuous and/or stick slip
vs deep displacements
respect to piezometric level
distribution (and inclination)
Crosta G.B.
7. 3D FEM: ave material properties
Failure progressive weakening
Ave. Material properties leading to a
generalized instability
Midas - GDS
3D effect of lake impounding on slope
stability and activity
Thin shear zone along the 3D
reconstruction of the failure zone
Bistacchi et al.
300
200
cohesion [kPa]
Progressive Shear strength reduction
till loss of convergence
250
150
100
50
0
26
24
22
20
18
friction angle [deg]
16
14
12
Crosta G.B.
8. 3D FEM: ave material properties
Displacement
# 1/1: Lake level 700 m a.s.l.
(c=300 kPa, =26°)
Plastic strain
rock mass
c=300 kPa
=26°
Crosta G.B.
9. 3D FEM: ave material properties
Displacement
# 1/2: Lake level 700 m a.s.l.
(c=200 kPa, =22°)
Plastic strain
Crosta G.B.
10. 3D FEM: ave material properties
Displacement
# 1/3: Lake level 700 m a.s.l.
(c=100 kPa, =18°)
Plastic strain
Crosta G.B.
11. 3D FEM: ave material properties
Displacement
# 1/4: Lake level 700 m a.s.l.
(c=50 kPa, =14°)
Plastic strain
Crosta G.B.
12. 3D FEM: ave material properties
Displacement
# 1/5: Lake level 700 m a.s.l.
(c=25 kPa, =13°)
Plastic strain
Loss of
convergence
Crosta G.B.
13. Pre-Collapse velocity
Vajont
Observed pre-collapse velocity
from historical data (62 events)
Forecasting long and short term
displacement
Vajont
Up to collapse
Problem last measurement before
collapse are rare
Crosta G.B.
14. Displacement forecasting:
a
1D Visco plastic model
• Average constant thickness in large sectors
• Prevalent translational displacement
• Sliding surface at fixed position, localized shear
band with constant thickness
H
hw (t)
Ds
• Large displacements, close to or at
residual/critical state
• Considering inertial dynamic and viscous effects: a pseudo-dynamic
Newmark-type approach coupled to a visco-plastic model (Perzyna’s type):
delayed-plastic constitutive approach (standard plastic flow rule is modified
and the consistency condition removed; di Prisco et al., 2003; Zambelli et al., 2004)
Time evolution of visco
plastic strain
constitutive
parameter
Viscous
nucleus
plastic
potential
effective
stress
• Includes: weight, seepage force, hydrostatic
force, active/passive force
• Main Forcing: piezometric level oscillations,
cyclic dynamic perturbations
Crosta G.B.
15. Displacement forecasting:
1D Visco plastic model
Included in the modeling
Viscous nucleus
Plasticity function
1. Linear-bilinear kernel
2. Exponential kernel
3. Softening/Flash weakening/rate & statevariable constitutive laws
4. Seepage during lake drawdown
3. Softening/Rate & State-variable law/Flash weakening
Thermal diffusivity
typical dimension asperity (P)
Weakened
Static
Critical velocity
Instant. velocity
Dietrich –Ruina law: (Dietrich, 1994)
Weakening temperature
heat cap. per univ vol
background T
Shear strength of asperity
rate
state
Rice (2006), Beeler, Tullis, and Goldsby. (2008)
Kuwano and Hatano. (2011)
Ferri, Di Toro, Hirose, Han, Noda, Shimamoto, Quaresimin, and de Rossi (2011) Vajont
Helmstetter et al., 2004; Veveakis et al., 2007; Vardoulakis, 2002; Alonso and Pinyol, 2010
Crosta G.B.
16. Displacement forecasting:
Vajont
calibration on initial displacements
Flash
weakening/softening
(weak = 0.14, Vweak=0.3 – 0.4 mm/hr)
Helmstetter et al., 2004
Veveakis et al., 2007
Crosta G.B.
18. 1D visco plastic model:
weakly interacting blocks
Monitored
data
Considering interaction forces in terms
of lateral frictional resistence or
dragging and of front- and back-thrust
Model calibration: 2009-2010
Model prediction: 2011-2013
Crosta et al., in press
Crosta G.B.
19. Acceleration collapse spreading
A short unifying journey from monitoring to
evolution/runout modeling
Effect of erosion
• ‘rock slides’ can evolve to a final collapse
• assessment of evolution in time and space
1) Forecasting displacement evolution by a
model
Effect of slope geometry
and erodible materials
Impact with water
t3
t1
t2
2) Runout observations of spreading and interaction with material
along the path: lab scale experiments, field observations, 2D and 3D
numerical modeling
Large displ. weakening geometrical instability loss of rock
mass strength collapse erosion impact reservoir
Crosta G.B.
20. 2D FEM stability & runout
Evolution of Tochnog FEM code (Roddeman, 2001, 2013) arbitrary Eul.-Lagr. AEL calculations
Isoparametric FE, Euler backward timestepping for numerical stability in time
Transport of state variables in space. Stabilised by Streamline Upwind Petrov Galerkin
Automatic timestep size and # of iterations, based on unbalanced force error
Large deformation material description
Updated Lagrange: incrementally objective Lagrangian model, polar decomposition of incremental deformation tensor
Incrementally objective to account for large rotations
Determination of initial equilibrium stress state with quasi static time-stepping; Inertia included
Material laws: Classical elasto-plasticity. M-C, Drucker-Prager yield surface, etc.
Non-associated for granular materials
rock = 23°
surf = 8.7°
Shear through
no lake
Calibrated against depth and time
Crosta et al., 2002; Nato Workshop Celano
Crosta G.B.
21. 3D FEM stability & runout
4 sec
16 sec
Crosta et al., 2005 EGU;
Crosta et al., 2007; EC LessLoss Project
12 sec
8 sec
36 sec
20 sec
50 sec
Fully 3D
105.000 hexahedral
8 node elements
= 12-5.7°
no lake
Calibrated against depth and time
Crosta G.B.
22. Validation: erosion and deposition
A=Hi/Li = 3.2
Numerical
Experimental
Experimental
Numerical
Numerical
Deposition:
Interface
aggradation
Model validation against well controlled lab granulat step collapse tests
Crosta et al., 2007; Benchmarking test Hong Kong;
Crosta et al., 2007; EGU Wien
Crosta et al., 2008 JGR
Crosta G.B.
23. 3D erosion – entrainment - ploughing
Frictional and Cohesive material
Erodible thickness: 100 m
Fold-like
Cohesive material
Erodible thickness: 25 m
Crosta et al., 2008; 2D saturatd soil, Engeo
Crosta et al., 2011;3D, WLF2 Rome
• radial pattern of deformation
• thickness of layer inversely related
to runout
• deposit area inversely related to
thickness of erodible layer
• deformation larger in thicker and
frictional materials
Wedge Thrust-like
Crosta G.B.
24. Thick slide-shallow water interaction
Materials
Shear stress
2s
Slide Froude
number
Fr = v/(gh)1/2 =
0.26 -0.75
Velocity
10 s
20 s
Crosta et al., 2003; EGU Wien
Crosta et al., 2011; WLF2 Rome
71.800 triangular elements, ave. size = 4 m, 15.500: landslide, 1.000: old landslide
material, 1800: water reservoir ; incompressible, fully inviscid
Landslide properties: Mohr-Coulomb material: = 24 kN/m3; = 0.23, = 17°, c = 300 kPa
basal plane: = 7.5°, c = 10 kPa, (Skempton, 1966; Hendron and Patton, 1985; Tika and Hutchinson, 1999)
Crosta G.B.
25. Validation:
Materials
Velocity
field
Quasi-rigid slide-deep water interaction
Materials
Velocity
field
0.6 s
0.1 s
Velocity
field
Materials
1.2s
3m
0.7 s
0.2 s
0.8 s
0.3 s
1.4 s
1.6 s
0.9 s
0.5 s
1.8 s
1.0 s
0.4 s
2.0 s
Model Validation:
2D modelling of Aknes rockslide
Sælevik’s et al. (2009) water tank experiment
for an impact velocity of 3.38 m s-1 of a 1 m long “deformable” granular
slide, Fr = 1.4 showing a backward collapsing impact crater
Crosta et al., 2011; WLF2 Rome
Crosta G.B.
26. Validation:
Deformable slide-deep water interaction
Model Validation
t = 0.24 s (v_max = 4.52m/s)
COMPUTED VELOCITY FIELD
t = 0.84 s (v_max = 2.29m/s)
t = 1.40 s (v_max = 2.22m/s)
t = 0.44 s (v_max = 1.57m/s)
t = 1.54 s (v_max = 1.62m/s)
t = 0.98 s (v_max = 2.29m/s)
time
time
t = 0.56 s (v_max = 1.49m/s)
t = 1.12 s (v_max = 2.00m/s)
t = 1.84 s (v_max = 1.17m/s)
solitary wave
t = 0.70 s (v_max = 2.25m/s)
t = 1.26 s (v_max = 1.33m/s)
Fritz, 2002, Heller, 2007
Outward collapse of the
impact crater is observed
t = 2.04 s (v_max = 1.07m/s)
together with wash back,
flow divergence, and
propagation of the
primary solitary wave
Crosta G.B.
27. 3D: thick slide-shallow water interaction
Velocity vectors
at 3 s intervals
ca 800.000 hexahedrons: ca. 22 x22 m x 18 m
Landslide properties:
Mohr-Coulomb material: = 24 kN/m3; Ed = 1*1010 Pa; = 0.23, = 23°, c = 1 Pa;
Basal plane: = 5.7°, c = 0 kPa (Skempton, 1966; Hendron and Patton, 1985; Tika and Hutchinson, 1999)
Crosta G.B.
30. Validation: deposit and water wave limits
slide and water max velocity and
wave height
100
1000
Max observed water
runup (ca. 900 m a.s.l.)
VELOCITY (M S-1)
900
80
800
700
60
600
0 sec
500
40
400
300
20
200
water
slide
Dam
Deposit
100
max water height [m]
0
Rockslide limit
0
0
10
20
30
40
50
Max water runup
line
TIME (S)
Scar limit
After 51 sec
Dam
Comparison of the initial and final
rockslide boundaries, and reservoir
geometry with the computed
geometries
Deposit
Rockslide
mass
Computed water
geometry
Scar limit
Crosta G.B.
31. Validation: point trajectories
Computed vs “observed”final displacement
Pre- and post-failure positions of geological marker points (Rossi and Semenza)
Crosta G.B.
32. Challenging subjects:
Coupled DEM-CFD model
basal friction angle: weak layer=12°
Progressive bond breakage
Scaled grain size
Hydraulic conductivity
Water wave generation
Crosta G.B.
33. Challenging subjects:
Collapse over erodible bed
Gravel/sand
Sand/sand
Sand/rigid bed
V = 5100 cm3 ; α = 40°
V = 5100 cm3 ; α = 55°
V = 5100 cm3 ; α = 55°
Crosta G.B.
34. Challenging subjects:
space-time evolution, shock wave
To describe and model dynamically changing
geometry (flow to final deposition)
geometry and boundary conditions
Erodible / non erodible layers
#3 – 45°
Shock wave propagation
#4 - 50°
1
Deposit
2
3
Eroded &
redeposited
#5 – 60°
2
Upstream
growth
3
Initial
wave
0.3 m
1
At rest
Time 1.0 s
Crosta G.B.
35. Conclusions
- Displacement forecasting:
• acceleration to collapse
• softening/weakening
• Easily implemented in
EWS
- different failure and entrainment
modes are involved and replicated
•
•
•
formation of thrust-like and fold-like
features
Debris pushing and sinking
basal dragging and wave-like features
- Constitutive laws; metastable materials
- 3D ‘Fully’ integrated/interacting slide –
water systems
- Future challenges
Crosta G.B.
37. Thick slide-shallow water interaction
Landslide Volume:
ca 275-300 Mm3, runout = 360 m, runup = 140 m
estimated ave. velocity = 20-30 m s-1
Reservoir:
Volume ca 115 Mm3, mean depth: 100 m; Water
runup = 235 m
Failure:
ca 40-50 s (Ciabatti, 1964), seismic shocks = 97
sec including signal generated by the water wave
Slide Froude number
Fr = v/(gh)1/2 = 0.26 -0.75
v = slide velocity, h = reservoir water
depth
Crosta G.B.