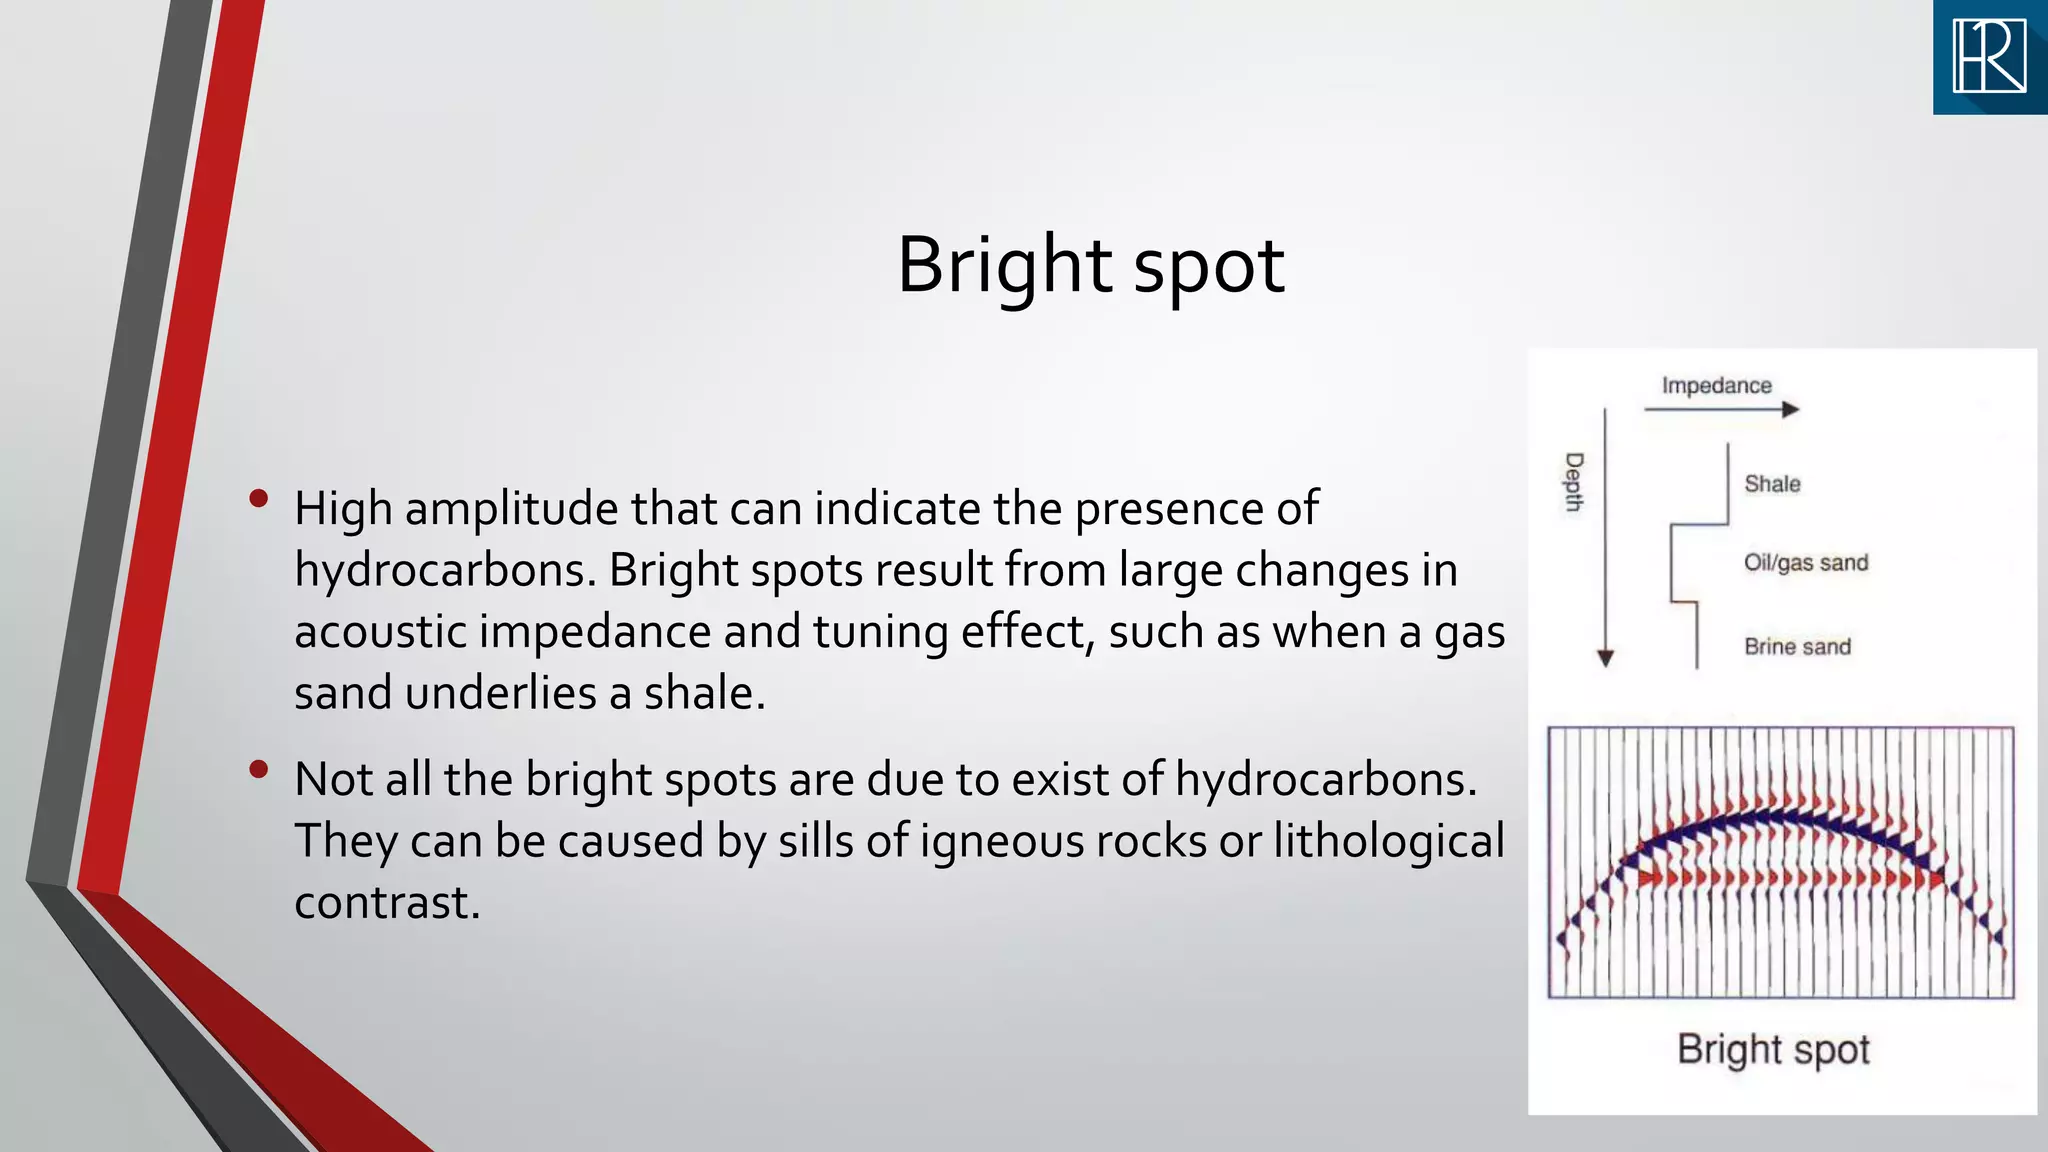
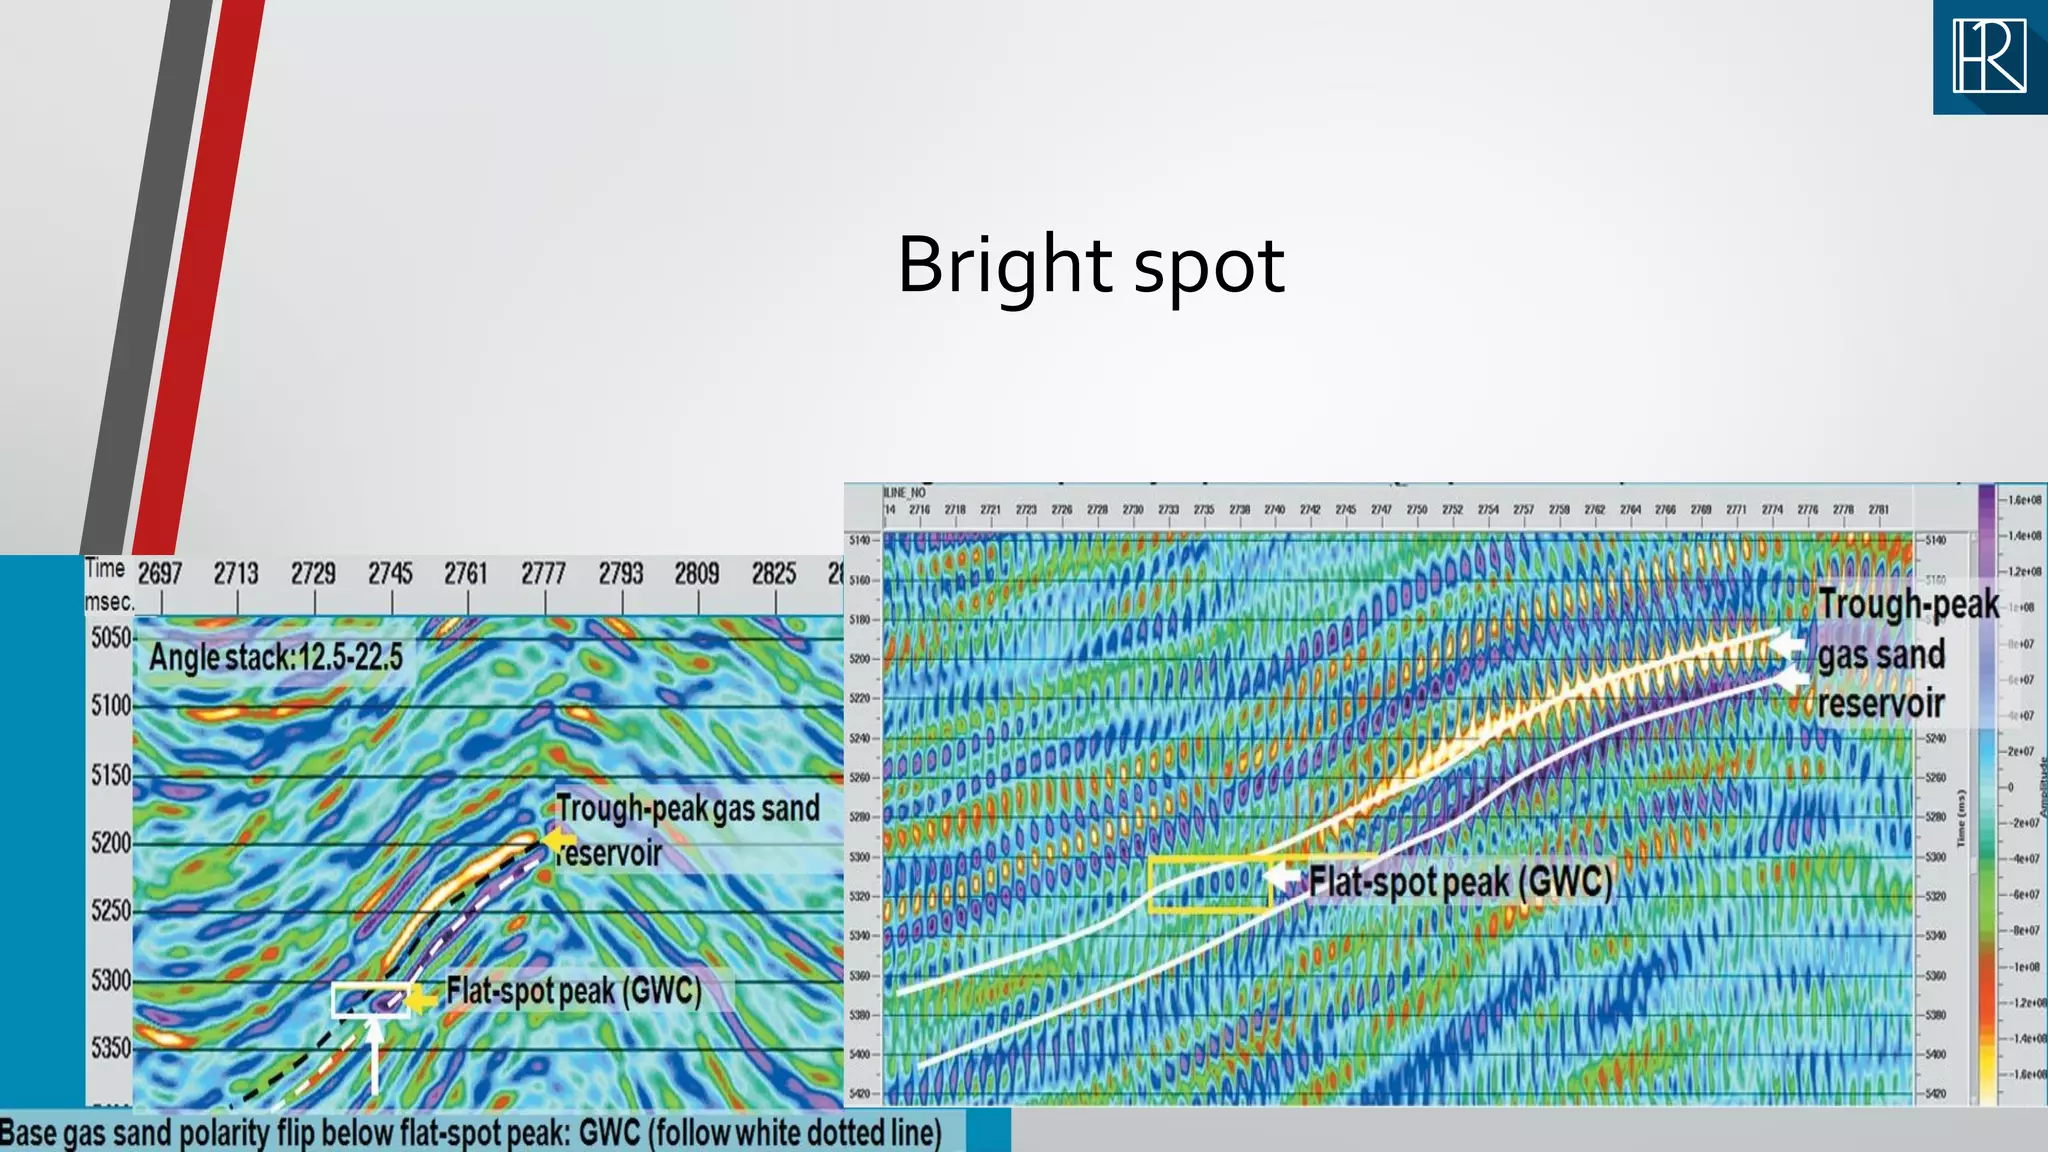
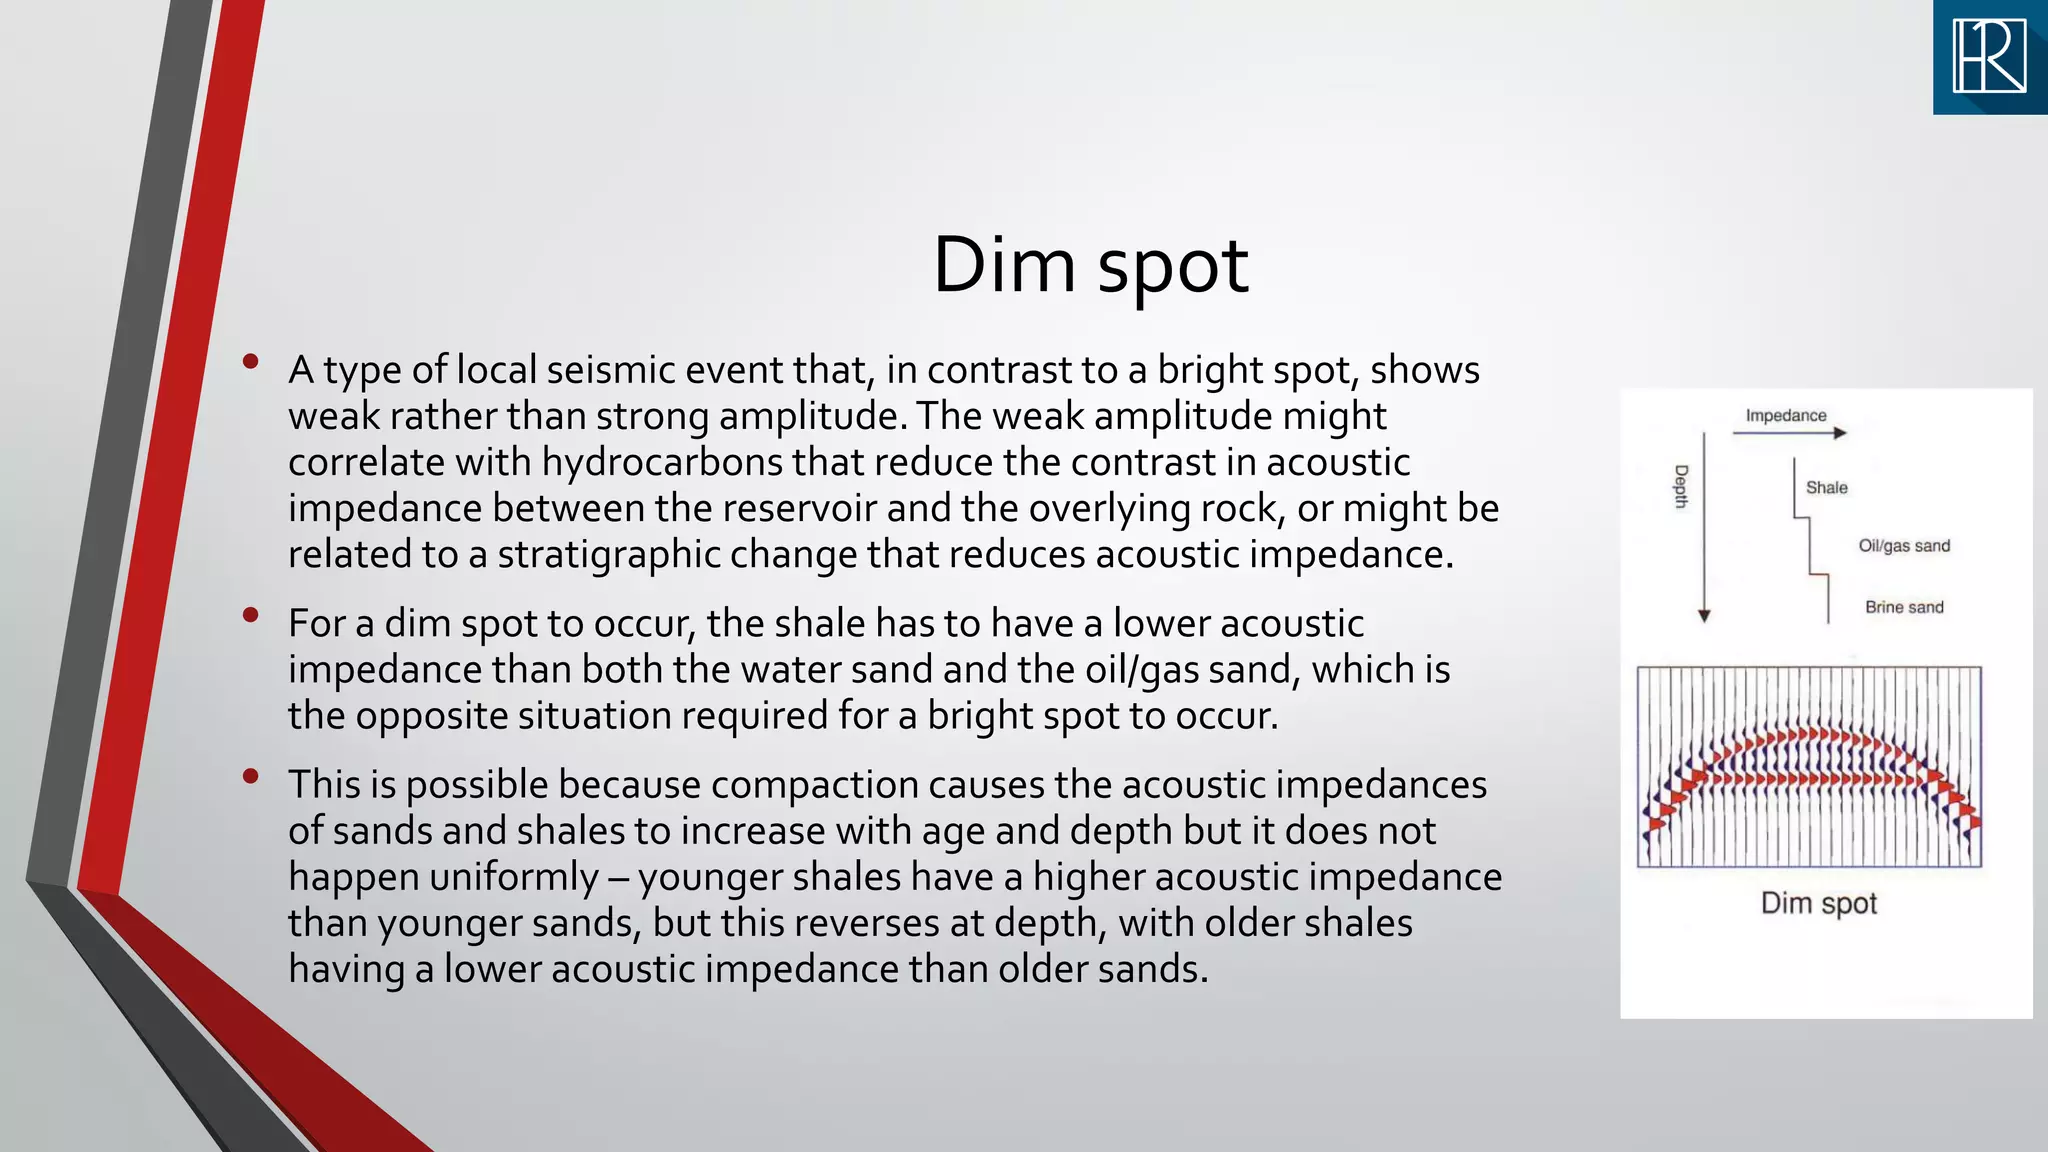
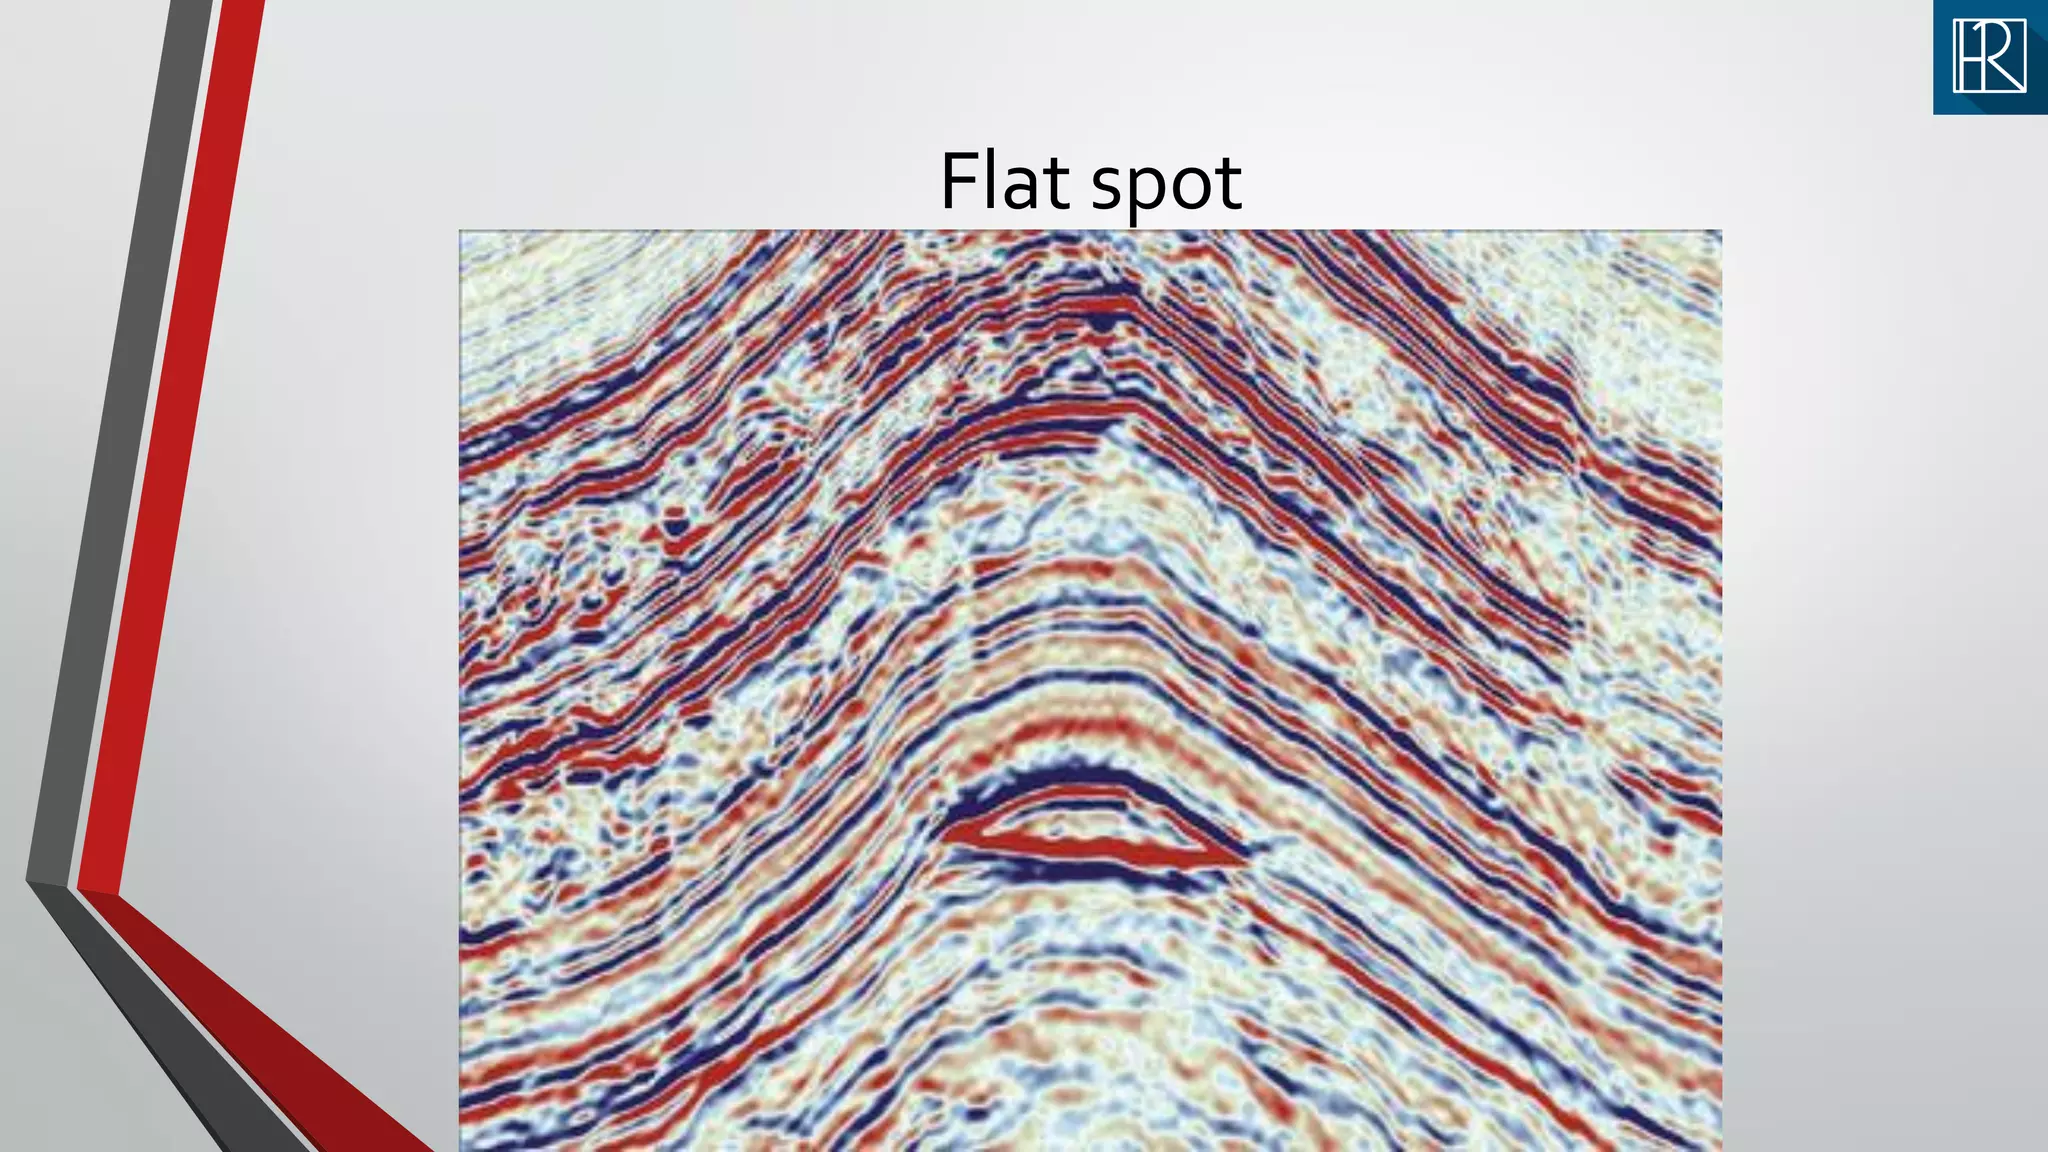
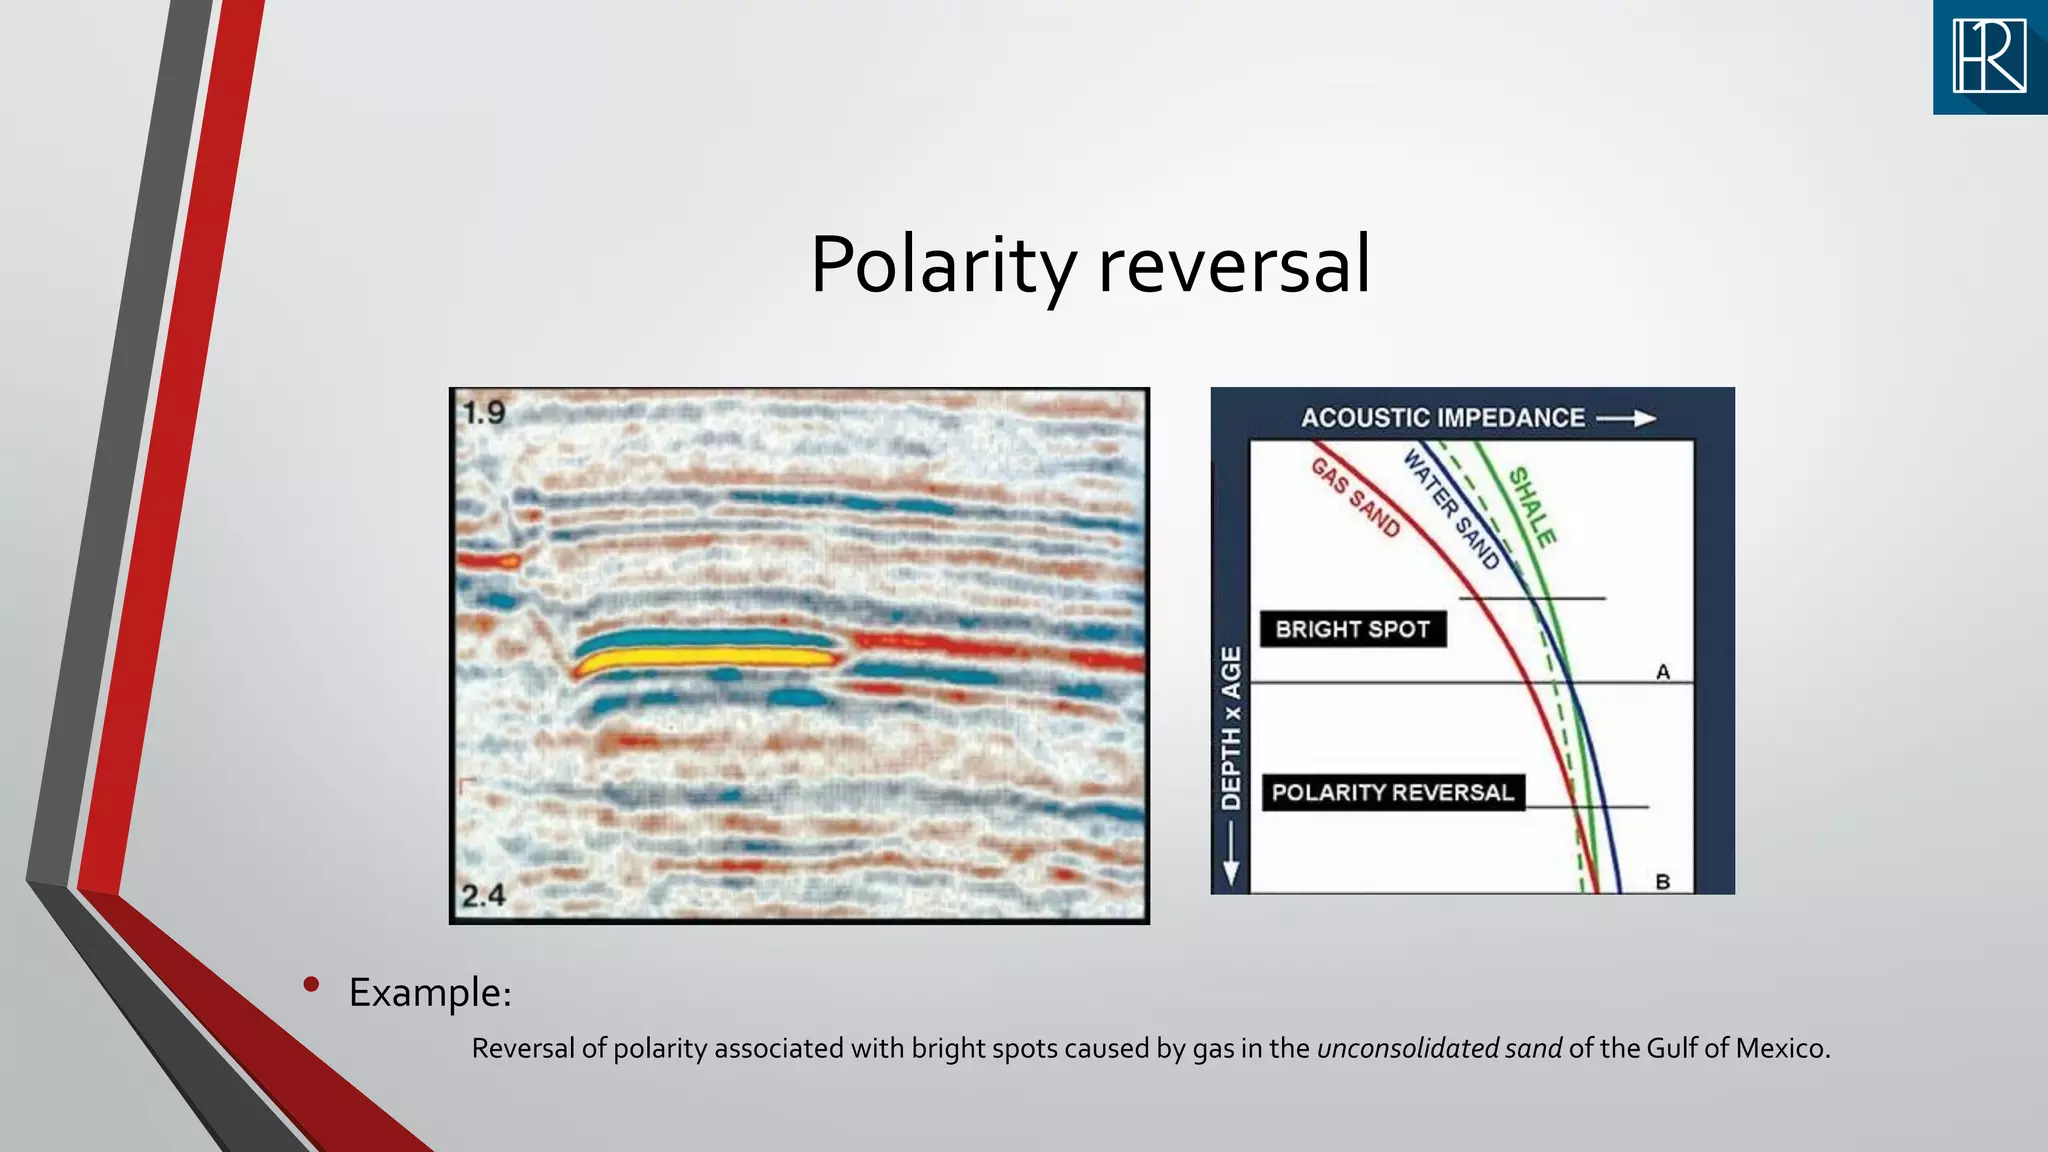
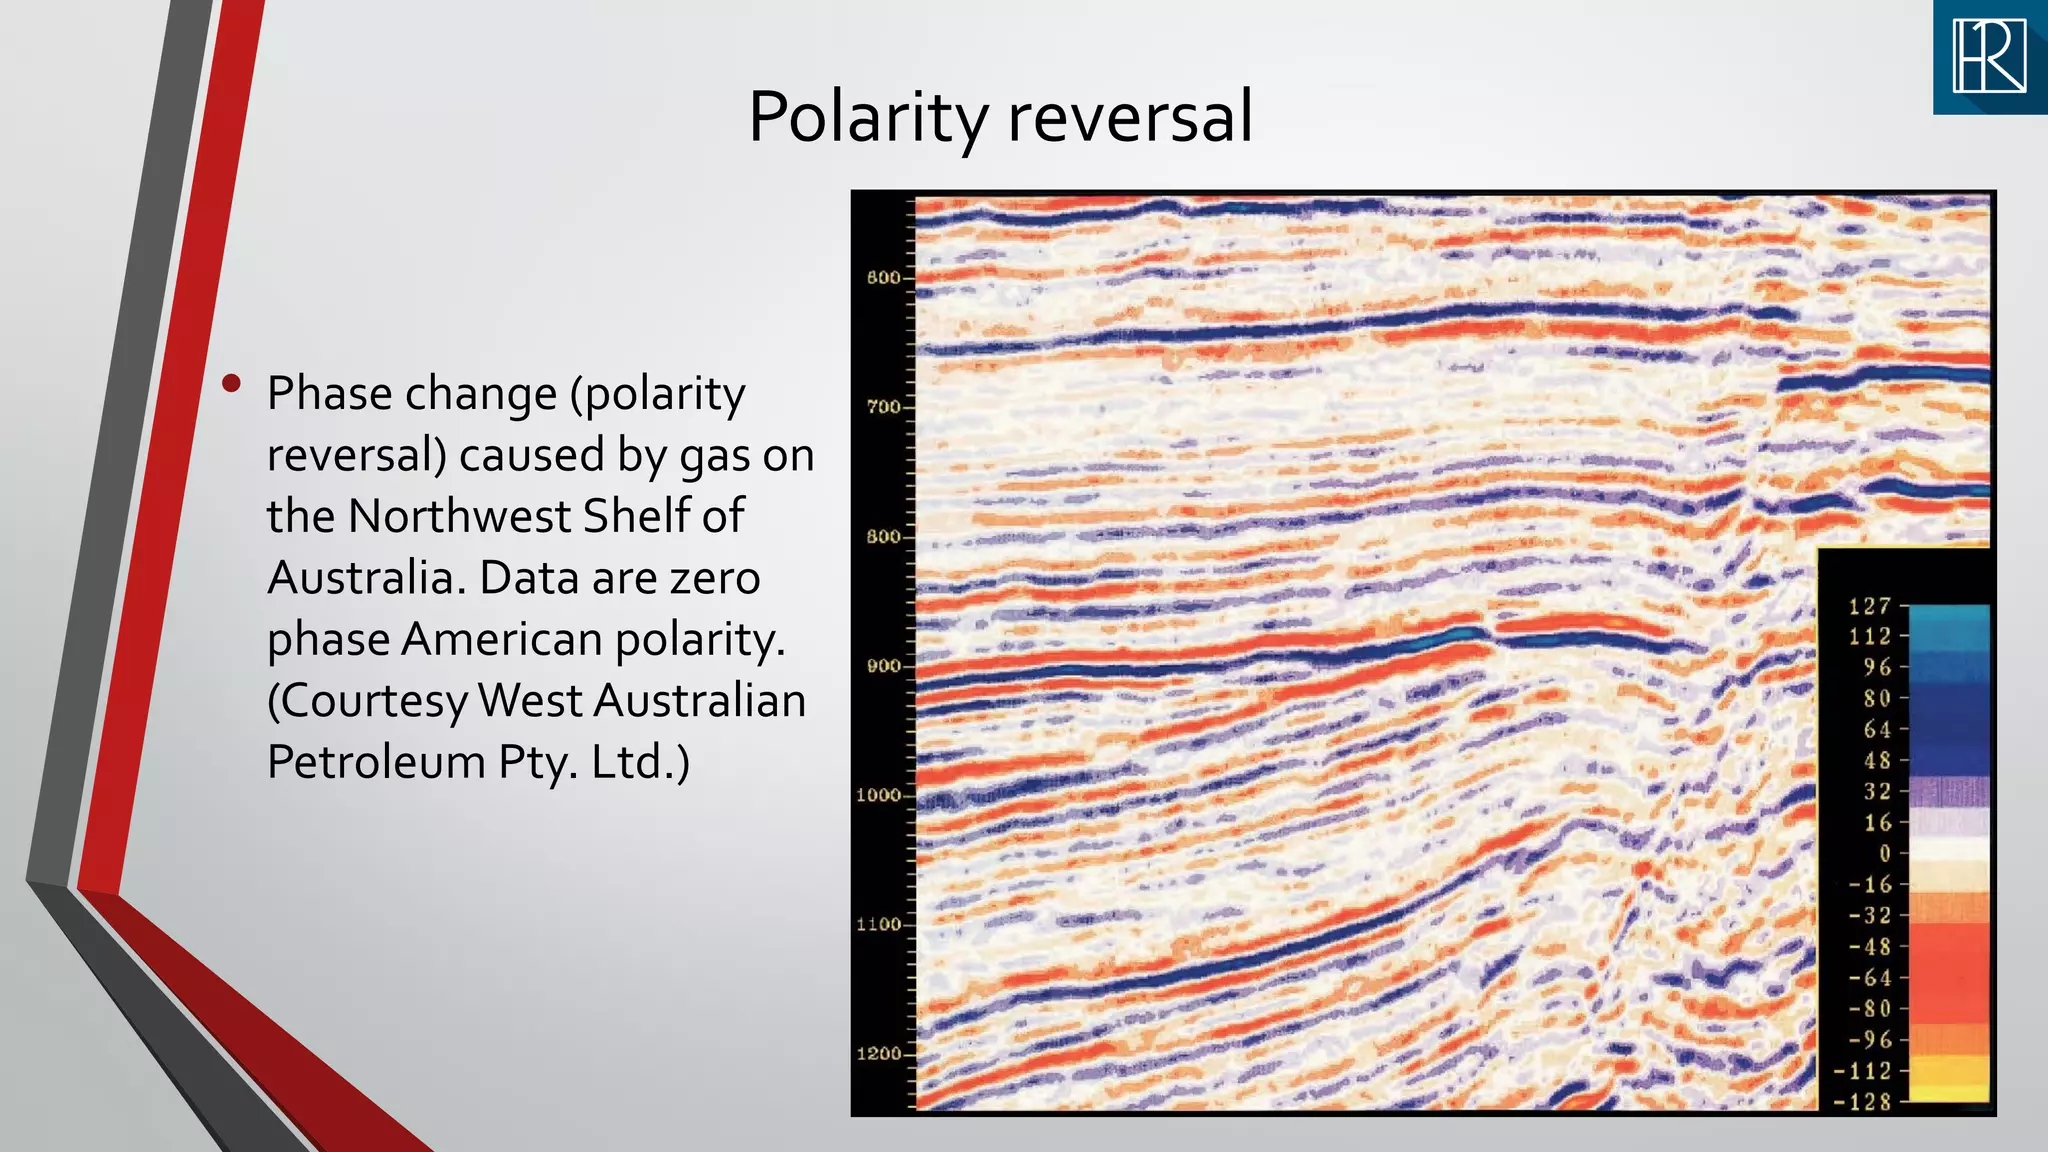
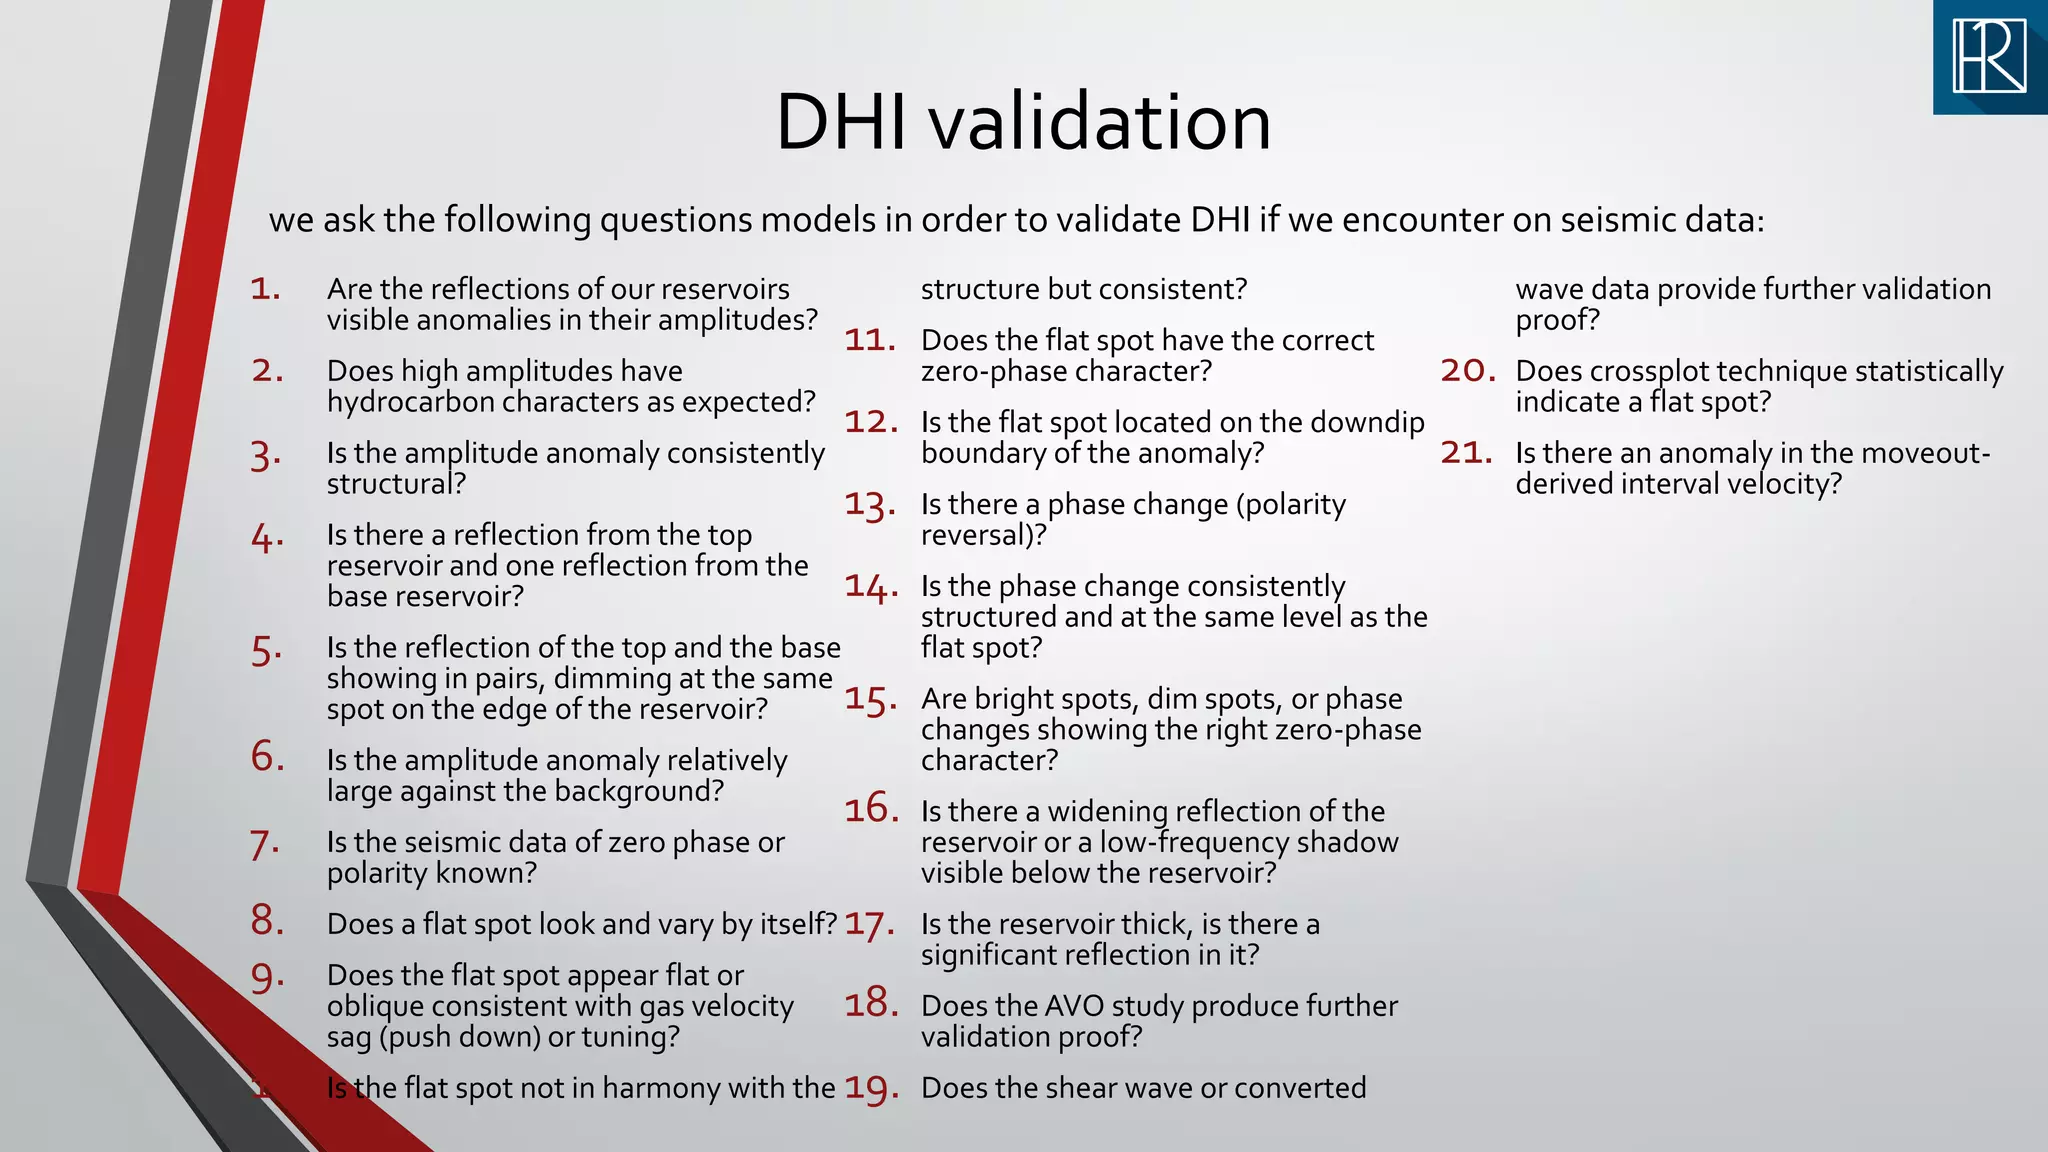
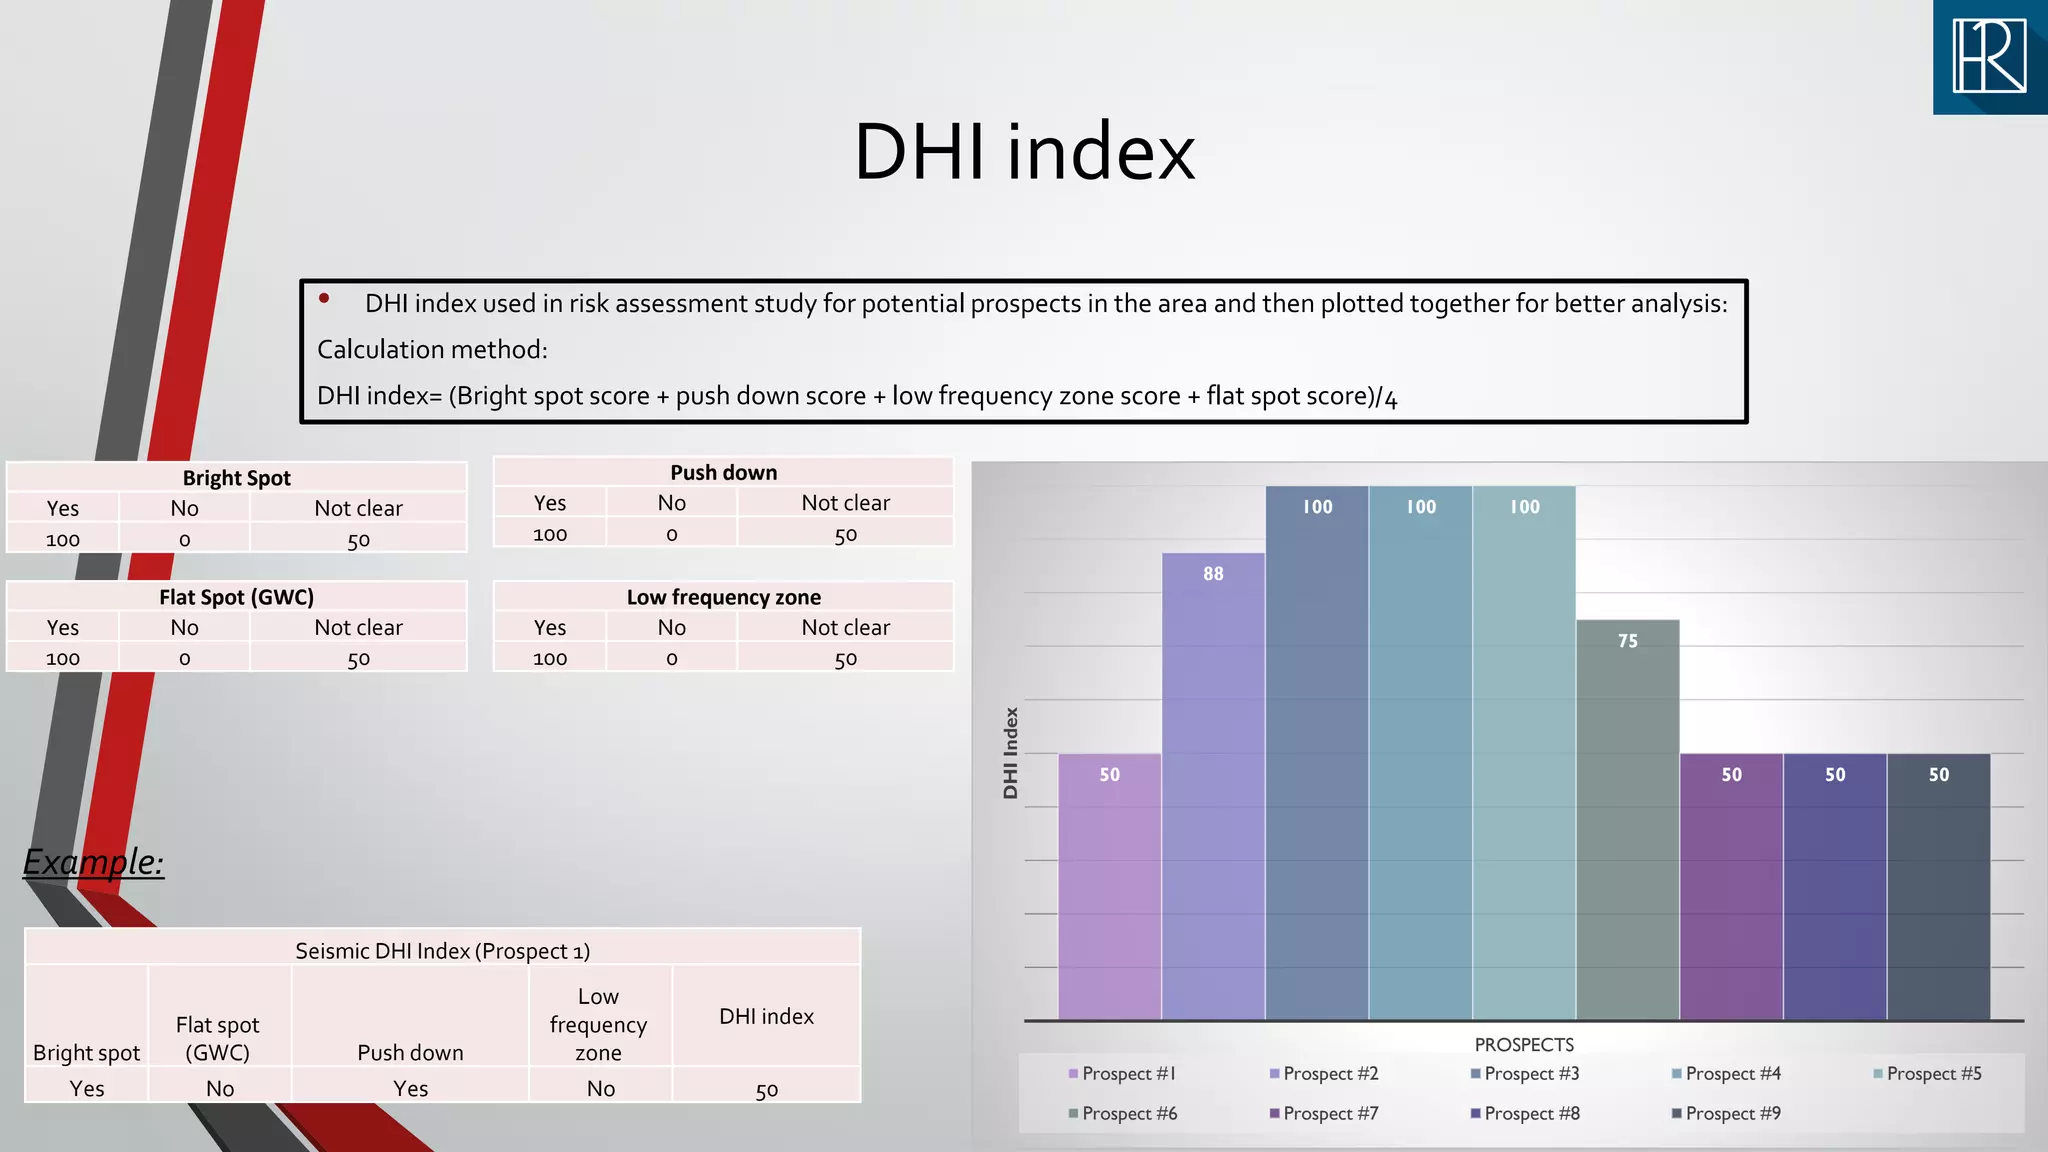
DIRECT HYDROCARBON INDICATOR
(DHI)
Hatem Refaat Abdel Mobdy Radwan
Masters degree candidate – Alexandria University
Hatem_refaat95@Hotmail.com
This icon means that this presentation was made by Hatem Radwan.
And the presentation material is compiled from various sources, which are indicated in the references page.
Please mention the author when you copy something from the presentation.
Also, if you notice any information that might be wrong please contact me via my e-mail.
Thank you !
Definition
A hydrocarbon indicator (HCI) or direct hydrocarbon indicator (DHI), is an anomalous seismic attribute value or
pattern that could be explained by the presence of hydrocarbons in a oil or gas reservoir.
DHIs are particularly useful in hydrocarbon exploration for reducing the geological risk of exploration wells.
Broadly, geophysicists recognize several types of DHI:
• Bright spots: localized amplitudes of greater magnitude than background amplitude values..
• Flat spots: nearly horizontal reflectors that cross existing stratigraphy, possibly indicating a hydrocarbon
fluid level (contact) within an oil or gas reservoir.
• Dim spots: low amplitude anomalies.
• Polarity reversals can occur where the capping rock has a slightly lower seismic velocity than the reservoir
and the reflection has its sign reversed.
Note that:
Some geoscientists regard amplitude versus offset anomalies as a type of direct hydrocarbon indicator.
For example, the amplitude of a reflection might increase with the angle of incidence, a possible indicator of
natural gas.
Bright spot
• High amplitude that can indicate the presence of
hydrocarbons. Bright spots result from large changes in
acoustic impedance and tuning effect, such as when a gas
sand underlies a shale.
• Not all the bright spots are due to exist of hydrocarbons.
They can be caused by sills of igneous rocks or lithological
contrast.
Bright spot
Dim spot
• A type of local seismic event that, in contrast to a bright spot, shows
weak rather than strong amplitude.The weak amplitude might
correlate with hydrocarbons that reduce the contrast in acoustic
impedance between the reservoir and the overlying rock, or might be
related to a stratigraphic change that reduces acoustic impedance.
• For a dim spot to occur, the shale has to have a lower acoustic
impedance than both the water sand and the oil/gas sand, which is
the opposite situation required for a bright spot to occur.
• This is possible because compaction causes the acoustic impedances
of sands and shales to increase with age and depth but it does not
happen uniformly – younger shales have a higher acoustic impedance
than younger sands, but this reverses at depth, with older shales
having a lower acoustic impedance than older sands.
Flat spot
• A flat spot is a seismic attribute anomaly that appears as a horizontal reflector cutting across the
stratigraphy elsewhere present on the seismic image. Its appearance can indicate the presence of
hydrocarbons.Therefore, it is known as a direct hydrocarbon indicator and is used by geophysicists in
hydrocarbon exploration.
• A flat spot can result from the increase in acoustic impedance when a gas-filled porous rock (with a
lower acoustic impedance) overlies a liquid-filled porous rock (with a higher acoustic impedance). It
may stand out on a seismic image because it is flat and will contrast with surrounding dipping
reflections.
• There are a number of other possible reasons for there being a flat spot on a seismic image. It could be
representative of a mineralogical change in the subsurface or an unresolved shallower multiple.
Additionally, the interpretation of a flat spot should be attempted after depth conversion to confirm
that the anomaly is actually flat.
Flat spot
Polarity reversal
• polarity reversal or phase change is a local amplitude seismic attribute anomaly that can
indicate the presence of hydrocarbons and is therefore known as a direct hydrocarbon
indicator. It primarily results from the change in polarity of the seismic response when a
shale (with a lower acoustic impedance) overlies a brine-saturated zone (with a high
acoustic impedance), that becomes invaded with an oil/gas sand (with the lowest acoustic
impedance of the three).This changes the acoustic impedance contrast from an increase
to a decrease, resulting in the polarity of the seismic response being reversed.
• For a polarity reversal to occur, the shale has to have a lower acoustic impedance than the
water sand and both are required to have a higher acoustic impedance than the oil/gas
sand.
Polarity reversal
• Example:
Reversal of polarity associated with bright spots caused by gas in the unconsolidated sand of the Gulf of Mexico.
Polarity reversal
• Phase change (polarity
reversal) caused by gas on
the Northwest Shelf of
Australia. Data are zero
phase American polarity.
(CourtesyWest Australian
Petroleum Pty. Ltd.)
DHI validation
1. Are the reflections of our reservoirs
visible anomalies in their amplitudes?
2. Does high amplitudes have
hydrocarbon characters as expected?
3. Is the amplitude anomaly consistently
structural?
4. Is there a reflection from the top
reservoir and one reflection from the
base reservoir?
5. Is the reflection of the top and the base
showing in pairs, dimming at the same
spot on the edge of the reservoir?
6. Is the amplitude anomaly relatively
large against the background?
7. Is the seismic data of zero phase or
polarity known?
8. Does a flat spot look and vary by itself?
9. Does the flat spot appear flat or
oblique consistent with gas velocity
sag (push down) or tuning?
10. Is the flat spot not in harmony with the
structure but consistent?
11. Does the flat spot have the correct
zero-phase character?
12. Is the flat spot located on the downdip
boundary of the anomaly?
13. Is there a phase change (polarity
reversal)?
14. Is the phase change consistently
structured and at the same level as the
flat spot?
15. Are bright spots, dim spots, or phase
changes showing the right zero-phase
character?
16. Is there a widening reflection of the
reservoir or a low-frequency shadow
visible below the reservoir?
17. Is the reservoir thick, is there a
significant reflection in it?
18. Does the AVO study produce further
validation proof?
19. Does the shear wave or converted
wave data provide further validation
proof?
20. Does crossplot technique statistically
indicate a flat spot?
21. Is there an anomaly in the moveout-
derived interval velocity?
we ask the following questions models in order to validate DHI if we encounter on seismic data:
DHI index
• DHI index used in risk assessment study for potential prospects in the area and then plotted together for better analysis:
Calculation method:
DHI index= (Bright spot score + push down score + low frequency zone score + flat spot score)/4
Seismic DHI Index (Prospect 1)
Bright spot
Flat spot
(GWC) Push down
Low
frequency
zone
DHI index
Yes No Yes No 50
Bright Spot
Yes No Not clear
100 0 50
Flat Spot (GWC)
Yes No Not clear
100 0 50
Push down
Yes No Not clear
100 0 50
Low frequency zone
Yes No Not clear
100 0 50
Example:
50
88
100 100 100
75
50 50 50
PROSPECTS
DHIIndex
Prospect #1 Prospect #2 Prospect #3 Prospect #4 Prospect #5
Prospect #6 Prospect #7 Prospect #8 Prospect #9
Velocity Push down analysis
Push down (velocity sag) due
to gas accumulation
Velocity Anomaly - pull down
V1 < V2
Interpretive sequence to DHI
Module 1
References• Seismic Amplitude, An Interpreter’s Handbook: Rob Simm & Mike Bacon.
• Schlumberger oilfield Glossary.
• Interpretation ofThree-Dimensional Seismic Data:Alistair R. Brown
• M. Bacon; R. Simm;T. Redshaw (2007). 3-D Seismic Interpretation.Cambridge:Cambridge University
Press.
• Brown,Alistar. R., (2010), “Dim Spots in Seismic Images as Hydrocarbon Indicators”,AAPG Search
and DiscoveryArticle #40514
• Hilterman, Fred J. (2001). Seismic amplitude interpretation: 2001 distinguished instructor short
course. Houston,TX: SEG.
• Direct Hydrocarbon Indicator (DHI): Seismic Interpreter website (
https://seismicinterpreter.wordpress.com/ )
• RICHARD J. DAVIES JOSEPH A.CARTWRIGHT SIMON A. STEWART MARK LAPPIN and JOHN R.
UNDERHILL : 3D SeismicTechnology:Application to the Exploration of Sedimentary Basins.
• Interpretation ofThree-Dimensional Seismic Data- Sixth Edition By Alistair R. Brown.
Thanks !
THANK YOU !

Direct hydrocarbon indicators (DHI)

  • 1.
    DIRECT HYDROCARBON INDICATOR (DHI) HatemRefaat Abdel Mobdy Radwan Masters degree candidate – Alexandria University Hatem_refaat95@Hotmail.com
  • 2.
    This icon meansthat this presentation was made by Hatem Radwan. And the presentation material is compiled from various sources, which are indicated in the references page. Please mention the author when you copy something from the presentation. Also, if you notice any information that might be wrong please contact me via my e-mail. Thank you !
  • 3.
    Definition A hydrocarbon indicator(HCI) or direct hydrocarbon indicator (DHI), is an anomalous seismic attribute value or pattern that could be explained by the presence of hydrocarbons in a oil or gas reservoir. DHIs are particularly useful in hydrocarbon exploration for reducing the geological risk of exploration wells. Broadly, geophysicists recognize several types of DHI: • Bright spots: localized amplitudes of greater magnitude than background amplitude values.. • Flat spots: nearly horizontal reflectors that cross existing stratigraphy, possibly indicating a hydrocarbon fluid level (contact) within an oil or gas reservoir. • Dim spots: low amplitude anomalies. • Polarity reversals can occur where the capping rock has a slightly lower seismic velocity than the reservoir and the reflection has its sign reversed. Note that: Some geoscientists regard amplitude versus offset anomalies as a type of direct hydrocarbon indicator. For example, the amplitude of a reflection might increase with the angle of incidence, a possible indicator of natural gas.
  • 4.
    Bright spot • Highamplitude that can indicate the presence of hydrocarbons. Bright spots result from large changes in acoustic impedance and tuning effect, such as when a gas sand underlies a shale. • Not all the bright spots are due to exist of hydrocarbons. They can be caused by sills of igneous rocks or lithological contrast.
  • 5.
  • 6.
    Dim spot • Atype of local seismic event that, in contrast to a bright spot, shows weak rather than strong amplitude.The weak amplitude might correlate with hydrocarbons that reduce the contrast in acoustic impedance between the reservoir and the overlying rock, or might be related to a stratigraphic change that reduces acoustic impedance. • For a dim spot to occur, the shale has to have a lower acoustic impedance than both the water sand and the oil/gas sand, which is the opposite situation required for a bright spot to occur. • This is possible because compaction causes the acoustic impedances of sands and shales to increase with age and depth but it does not happen uniformly – younger shales have a higher acoustic impedance than younger sands, but this reverses at depth, with older shales having a lower acoustic impedance than older sands.
  • 7.
    Flat spot • Aflat spot is a seismic attribute anomaly that appears as a horizontal reflector cutting across the stratigraphy elsewhere present on the seismic image. Its appearance can indicate the presence of hydrocarbons.Therefore, it is known as a direct hydrocarbon indicator and is used by geophysicists in hydrocarbon exploration. • A flat spot can result from the increase in acoustic impedance when a gas-filled porous rock (with a lower acoustic impedance) overlies a liquid-filled porous rock (with a higher acoustic impedance). It may stand out on a seismic image because it is flat and will contrast with surrounding dipping reflections. • There are a number of other possible reasons for there being a flat spot on a seismic image. It could be representative of a mineralogical change in the subsurface or an unresolved shallower multiple. Additionally, the interpretation of a flat spot should be attempted after depth conversion to confirm that the anomaly is actually flat.
  • 8.
  • 9.
    Polarity reversal • polarityreversal or phase change is a local amplitude seismic attribute anomaly that can indicate the presence of hydrocarbons and is therefore known as a direct hydrocarbon indicator. It primarily results from the change in polarity of the seismic response when a shale (with a lower acoustic impedance) overlies a brine-saturated zone (with a high acoustic impedance), that becomes invaded with an oil/gas sand (with the lowest acoustic impedance of the three).This changes the acoustic impedance contrast from an increase to a decrease, resulting in the polarity of the seismic response being reversed. • For a polarity reversal to occur, the shale has to have a lower acoustic impedance than the water sand and both are required to have a higher acoustic impedance than the oil/gas sand.
  • 10.
    Polarity reversal • Example: Reversalof polarity associated with bright spots caused by gas in the unconsolidated sand of the Gulf of Mexico.
  • 11.
    Polarity reversal • Phasechange (polarity reversal) caused by gas on the Northwest Shelf of Australia. Data are zero phase American polarity. (CourtesyWest Australian Petroleum Pty. Ltd.)
  • 12.
    DHI validation 1. Arethe reflections of our reservoirs visible anomalies in their amplitudes? 2. Does high amplitudes have hydrocarbon characters as expected? 3. Is the amplitude anomaly consistently structural? 4. Is there a reflection from the top reservoir and one reflection from the base reservoir? 5. Is the reflection of the top and the base showing in pairs, dimming at the same spot on the edge of the reservoir? 6. Is the amplitude anomaly relatively large against the background? 7. Is the seismic data of zero phase or polarity known? 8. Does a flat spot look and vary by itself? 9. Does the flat spot appear flat or oblique consistent with gas velocity sag (push down) or tuning? 10. Is the flat spot not in harmony with the structure but consistent? 11. Does the flat spot have the correct zero-phase character? 12. Is the flat spot located on the downdip boundary of the anomaly? 13. Is there a phase change (polarity reversal)? 14. Is the phase change consistently structured and at the same level as the flat spot? 15. Are bright spots, dim spots, or phase changes showing the right zero-phase character? 16. Is there a widening reflection of the reservoir or a low-frequency shadow visible below the reservoir? 17. Is the reservoir thick, is there a significant reflection in it? 18. Does the AVO study produce further validation proof? 19. Does the shear wave or converted wave data provide further validation proof? 20. Does crossplot technique statistically indicate a flat spot? 21. Is there an anomaly in the moveout- derived interval velocity? we ask the following questions models in order to validate DHI if we encounter on seismic data:
  • 13.
    DHI index • DHIindex used in risk assessment study for potential prospects in the area and then plotted together for better analysis: Calculation method: DHI index= (Bright spot score + push down score + low frequency zone score + flat spot score)/4 Seismic DHI Index (Prospect 1) Bright spot Flat spot (GWC) Push down Low frequency zone DHI index Yes No Yes No 50 Bright Spot Yes No Not clear 100 0 50 Flat Spot (GWC) Yes No Not clear 100 0 50 Push down Yes No Not clear 100 0 50 Low frequency zone Yes No Not clear 100 0 50 Example: 50 88 100 100 100 75 50 50 50 PROSPECTS DHIIndex Prospect #1 Prospect #2 Prospect #3 Prospect #4 Prospect #5 Prospect #6 Prospect #7 Prospect #8 Prospect #9
  • 14.
    Velocity Push downanalysis Push down (velocity sag) due to gas accumulation Velocity Anomaly - pull down V1 < V2
  • 15.
  • 16.
    References• Seismic Amplitude,An Interpreter’s Handbook: Rob Simm & Mike Bacon. • Schlumberger oilfield Glossary. • Interpretation ofThree-Dimensional Seismic Data:Alistair R. Brown • M. Bacon; R. Simm;T. Redshaw (2007). 3-D Seismic Interpretation.Cambridge:Cambridge University Press. • Brown,Alistar. R., (2010), “Dim Spots in Seismic Images as Hydrocarbon Indicators”,AAPG Search and DiscoveryArticle #40514 • Hilterman, Fred J. (2001). Seismic amplitude interpretation: 2001 distinguished instructor short course. Houston,TX: SEG. • Direct Hydrocarbon Indicator (DHI): Seismic Interpreter website ( https://seismicinterpreter.wordpress.com/ ) • RICHARD J. DAVIES JOSEPH A.CARTWRIGHT SIMON A. STEWART MARK LAPPIN and JOHN R. UNDERHILL : 3D SeismicTechnology:Application to the Exploration of Sedimentary Basins. • Interpretation ofThree-Dimensional Seismic Data- Sixth Edition By Alistair R. Brown. Thanks !
  • 17.