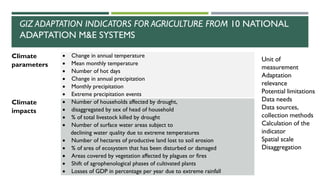
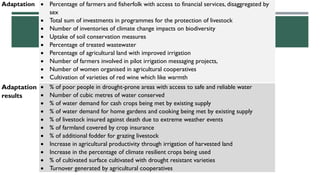
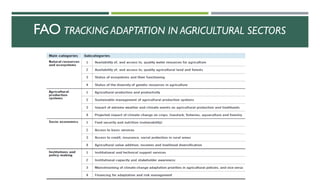
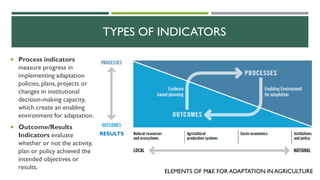
This document discusses metrics for tracking adaptation in agriculture under the Koronivia Joint Work on Agriculture. It outlines several elements of monitoring and evaluation systems for adaptation in agriculture sectors, including process and outcome indicators. Process indicators measure progress implementing adaptation policies and plans, while outcome indicators evaluate whether objectives were achieved. The document also provides examples of adaptation indicators used in 10 national monitoring and evaluation systems, focusing on climate impacts, adaptation actions, and adaptation results in agriculture.

![GLOBAL CONTEXT FOR TRACKING ADAPTATION
Most countries emphasize the importance of monitoring and evaluating the impact of their
proposed strategies. Where countries plan to introduce M&E for specific regions or
sectors, they often express the intention to scale these measures up to the national level in
the long run. (FAO 2016.The agriculture sectors in the INDCs, Rome).
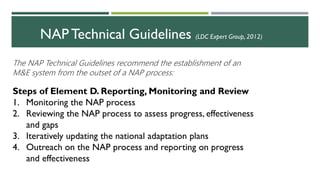
“each Party shall, as appropriate, engage in adaptation planning processes and the implementation of
actions, including the development or enhancement of relevant plans, policies and/or contributions, which
may include […], (d) monitoring and evaluating and learning from adaptation plans, policies,
programmes and actions” (Decision 1/CP.21.Art.7.9.)
In countries’ Nationally Determined Contributions (NDCs):
In the Paris Agreement:](https://image.slidesharecdn.com/napexpotem-akoroniviametricstheresawong-190423122636/85/9-2-4-Regional-TEM-A-Part-III-9-320.jpg)