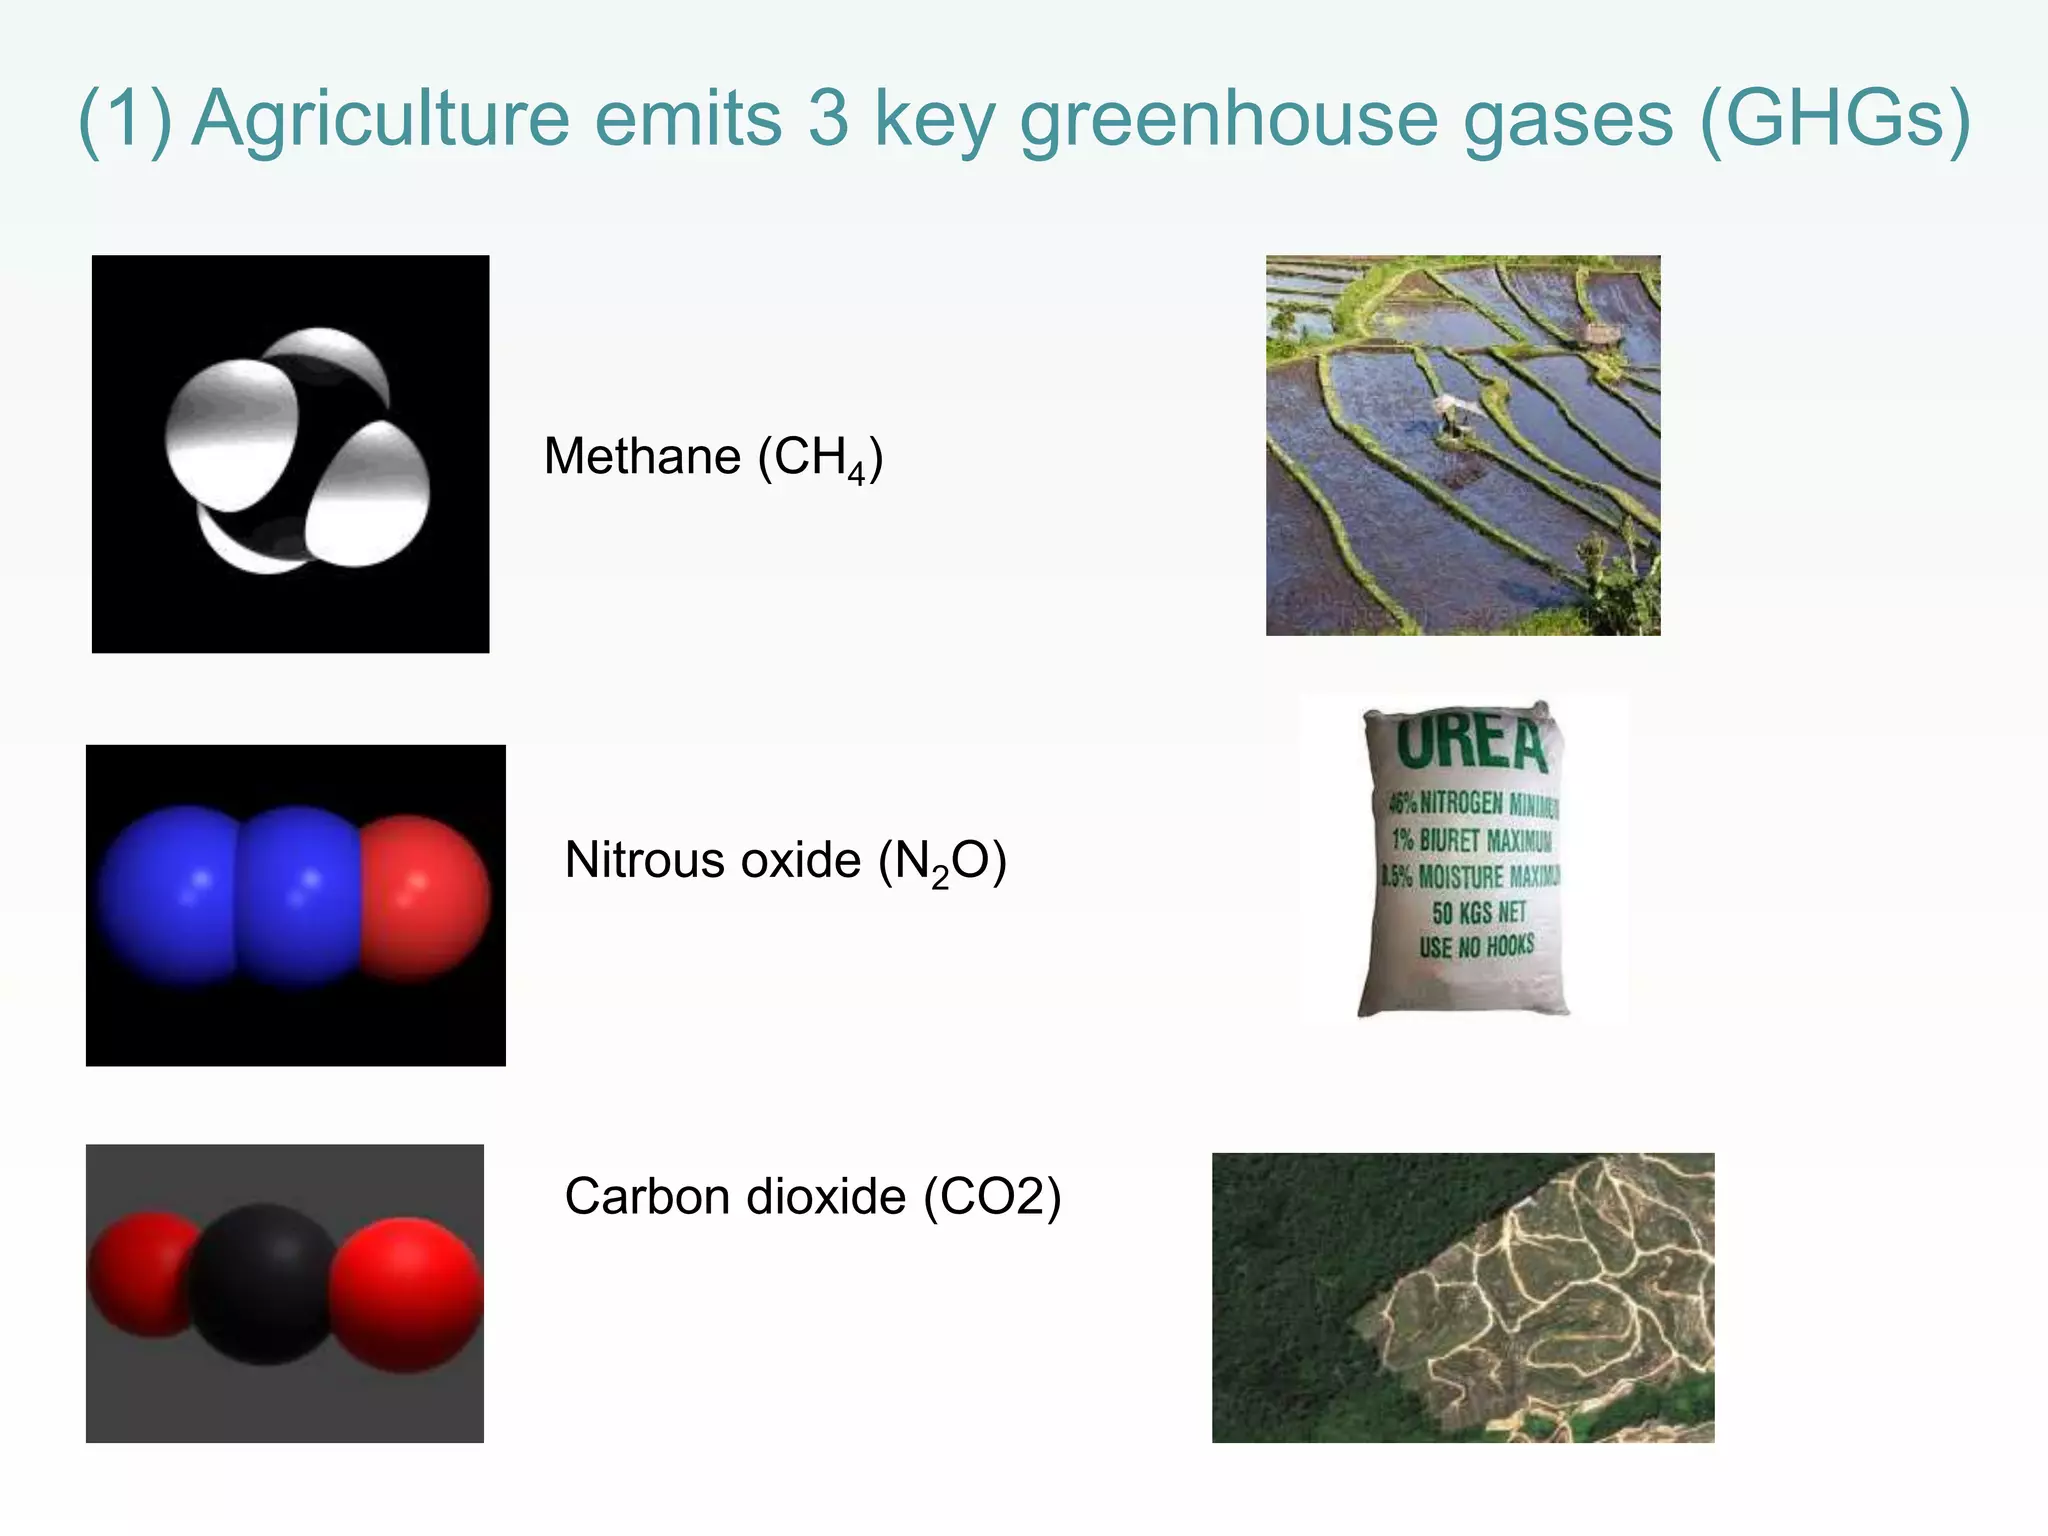
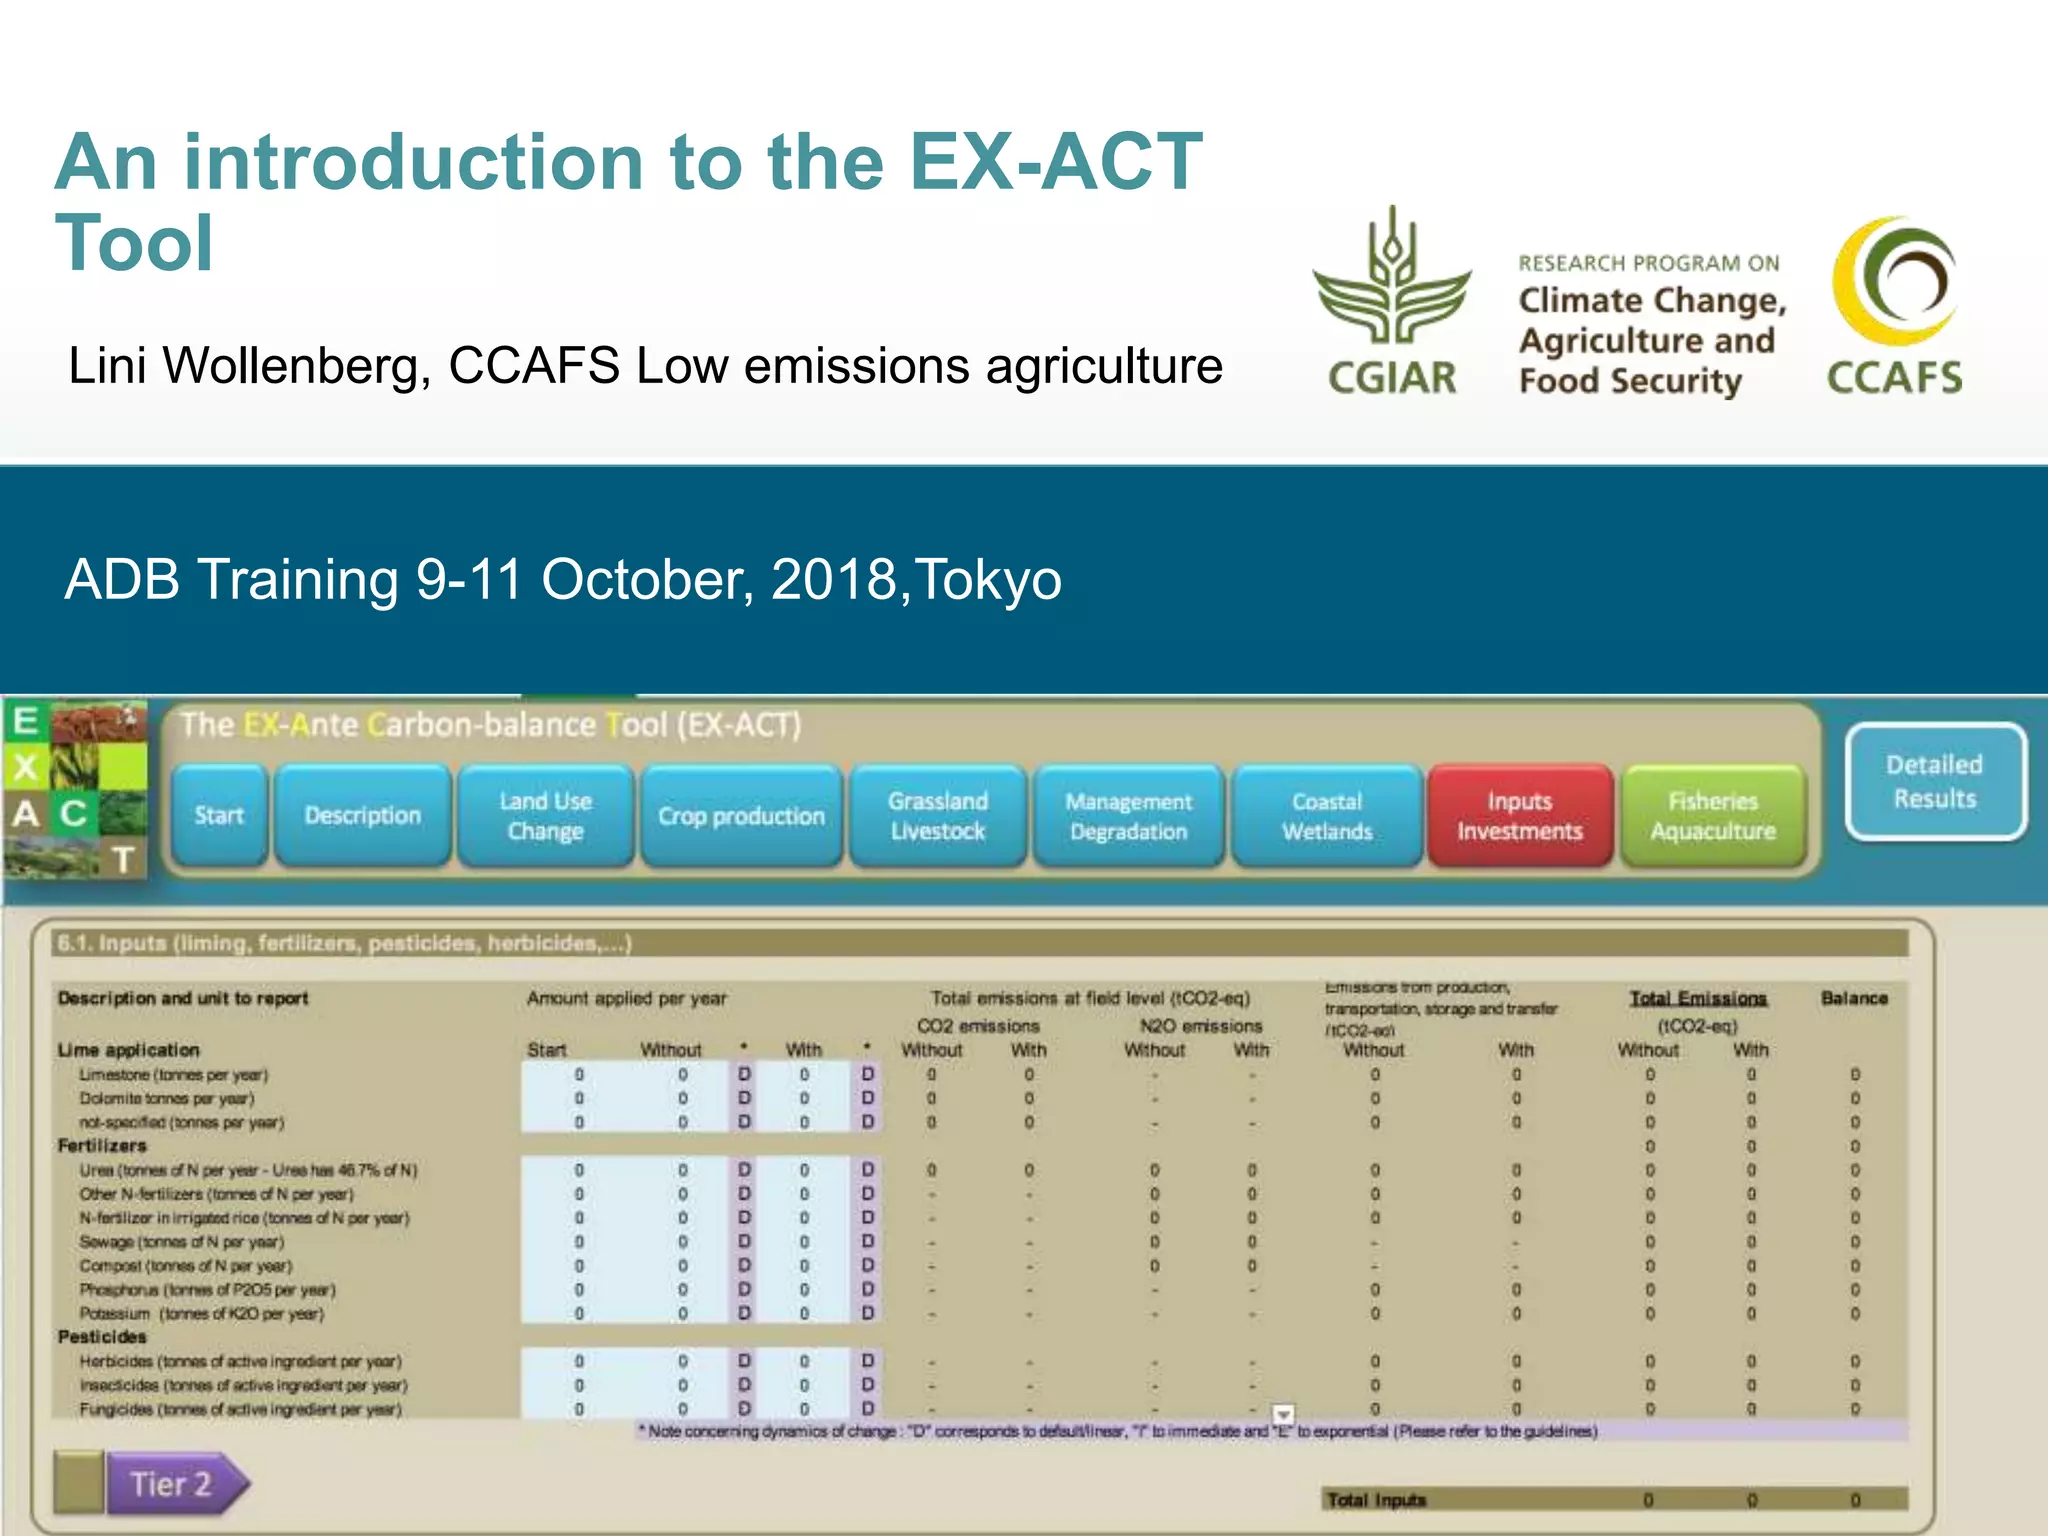
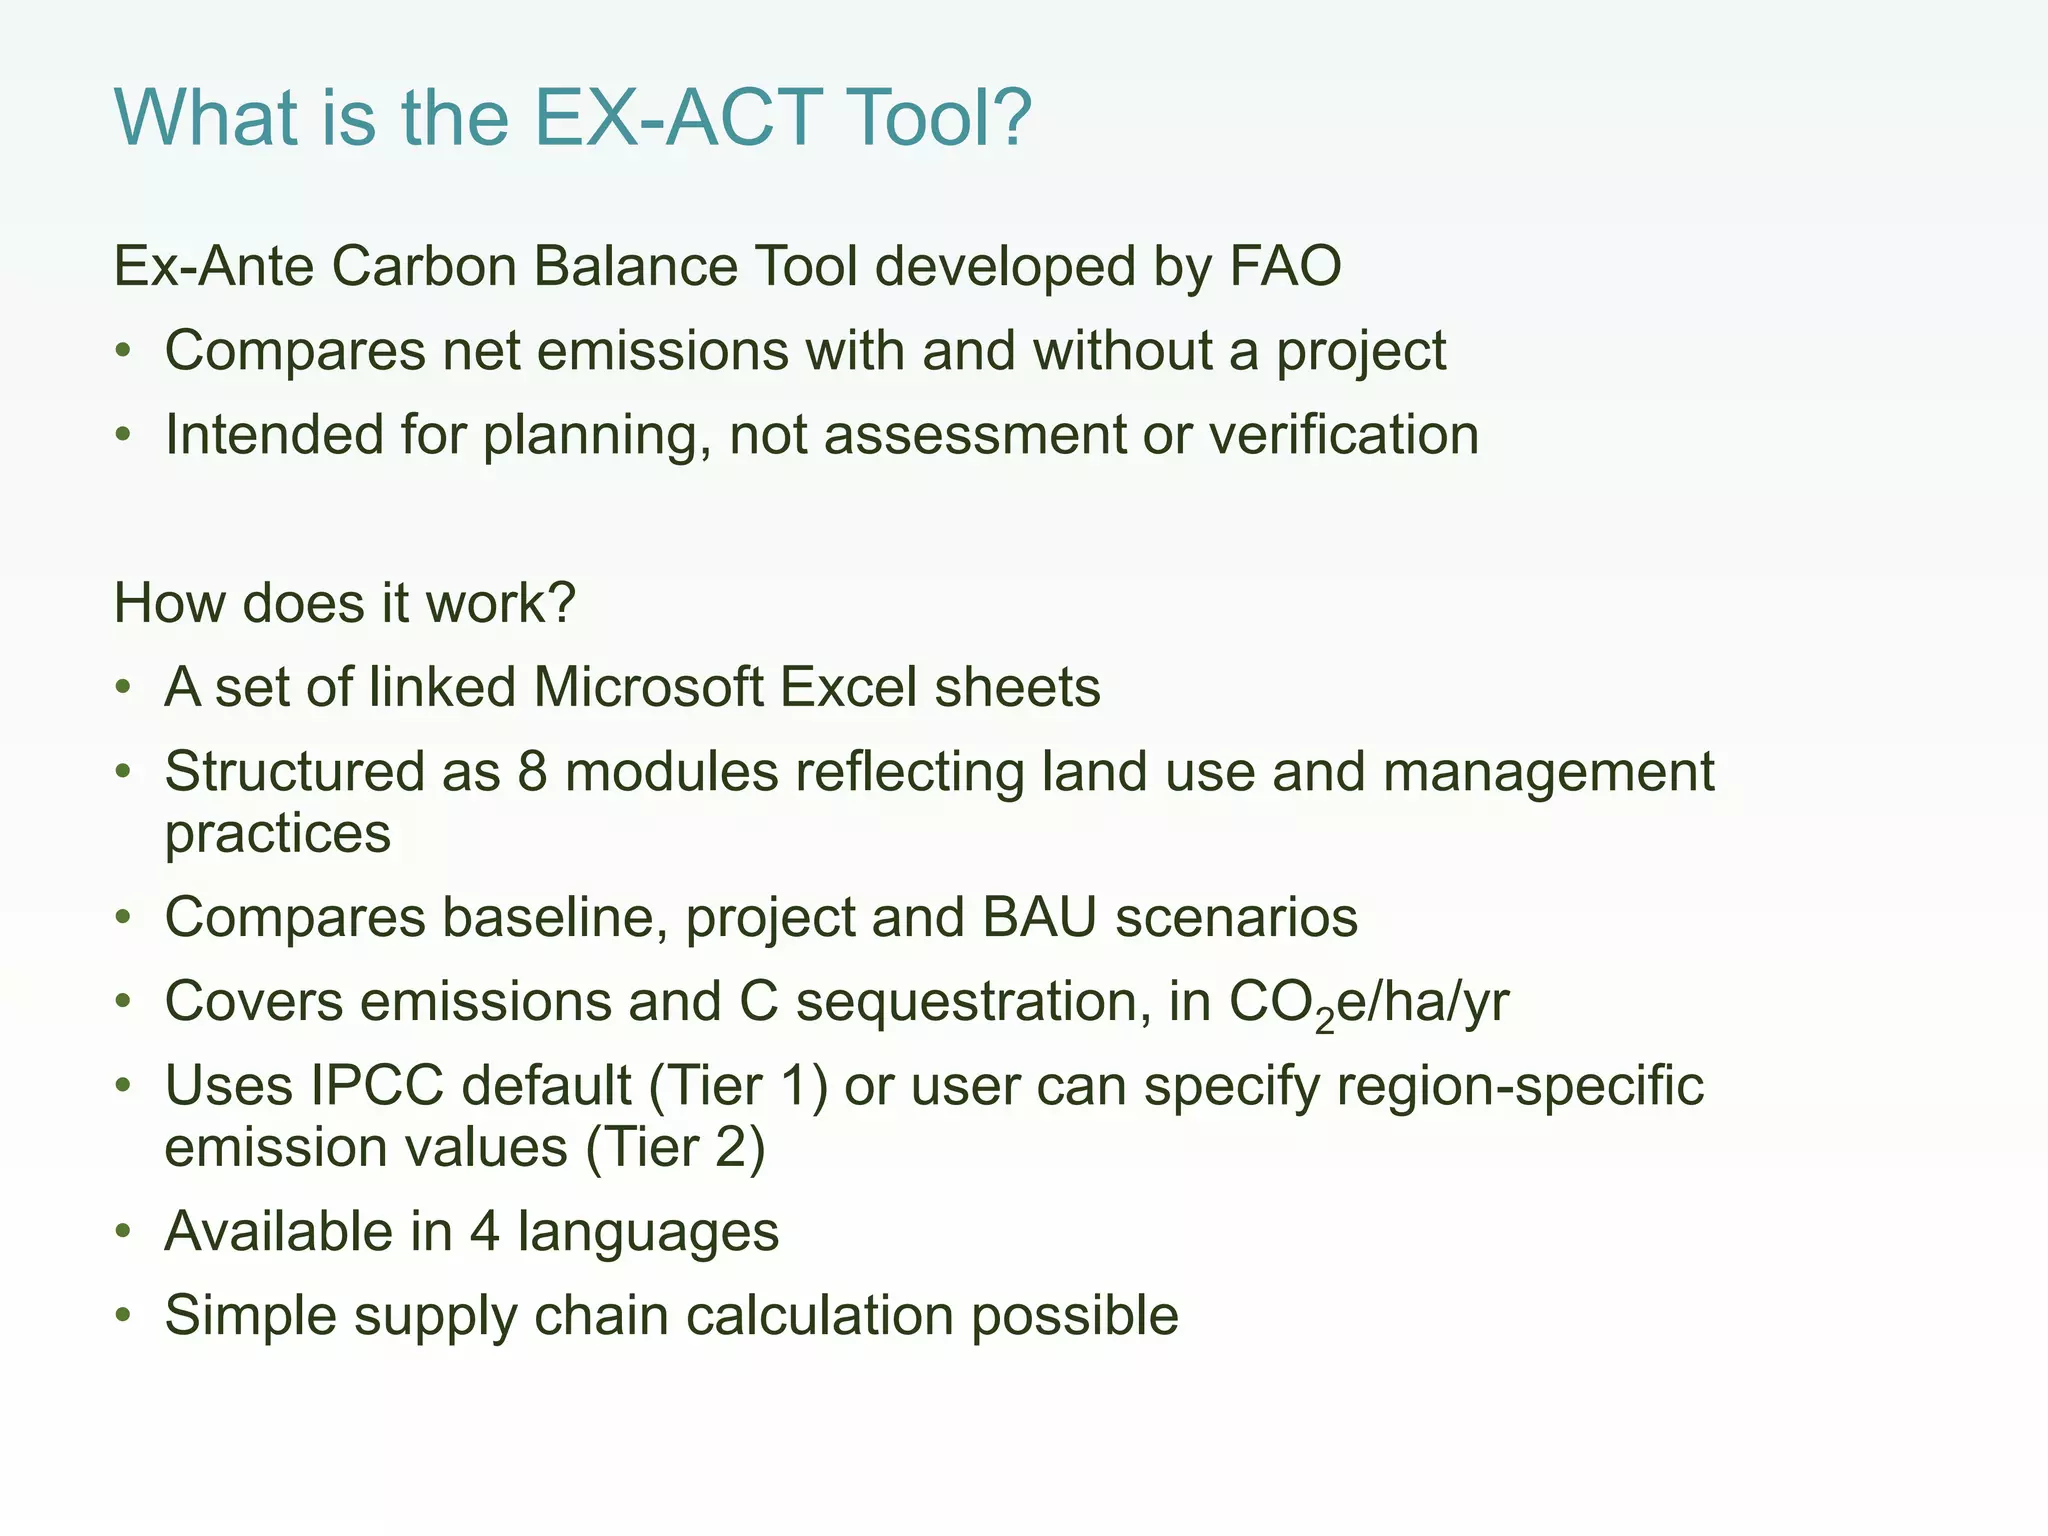
The document provides an overview of options for greenhouse gas mitigation in agriculture. It discusses:
1) Agriculture contributes significantly to global emissions and reductions are necessary to meet climate targets. Many mitigation practices are compatible with sustainable development goals.
2) Key greenhouse gases from agriculture include methane, nitrous oxide, and carbon dioxide. Soils can also store carbon.
3) Common mitigation practices discussed include alternate wetting and drying of rice fields, livestock management improvements, efficient fertilizer use, agroforestry, and reducing food loss and waste.
4) The EX-ACT tool is introduced as a way to estimate and compare emissions between baseline and project scenarios to identify mitigation opportunities in agriculture
At the Africa Agriculture Science Week AASW 15-20 July, the CGIAR Research Program on Climate Change, Agriculture and Food Security (CCAFS), Head of Research Sonja Vermeulen gave a presentation on Climate-Smart Agriculture for an African context.
How to achieve climate-smart agriculture and the potential triple-win that can be achieved from these practices such as adaptation, mitigation and increasing livelihoods.
How does agriculture, especially animal agriculture, impact greenhouse gas emissions? What is adaptation and mitigation and how are these different? For more materials on this topic visit http://www.extension.org/pages/63908/greenhouse-gases-and-animal-agriculture
Climate change and Agriculture: Impact Aadaptation and MitigationPragyaNaithani
Climate change refers to a statistically significant variation in either the mean state of the climate or in its Variability, persisting for an extended period (typically decades or longer). For the past some decades, the gaseous composition of earth’s atmosphere is undergoing a significant change, largely through increased emissions from energy, industry and agriculture sectors; widespread deforestation as well as fast changes in land use and land management practices. These anthropogenic activities are resulting in an increased emission of radiatively active gases, viz. carbon dioxide (CO2), methane (CH4) and nitrous oxide (N2O), popularly known as the ‘greenhouse gases’ (GHGs)
These GHGs trap the outgoing infrared radiations from the earth’s surface and thus raise the temperature of the atmosphere. The global mean annual temperature at the end of the 20th century, as a result of GHG accumulation in the atmosphere, has increased by 0.4–0.7 ºC above that recorded at the end of the 19th century. The past 50 years have shown an increasing trend in temperature @ 0.13 °C/decade, while the rise in temperature during the past one and half decades has been much higher. The Inter-Governmental Panel on Climate Change has projected the temperature increase to be between 1.1 °C and 6.4 °C by the end of the 21st Century (IPCC, 2007). The global warming is expected to lead to other regional and global changes in the climate-related parameters such as rainfall, soil moisture, and sea level. Snow cover is also reported to be gradually decreasing.
Therefore, concerted efforts are required for mitigation and adaptation to reduce the vulnerability of agriculture to the adverse impacts of climate change and making it more resilient.
The adaptive capacity of poor farmers is limited because of subsistence agriculture and low level of formal education. Therefore, simple, economically viable and culturally acceptable adaptation strategies have to be developed and implemented. Furthermore, the transfer of knowledge as well as access to social, economic, institutional, and technical resources need to be provided and integrated within the existing resources of farmers.
Agriculture in developing countries must undergo a significant transformation in order to meet the related challenges of achieving food security and responding to climate change. Projections based on population growth and food consumption patterns indicate that agricultural production will need to increase by at least 70 percent to meet demands by 2050. Most estimates also indicate that climate change is likely to reduce agricultural productivity, production stability and incomes in some areas that already have high levels of food insecurity. Developing climate-smart agriculture is thus crucial to achieving future food security and climate change goals. This seminar describe an approach to deal with the above issue viz. Climate Smart Agriculture (CSA) and also examines some of the key technical, institutional, policy and financial responses required to achieve this transformation. Building on cases from the field, the seminar try to outlines a range of practices, approaches and tools aimed at increase the resilience and productivity of agricultural product systems, while also reducing and removing emissions. A part of the seminar elaborates institutional and policy options available to promote the transition to climate-smart agriculture at the smallholder level. Finally, the paper considers current gaps and makes innovative suggestion regarding the combined use of different sources, financing mechanism and delivery systems.
Presentation by Stefan Frank, International Institute for Applied Systems Analysis (IIASA)
International conference on agricultural emissions and food security: Connecting research to policy and practice
10-13 September 2018
Berlin, Germany
Benefits of Soil Organic Carbon - an overviewExternalEvents
The presentation was given by Mr. Niels H. Batjes, ISRIC, during the GSOC Mapping Global Training hosted by ISRIC - World Soil Information, 6 - 23 June 2017, Wageningen (The Netherlands).
Agriculture has been and continues to be the most important sector in Indian economy. Climate change is one of the most important environmental issues facing the world today. The impact of climate change is a reality and it cuts across all climates sensitive sectors including the Agriculture sector. In this situation this seminar focuses on the climate smart agriculture. CSA brings together practices, policies and institutions that are not necessarily new but are used in the context of climatic changes which is prime requirement in arena of climate change. Farmers possessed low level of knowledge regarding climate change, and they adopted traditional methods to mitigate the impact of climate change. Small land holdings, poor extension services and non availability of stress tolerant verities were the major problems faced by the farmers in adoption to climate change. Extension functionaries were having medium level awareness about impact of climate change on agriculture. They used electronic media, training and conferences and seminars as major sources of information for climate change. They need training on climate smart agriculture aspects. Based on the above facts this presentation focuses on analyzing the opportunities and challenges of climate smart agriculture.
A presentation written by Miguel Altieri, Professor of Agroecology at the University of California, Berkeley in the Department of Environmental Science, Policy and Management, with the participation of Angela Hilmi. You can choose to download the short or the long version; both of them are in Power Point format and available in English, French, Spanish and Portuguese download at ag-transition.org
www.fao.org/climatechange/epic
This presentation was prepared to provide a general overview of Climate-Smart Agriculture (CSA) and the EPIC programme. After providing a definition of CSA, the presentation focuses on Sustainable Land Management and the role of climate finance to support CSA. It concludes with a description of the FAO-EC project on CSA.
Forests and Climate Change: Linking Adaptation and MitigationCIFOR-ICRAF
There are two approaches to combating climate change, adaptation and mitigation, and forests can contribute to both. Too often these two approaches are treated as separate strategies. In this presentation, titled “Forests and Climate Change: Linking Adaptation and Mitigation”, CIFOR and CIRAD scientist Bruno Locatelli explains the possible synergies between adaptation to and mitigation of climate change.
http://www.fao.org/agroecology/en/ | Presentation by Parviz Koohafkan of the World Agricultural Heritage Foundation regarding the development of sustainable food systems. The presentation was delivered on January 31, 2017 at the CGRFA Side Event Biodiversity and Agroecology: The Agroecology Knowledge Hub.
"Rethinking Agriculture for the 21st Century: Climate change mitigation opportunities and challenges" was presented by Lini Wollenberg online at the KfW Webinar on May 28, 2020.
Increasing the storage of carbon in the soil has been a controversial strategy for addressing climate change mitigation. What is the potential and why is there debate about this? How can we push beyond the debate to constructive action?
Lini Wollenberg, a Gund Fellow, is an anthropologist and natural resource management specialist concerned with rural livelihoods and the environment. She currently leads a research program on Low Emissions Agricultural Development for the CGIAR Research Program on Climate Change, Agriculture and Food Security (CCAFS), based at the University of Vermont. Her work seeks to identify options for reducing the impacts of agricultural development and land use on the climate, while also improving livelihoods for the poor in developing countries.
This presentation was given by Lini Wollenberg, CCAFS, on September 11, 2020 as part of the GundxChange Series.
"Challenges, opportunities and priorities for transitioning to low emissions agriculture" was presented by Lini Wollenberg at a NUI Galway seminar on January 30, 2020.
Presentation at Reducing the costs of GHG estimates in agriculture to inform low emissions development
10-12 November 2014
Sponsored by the CGIAR Research Program on Climate Change, Agriculture and Food Security (CCAFS) and the Food and Agriculture Organization of the United Nations (FAO)
Presentation at workshop: Reducing the costs of GHG estimates in agriculture to inform low emissions development
November 10-12, 2014
Sponsored by the CGIAR Research Program on Climate Change, Agriculture and Food Security (CCAFS) and the Food and Agriculture Organization of the United Nations (FAO)
Resource conservation, tools for screening climate smart practices and public...Prabhakar SVRK
Natural resources continue to play an important role in livelihood and wellbeing of millions. Over exploitation and degradation of natural resource base have led to declining factor productivity in rural areas and dwindling farm profits coupled with debilitating impact on human health. This necessitates promoting technologies that can help producing food keeping pace with the growing population while conserving natural resource base and be profitable. Achieving this conflicting target though appears to be challenging but is possible with the currently available technologies. This lecture will provide insights into a gamut of resource conserving technologies, the role of communities in promoting them and tools that can help in identifying suitable technologies for adoption. The lecture will heavily borrow sustainable agriculture cases from the Asia Pacific region.
Outline
• Natural resource dependency and rural development
o Trends in resource depletion and impact on food production
o Farm profitability trends and input use
o Trends in factor productivity
• Resource conserving technologies and climate smart agriculture
o What are they?
o Similarities and differences
o Costs and benefits of pursuing them
• Tools for identifying resource conserving and climate smart agriculture technologies
o Factor productivity
o Benefit cost ratios
o Marginal abatement costs
• Role of communities
o Communities as entry point
o Benefits of community participation
• Concluding thoughts
o How to scale up resource conservation?
Side event at SBSTA48 on May 8 2018 in Bonn.
Theme: Countries require sub-national projects to fulfil NDC commitments, but project accounting, often driven by donors or investors, rarely links to national accounting systems for mitigation and other benefits. Livestock projects in Latin America may reveal how to connect NAMAs and national MRV systems.
More about the event is available at: https://ccafs.cgiar.org/bonn-climate-change-conference-2018-improving-transparency-linking-mrv-and-finance-livestock-namas#.WvK3SC-B2LI
Presenters: Hayden Montgomery (GRA), Meryl Richards (CCAFS), Joao Lampreia (Carbon Trust Brazil), Ericka Lucero (Ministry of Environment, Guatemala), Walter Oyhantcabal (Ministry of Agriculture, Uruguay).
Facilitators: Lini Wollenberg (CCAFS), Martial Bernoux (FAO)
Keynote presentation by Dr Reiner Wassmann, International Rice Research Institute (IRRI) at CCAFS webinar 'Exploring GHG mitigation potential in rice production' on 18 September 2014.
Presentation at the Low Emissions Livestock: Supporting Policy Making and Implementation through Science in East Africa regional awareness raising workshop held at the UN Economic Commission for Africa (UNECA) in Addis Ababa, Ethiopia between 2 and 4 July 2018.
Policies and finance to scale-up Climate-Smart Livestock SystemsILRI
Presented by William Sutton, Pierre Gerber, Leah Germer, Félix Teillard, Clark Halpern, Benjamin Henderson, Michael Mcleod and Lee Cando at the Programme for Climate-Smart Livestock systems Closing Event, 13 September 2022
Mitigation Opportunities in AgricultureCIFOR-ICRAF
This presentation by Dr. Charlotte Schreck from CLIMATEFOCUS explains how agriculture is part of many agendas, what technical mitigation opportunities we have, what the costs are and how CLUA could be mitigated.
Similar to Options for Mitigation in Agriculture (20)
The Accelerating Impact of CGIAR Climate Research for Africa (AICCRA) project works to deliver a climate-smart African future driven by science and innovation in agriculture.
AICCRA does this by enhancing access to climate information services and climate-smart agricultural technology to millions of smallholder farmers in Africa.
With better access to climate technology and advisory services—linked to information about effective response measures—farmers can better anticipate climate-related events and take preventative action that help communities better safeguard their livelihoods and the environment.
AICCRA is supported by a grant from the International Development Association (IDA) of the World Bank, which is used to enhance research and capacity-building activities by the CGIAR centers and initiatives as well as their partners in Africa.
About IDA: IDA helps the world’s poorest countries by providing grants and low to zero-interest loans for projects and programmes that boost economic growth, reduce poverty, and improve poor people’s lives.
IDA is one of the largest sources of assistance for the world’s 76 poorest countries, 39 of which are in Africa.
Annual IDA commitments have averaged about $21 billion over circa 2017-2020, with approximately 61 percent going to Africa.
This presentation was given on 27 October 2021 by Mengpin Ge, Global Climate Program Associate at WRI, during the webinar "Achieving NDC Ambition in Agriculture" organized by CCAFS, FAO and WRI.
Find the recording and more information here: https://bit.ly/AchievingNDCs
This presentation was given on 27 October 2021 by Sabrina Rose, Policy Consultant at CCAFS, during the webinar "Achieving NDC Ambition in Agriculture" organized by CCAFS, FAO and WRI.
Find the recording and more information here: https://bit.ly/AchievingNDCs
This presentation was given on 27 October 2021 by Krystal Crumpler, Climate Change and Agricultural Specialist at FAO, during the webinar "Achieving NDC Ambition in Agriculture" organized by CCAFS, FAO and WRI.
Find the recording and more information here: https://bit.ly/AchievingNDCs
This presentation was meant to be included in the 2021 CLIFF-GRADS Welcome Webinar and presented by Ciniro Costa Jr. (CCAFS).
The webinar recording can be found here: https://youtu.be/UoX6aoC4fhQ
The multilevel CSA monitoring set of standard core uptake and outcome indicators + expanded indicators linked to a rapid and reliable ICT based data collection instrument to systematically
assess and monitor:
- CSA Adoption/ Access to CIS
- CSA effects on food security and livelihoods household level)
- CSA effects on farm performance
Presented by Harsh Rajpal, Code Partners Pte. Ltd., on 30 June 2021 at the Asian Development Bank (ADB) Webinar on Sustainable Protein Case Study: Outputs and Synthesis of Results.
Presented by Ciniro Costa Jr., CCAFS, on 28 June 2021 at the Asian Development Bank (ADB) Webinar on Sustainable Protein Case Study: Outputs and Synthesis of Results.
Presented by Marion de Vries, Wageningen Livestock Research at Wageningen University, on 28 June 2021 at the Asian Development Bank (ADB) Webinar on Sustainable Protein Case Study: Outputs and Synthesis of Results.
Presented by Issac Emery, Informed Sustainability Consulting, on 29 June 2021 at the second day of the Asian Development Bank (ADB) Webinar on Sustainable Protein Case Study: Outputs and Synthesis of Results.
Presented by Hongmin Dong and Sha Wei, Chinese Academy of Agricultural Sciences (CAAS), on 28 June 2021 at the Asian Development Bank (ADB) Webinar on Sustainable Protein Case Study: Outputs and Synthesis of Results.
Presented by Lini Wollenberg, CCAFS, on 28 June 2021 at the Asian Development Bank (ADB) Webinar on Sustainable Protein Case Study: Outputs and Synthesis of Results.
Presentation by Han Soethoudt, Jan Broeze, and Heike Axmann of Wageningen University & Resaearch (WUR).
WUR and Olam Rice Nigeria conducted a controlled experiment in Nigeria in which mechanized rice harvesting and threshing were introduced on smallholder farms. The result of the study shows that mechanization considerably reduces losses, has a positive impact on farmers’ income, and the climate.
Learn more: https://www.wur.nl/en/news-wur/show-day/Mechanization-helps-Nigerian-farms-reduce-food-loss-and-increase-income.htm
Presentation on the rapid evidence review findings and key take away messages.
Current evidence for biodiversity and agriculture to achieve and bridging gaps in research and investment to reach multiple global goals.
This presentation was given at an internal workshop in April 2020 and was presented by Le Hoang Anh, Hoang Thi Thien Huong, Le Thi Thanh Huyen, and Nguyen Thi Lien Huong.
Nutraceutical market, scope and growth: Herbal drug technologyLokesh Patil
As consumer awareness of health and wellness rises, the nutraceutical market—which includes goods like functional meals, drinks, and dietary supplements that provide health advantages beyond basic nutrition—is growing significantly. As healthcare expenses rise, the population ages, and people want natural and preventative health solutions more and more, this industry is increasing quickly. Further driving market expansion are product formulation innovations and the use of cutting-edge technology for customized nutrition. With its worldwide reach, the nutraceutical industry is expected to keep growing and provide significant chances for research and investment in a number of categories, including vitamins, minerals, probiotics, and herbal supplements.
A brief information about the SCOP protein database used in bioinformatics.
The Structural Classification of Proteins (SCOP) database is a comprehensive and authoritative resource for the structural and evolutionary relationships of proteins. It provides a detailed and curated classification of protein structures, grouping them into families, superfamilies, and folds based on their structural and sequence similarities.
The increased availability of biomedical data, particularly in the public domain, offers the opportunity to better understand human health and to develop effective therapeutics for a wide range of unmet medical needs. However, data scientists remain stymied by the fact that data remain hard to find and to productively reuse because data and their metadata i) are wholly inaccessible, ii) are in non-standard or incompatible representations, iii) do not conform to community standards, and iv) have unclear or highly restricted terms and conditions that preclude legitimate reuse. These limitations require a rethink on data can be made machine and AI-ready - the key motivation behind the FAIR Guiding Principles. Concurrently, while recent efforts have explored the use of deep learning to fuse disparate data into predictive models for a wide range of biomedical applications, these models often fail even when the correct answer is already known, and fail to explain individual predictions in terms that data scientists can appreciate. These limitations suggest that new methods to produce practical artificial intelligence are still needed.
In this talk, I will discuss our work in (1) building an integrative knowledge infrastructure to prepare FAIR and "AI-ready" data and services along with (2) neurosymbolic AI methods to improve the quality of predictions and to generate plausible explanations. Attention is given to standards, platforms, and methods to wrangle knowledge into simple, but effective semantic and latent representations, and to make these available into standards-compliant and discoverable interfaces that can be used in model building, validation, and explanation. Our work, and those of others in the field, creates a baseline for building trustworthy and easy to deploy AI models in biomedicine.
Bio
Dr. Michel Dumontier is the Distinguished Professor of Data Science at Maastricht University, founder and executive director of the Institute of Data Science, and co-founder of the FAIR (Findable, Accessible, Interoperable and Reusable) data principles. His research explores socio-technological approaches for responsible discovery science, which includes collaborative multi-modal knowledge graphs, privacy-preserving distributed data mining, and AI methods for drug discovery and personalized medicine. His work is supported through the Dutch National Research Agenda, the Netherlands Organisation for Scientific Research, Horizon Europe, the European Open Science Cloud, the US National Institutes of Health, and a Marie-Curie Innovative Training Network. He is the editor-in-chief for the journal Data Science and is internationally recognized for his contributions in bioinformatics, biomedical informatics, and semantic technologies including ontologies and linked data.
Multi-source connectivity as the driver of solar wind variability in the heli...Sérgio Sacani
The ambient solar wind that flls the heliosphere originates from multiple
sources in the solar corona and is highly structured. It is often described
as high-speed, relatively homogeneous, plasma streams from coronal
holes and slow-speed, highly variable, streams whose source regions are
under debate. A key goal of ESA/NASA’s Solar Orbiter mission is to identify
solar wind sources and understand what drives the complexity seen in the
heliosphere. By combining magnetic feld modelling and spectroscopic
techniques with high-resolution observations and measurements, we show
that the solar wind variability detected in situ by Solar Orbiter in March
2022 is driven by spatio-temporal changes in the magnetic connectivity to
multiple sources in the solar atmosphere. The magnetic feld footpoints
connected to the spacecraft moved from the boundaries of a coronal hole
to one active region (12961) and then across to another region (12957). This
is refected in the in situ measurements, which show the transition from fast
to highly Alfvénic then to slow solar wind that is disrupted by the arrival of
a coronal mass ejection. Our results describe solar wind variability at 0.5 au
but are applicable to near-Earth observatories.
Professional air quality monitoring systems provide immediate, on-site data for analysis, compliance, and decision-making.
Monitor common gases, weather parameters, particulates.
This pdf is about the Schizophrenia.
For more details visit on YouTube; @SELF-EXPLANATORY;
https://www.youtube.com/channel/UCAiarMZDNhe1A3Rnpr_WkzA/videos
Thanks...!
insect taxonomy importance systematics and classification
Options for Mitigation in Agriculture
1. ADB Training 9-11 October, 2018,Tokyo
Options for Mitigation in
Agriculture
Lini Wollenberg, CCAFS Low emissions agriculture
2. Why mitigation in agriculture?
1. Significant
• 10-12% of global emissions
• Agriculture contributes on
average 35% of developing
countries’ total emissions
2. Necessary
Reductions in other sectors will
not be enough to achieve 2 °C
and 1.5 °C targets
3. Possible
Many practices are compatible
with SDGs, hence the possibility
of “low emissions development”
Mercator Institute
Roe et al. 2017
4. And can store carbon in plants
and soil
Above-ground
and below-
ground biomass
Grassland
Soil organic
carbon
Organic carbon
5. Units: tons CO2equivalent/yr
One ton of carbon equals
3.67 tons of carbon dioxide
CO2e
Global warming
potential over 100
years
• CO2: 1
• CH4: 25x
• N2O: 298X
2) Global net CO2e is what matters to the climate
6. 3) Two key metrics for emissions
• CO2e per ha
• CO2e per kg
- “Emissions Intensity”
- “Yield-scaled emissions”
Used for adding up or comparing emissions
for a given area of land
Used to show the GHG efficiency of a food
product or supply chain.
Also called:
7. 4) Mitigation is a reduction in emissions
Reductions are measured relative to the previous land use or supply chain
emissions
The reference can be a base year or baseline. A baseline is a projection into
the future showing business-as-usual (BAU) emissions.
0
5
10
15
20
25
2015 2016 2017 2018 2019
BAU
emissions
Reduced
emissions
GHGemissionstCO2e
Reduction
in emissions
using
baseline =
15 tCO2e
Base
year Increase in emissions of 5 tCO2e
9. • Paddy rice - alternate wetting and drying (AWD)
• Livestock systems - improving feeding, animal and herd management;
pasture management
• Cereal crops- building soil organic matter, e.g. through integrated soil
fertility management; nutrient efficiency through technologies such as urea
deep placement; BNI in crops
• Perennial crops- transitioning from annual crops or degraded land to
agroforestry, forestry or grassland
Existing mitigation options in agriculture
• Avoided conversion of high carbon landscapes
(forests, peatlands, mangroves, grasslands)
• Reduced food loss and waste- storage, packaging,
waste recycling
• Supply chain energy use – fertilizer production, cooling,
transportation
• Dietary shifts- shift to low emissions food products, e.g.
beef to chicken
10. Water management in paddy rice:
Alternate wetting and drying
• Reduces CH4 emissions up to 38%. Also reduces fossil fuel use,
lodging and pests
• Issues: requires farmer control over irrigation, uneven incentives for
water-level management, increased weeding, N2O, difficult to verif
• IRRI information hub: ghgmitigation.irri.org/
11. • Livestock intensification
reduces emissions intensity up
to 20X for beef, 300X for dairy
• Improve digestibility of feed
• Reduce numbers of animals
0.00
50.00
100.00
150.00
200.00
250.00
300.00
350.00
400.00
450.00
7.50 8.50 9.50 10.50 11.50
methane-kgCO2/kgproteinproduced
metabolisable energy (MJ/kg DM)
developed
developing
BRICS
Pastoralist farmers in
Chad
Herrero et al. 2013, PNAS
Livestock intensification
US, EU
intensive
cattle
production
• Issues: absolute emissions
increase, cost of improved
feed, cultural barriers,
emissions from land use
change and feed production,
other environmental impacts
• Resource: Tackling Climate Change
through Livestock
www.fao.org/docrep/018/i3437e/i3437e00.htm
12. Efficient use of nitrogen fertilizer
• Increasing NUE from 19 to 75%, decreases
emissions intensity by 56% (12.7 to 7.1 g
N2O-N/kg N uptake)
• Increase efficiency of N fertilizer uptake by
plants, e.g. timing, rates, deep placement,
microdosing
• Issues: most smallholder farmers only use
small amounts of N, so absolute emissions
will increase.
• Resource: Site-specific nutrient management
https://ccafs.cgiar.org/publications/site-specific-nutrient-management-
implementation-guidance-policymakers-and-investors#.W7ZgSC-ZPEY
13. Soil carbon sequestration
• Agriculture is the major driver of soil carbon loss
• But soil C can be managed: e.g. reduced burning, legume
intercropping, agroforestry, compost, manure, deep-rooted plants.
• Issues: finite, reversible, ambitious potentials, competition for
biomass inputs, insufficient other nutrients, MRV costs and
detectable changes only after ~20 years.
14. Agroforestry
• Global review shows maximum carbon increases in
-Plant biomass in improved fallows: 11 tC/ha/yr
-Soil C in silvopastoral systems: 4 tC/ha/yr
• Issues: finite, reversible, can conflict with crops,
classification as forestry or agriculture,
trees on farms often not counted due to scale
Feliciano et al. 2018 https://doi.org/10.1016/j.agee.2017.11.032
15. Reduce food loss and waste in supply chains
Nash et al. 2017
• 10-20% reduction of
emissions based on
assessment of Feed the
Future projects in Asia
• Issues: Reduces emissions
intensity, but not necessarily
total emissions; lack of
available data
Product Country % Food loss and waste
Without
project
With
project Reduction
Dairy (cattle) Bangladesh 17 7 10
Maize Cambodia 30 10 20
Bitter gourd " 30 10 20
Cucumber " 30 10 20
Eggplant " 30 10 20
Long bean " 30 10 20
Rice (irrigated) " 20 5 15
16. ADB projects and some mitigation options
ADB project examples
Location Activity GHG mitigation opportunities
HP, India Horticulture LUC
C storage
in above-
ground
biomass
FLW
reduction
Storage and
transportation?
Mongolia
Vegetable
production LUC
N-fertilizer
efficiency
FLW
reduction
Cold storage and
transportation
Tajikistan Dairy LUC Livestock
FLW
reduction
Cold storage and
transportation
17. 10/23/2018 17
Landscape
transitions
Crop
transitions
Rice
crops
Crops
(non rice) Fertilizer Livestock
- 4.7M
TotalAnnualtCO2e
Land use
change
Agricultural practice
improvements
Increased
emissions
Reduced
emissions/
increased C
sequestration
(1,865,626)
(905,776)
(433,447)
(616,320)
(32,068)
(819,848
)
435,313
1,723,672
2.1 M
Mitigation benefits of USAID’s agricultural development portfolio
https://ccafs.cgiar.org/blog/greenhouse-gas-emission-analyses-nine-agricultural-development-projects-reveal-
mitigation#.WqrhAGbMzEY
25developmentprojects,15countries,3continents.
18. Feasibility Case 1: Developing an investment
plan for AWD in Vietnam
Comprehensive, comparative analysis of potentially viable LED practices and
their supporting interventions within the rice supply chain
Geographic suitability Barriers
Incentives, enabling
conditions
Costs, benefits and risk
analysis
1. Domestic investment plan for
AWD and mid-season drainage
2. Outline for international
investment proposal for AWD
Policy gap analysis
Identification of policy
levers to incentivize
adoption
Quantification of
investment needed
Identification of international funding sources
Investment plan for AWD
Prioritize
interventions,
identify
instruments to
encourage large-
scale adoption
Slides courtesy of Tran Van The
19. Business case for AWD in Vietnam
-
5,000.00
10,000.00
15,000.00
20,000.00
An Giang Kien Giang Soc Trang Average
Costs (1000 VND/ha/season)
AWD None
-
10,000.00
20,000.00
30,000.00
An Giang Kien Giang Soc Trang Average
Net benefit (1000 VND/ha/season)
AWD None
30,000.00
35,000.00
40,000.00
45,000.00
An Giang Kien Giang Soc Trang Average
Revenue (1000 VND/ha/season)
AWD None
21. Key points
1. Many options: Opportunities for mitigation occur via agricultural
practices, land use change, supply chain or shifts in diet
preferences
Best practices for mitigation:
- Seek absolute reductions where possible (e.g. AWD)
- Elsewhere at least improve GHG efficiency (emission
intensity)
- Offset emissions with C sequestration
- Work at all scales
2. Agricultural development can yield significant climate change
mitigation co-benefits
3. Actions are already being taken to plan and implement mitigation
at large scales where net benefits occur
23. Feasibility Case 2: Private drone companies help
scaling out of technologies for better N fertilizer
management
• 3 drone companies delivering N
recommendations to maize farmers
in Mexico using NDVI from their
drones and an algorithm.
• Farmers are willing to pay for this
service (approx. 3 USD / ha per
flight).
• N saving of ca. 60 – 70 kgN/ha
24. ADB Training 9-11 October, 2018,Tokyo
An introduction to the EX-ACT
Tool
Lini Wollenberg, CCAFS Low emissions agriculture
25. What is the EX-ACT Tool?
Ex-Ante Carbon Balance Tool developed by FAO
• Compares net emissions with and without a project
• Intended for planning, not assessment or verification
How does it work?
• A set of linked Microsoft Excel sheets
• Structured as 8 modules reflecting land use and management
practices
• Compares baseline, project and BAU scenarios
• Covers emissions and C sequestration, in CO2e/ha/yr
• Uses IPCC default (Tier 1) or user can specify region-specific
emission values (Tier 2)
• Available in 4 languages
• Simple supply chain calculation possible
26. On-line course available on World Bank Site
• https://olc.worldbank.org/content/estimating-ghg-emissions-and-
carbon-sequestration-agriculture-forestry-and-other-land-use-ex
27. Estimating emissions
Emissions = Activity x Emissions Factor
IPCC default EF’s are based on global or
regional average values
Ex. Nitrous Oxide =
Annual amount of synthetic fertilizer N
applied to soils, kg N yr-1 x 1%
Guidance from IPCC 1996 and 2006 guidelines:
28. Tier 1 Emission Factors
Default emission factor provided by the IPCC. Usually regional or global.
Tier 2 Emission Factors
More complex and country-specific emission factor. Not usually available in low
income countries.
Tier 3 Emission Factors
Most complex, often modeled.
See also the IPCC
Emissions Factor
Database
https://www.ipcc-
nggip.iges.or.jp/EFDB/
Example of IPCC Tier 1 defaults in Good
Practice Guidelines
Tiers: Specificity of estimates
29. Poor accuracy of GHG calculators
using Tier 1 emissions
Comparison of Cool Farm Tool and
Ex-Act Tool results against
measurements in tropical agriculture.
Default emission factors lead to
over-prediction of emissions.
• Dashed line is a 1:2 line; data
points above this line represent an
overestimation by a factor of 2 or
more.
• Solid line is a 1:1 line; data points
above this line represent an over-
estimation of GHG emissions by
the calculator.
Richards et al. 2016 https://dx.doi.org/10.1038/srep26279
30. Calculators using Tier I emissions don’t even
predict well whether emissions have increased
or decreased
30
Richards et al. 2016 https://dx.doi.org/10.1038/srep26279
Change in GHG emissions due to an intervention
Incorrect calculator
predictions (opposite
direction of change than
measured observations)
EX-ACT
underestimated
emissions in a significant
number of cases
31. 1. Complete “Description” module
Using EX-ACT
Download: www.fao.org/tc/exact/carbon-balance-tool-ex-act.
Total time period should not be less than 20 years if carbon
sequestration is expected.
32. 2. Build scenarios
Three scenarios required
1. Start: Initial conditions
2. Without: Baseline showing expected
conditions without the project (business-as-
usual)
3. With: Conditions with project intervention
33. 2. Build scenarios (cont)
“With” scenario (with project)
Identify expected changes
Identify dynamic of changes over time
• “Without” scenario (baseline)
Defined as would have happened without the project.
This is what EX-ACT compares project results against.
Options:
− No change from initial conditions (simplest, and likely to be most common)
− Extrapolation of past trends
− Modeling of future trends
35. 4. Collect activity data for each land use
and practice, for each scenario
Estimate areas (ha) of
land use change
and changes in management practices
• Can use expert judgement, project planning documents, national statistics,
focus groups, primary data collection etc. Quality affects results.
• Most time consuming stage, especially to produce relevant scenarios
36. Example of module: Land use change (LUC)
Navigation bar for modules
Data entry required in light blue cells; not all cells must be completed
38. Example of module: Annual crops
Areas continuously managed as annuals. Enter
names of additional cropping systems.
Areas converted to
annuals: Prefilled based
on Land Use module
Dynamics of intervention:
immediate (default),
linear or exponential
39. Remember
• Complete Description and then only relevant modules
• Provide data for all three scenarios (start, without, with project),
remembering that some land uses will be relevant to only one
scenario (e.g. baseline or project)
• Normal for many cells or modules to be left blank
• Scroll down and across so you don’t miss modules, links, etc.
See user guidelines: http://www.fao.org/tc/exact/user-guidelines/en/
Quick, complete and technical guidance available
40. CO2e
Reminder: Global net CO2e is what matters
Be careful about project “leakage,” increases in emissions elsewhere
41. Tips
• “Help” tab provides soil, climate and ecological zone classifications;
see additional resources here by scrolling to the right
• Additional information and options are located throughout the tool
in the form of orange buttons: e.g. look-up tables, value chain
calculations, uncertainty information, land use change matrix
• All calculations are based on IPCC guidance, so you can look up
assumptions if not available in Ex-Act documents.
Example of assumption: Changes in carbon sequestration are calculated
over 20-year time period and annualized.
• In some cases FAO can “unlock” pages for you if you need to
customize calculations
42. EX-ACT Exercise (20 minutes)
• Working in teams of 2-3 people, complete description module and
one to two other modules
• Can make up data, but try to be realistic
Identify
1. Net change in emissions/ha/yr as a result of your project
2. Uncertainty of your estimate
3. Largest contributing:
Source of emissions (“component”):
Type of GHG:
4. Resulting emissions intensity (or at least where the calculation
option appears)
5. Value chain results (or at least where calculation option appears)
43. Relevant EX-ACT links
• EX-ACT home page: http://www.fao.org/tc/exact/ex-act-home/en/
• EX-ACT tool Version 7:
http://www.fao.org/fileadmin/templates/ex_act/excel/EX-ACT-
v7.2.xlsx
• Quick guide: http://www.fao.org/3/a-i8075e.pdf
• Comprehensive user guide:
http://www.fao.org/fileadmin/templates/ex_act/pdf/Technical_guideli
nes/EX-ACTUserManuaFinal_WB_FAO_IRD.pdf
• Translations and other guidance: http://www.fao.org/tc/exact/user-
guidelines/en/
• World Bank on-line course
https://olc.worldbank.org/content/estimating-ghg-emissions-and-
carbon-sequestration-agriculture-forestry-and-other-land-use-ex
45. Negative emissions needed to limit warming
below 1.5 or 2 °C
Roe et al. 2017 How Improved Land Use Can Contribute to the 1.5°C Goal of the Paris Agreement
46. IPCC emissions factors and uncertainty levels
Emissions source
Range of emissions
factors for developing
country (warm wet/warm
moist conditions) Unit
Uncertainty/error for
Tier 1 emissions factors
Biomass C storage 12 to 228 t C/ha/yr 6-126%
Biomass C loss with harvest 9 to 50 t C/ha every 5 - 8 years 75%
Relative stock change in soil C 0.48 to 144 t C/ha/yr 26% (7 - 61%)
Land conversion 1.8 to 10 t C/ha/yr 75%
N2O fertilizer 0.01 kg N2O-N/kg N .003 - .30
CH4 Paddy rice 1.3* kg CH4/ha/day 62-169%
CH4 Enteric fermentation - dairy
cattle 46 to 72 kg CH4/ha/day 30-50%
CH4 Enteric fermentation -other
cattle 27 to 56 kg CH4/ha/day 30-50%
CH4 Enteric fermentation -other 1 to 55 kg CH4/ha/day 30-50%
CH4 manure 1 to 2 kg CH4/head/year 30%
N2O urine 0.32 to 1.57
kg N/1000Kg animal
mass/day 50%
*if scaling factors used, ranges from 0.35 to 1.34
48. Sources: Bernoux et al. 2012
Scale: + indicates <1 day, ++++ indicates >1 month
Geographi
c scope
Intended
scale of
calculation
Time and
data
requiremen
ts
User
input
EFs
Scenarios Uncertain
ty
estimates
EX-ACT World Landscape + Yes Initial,
BAU,
project
Yes, for
EFs
Cool Farm
Tool
World Farm ++ In
excel
versio
n
Yes, with
different
tool runs
No
USAID
AFOLU
Calculator
Developing
countries
Landscape + No In different
runs
No
ALU World Landscape ++++ Yes No Entered by
user
Carbon
benefits
project
World Landscape +++ Yes Initial,
BAU,
project
Yes
49. Precision example:
N2O calculation methodology
EX-ACT IPCC default 1% of applied N or user-defined
Cool Farm Tool Bouwman model: accounts for N-rate*Fertilizer type interaction,
crop type, soil texture, SOC, soil drainage, soil pH, climate type
USAID AFOLU
Calculator
IPCC default EFs, specific to fertilizer type
ALU IPCC default EFs
Carbon benefits project Range: IPCC Tier 1 defaults or user-defined
What are the most important terrestrial carbon sinks?
What might be the most efficient terrestrial carbon sinks for managing climate change mitigation? What might be the best manageable sinks?
What are good and realizable approaches/ management options for those sinks? What are cost-efficient approaches?
What are relevant financing options and mechanisms?
What are practically applicable MRV options?
What should be policy priorities for managing of terrestrial carbon sinks for climate change mitigation?
How is the climate change mitigation objective for terrestrial carbon sinks aligned with country policies and Intended Nationally Determined Contributions (INDCs)?
What are the challenges to align the climate change mitigation objective for terrestrial carbon sinks with other development priorities such as biodiversity conservation, improving agricultural productivity, increasing food security, eliminating poverty, etc.?
Forests as terrestrial carbon sinks:
Conservation of forests including IFL
Forest management
Afforestation/Reforestation
Soils as terrestrial carbon sinks:
Preservation and restoration of peat soils and grasslands
Restoration of degraded soils and avoidance of soil degradation
Agricultural land management and agro-ecological approaches (conservation agriculture, agroforestry, etc.)
(Other Intertwining concepts and landscape approaches (e.g. forest landscape restoration))
Scientifically based overview of
terrestrial carbon sinks and their potential
MRV (measuring, reporting and verification) system for terrestrial carbon sinks and connected challenges
49Gt CO2e 2010 global emissions (chk) needs to go down to 42 by 2030.
GCB target: The target assumes an allowable emissions budget
of 6.15–7.78 GtCO2e yr 1 for agriculture in 2030
(Table 1). The goal represents an 11–18% reduction relative
to the scenarios’ respective 2030 business-as-usual
baselines.
The goal would contribute ~4–5% of the 26
GtCO2e yr
1 in mitigation needed across all sectors in
2030 to achieve the 2 °C limit; business-as-usual emissions
for all sectors in the same year are ~68 GtCO2e
As a target for 2030, this is a near-term goal only. The
scenarios show that the contribution of agriculture
would need to increase in 2050 to 2.51 GtCO2e
(IMAGE) and 2.63 GtCO2e yr
1 (GCAM), reaching a
maximum of 2.91 GtCO2e yr 1 in 2070–2080 using
IMAGE and 4.20 GtCO2e yr
1 in 2100 using GCAM
One simple indicator: global CO2 in gigatons, gG, Tg, etc.
Estimating mitigation that is meaningful for climate change requires more than metrics. Requires a systematic approach to assess emissions per ha and additionality and leakage: e.g., baselines (historical, averages across multiple years, projections);
GWP is IPCC official number for 2013 to 2020
Duration in atmosphere
CO2 lasts 1000s yrs
N2O 100 yrs
CH4, 10 yrs
Usually in tons or kg
5.4Gt CO2e/yr annual emissions
(also called intermittent flooding/drainage, single/multiple drainage)
The practice of AWD on the farm
n At about two weeks after transplanting, the field is
left to dry out until the water level is at 15 cm
below the soil surface. Then, the field is flooded
again to a water depth of approximately 3–5 cm
before draining again. This irrigation scheme is
repeated except during flowering time, when the
field is maintained at a flooded water depth of 3–5
cm. The number of drainages and the number of
days that the field is non-flooded will vary.
n A drainage level of 15 cm is called “safe AWD”
because this level will not cause a yield decline
(see Further Reading). Farmers monitor the water
level in the field using a field water tube—a 30-cm
length of 15-cm diameter plastic pipe or bamboo,
with drilled holes, which is sunk into the rice field
until 10 cm of it protrudes above soil level. This
has been effective in assuring farmers that the
rice plant is accessing water even when there is
no standing water in the field. Once AWD has
become established, the tube is often dispensed
with and farmers base the decision to irrigate on
soil monitoring.
n Proper leveling of rice fields is necessary to
ensure that no areas are excessively dry or wet,
which could adversely affect yields. Laser landleveling
may be appropriate in some farming
systems.
n Weed management is important, as periods of
drying can encourage weed growth. Maintaining
flooded conditions until around 2 weeks after
transplanting discourages the growth of weeds
while the rice plant becomes established.
AWD technology can reduce the number of irrigations significantly compared with the farmers’ practice, thereby lowering irrigation water consumption by 25% and, in some cases, reducing fuel consumption for pumping water by 30 liters per hectare.
– estimated total global loss of 133 Gt C (488 Gt CO2e) (Sanderman et al. 2017)
In t CO2, average is ~ 18 t CO2 for average AGB in tropics, 8 t CO2 for soil average
Rule of thumb: ½ biomass is carbon
Average increase in carbon - tropical climate
-Plant biomass: 4.85 tC/ha/yr
-Soil C: 2.23 tC/ha/yr
Turning to mitigation, We can also ask whether intensification and increasing productivity can achieve mitigation goals,
CCAFS, working with FAO, examined the mitigation co-benefits of IFAD and USAID’s agricultural investment portfolios.
This figure shows the USAID analysis, for 25 diverse agricultural development projects and several dozens of practices across 15 countries in 3 continents.
You can see that across the entire portfolio,blue is negative emissions, yellow is positive, that ag investments resulted in substantial net mitigation co-benefits, 2.6 MtCO2e/yr. Looking at interventions across categories you can see that the major source of emissions was livestock and secondarily fertilizer use, but that this was offset by land use change and rice and crop management.
So current trajectories of agricultural development can yield substantial mitigation co-benefits, especially when considered at the larger portfolio level.
That is the good news…
******
Landscape and crop transitions
1) Landscape transitions- Within the agricultural development projects, project interventions focused on both avoided land conversion (avoided change from forest) and active land conversion (agricultural or degraded lands changed to forest).
2) Crop transitions- This area include transitions to perennial crops or agroforestry. Also transitions from flooded rice systems to other crops such as wheat. Transitions land into irrigated rice. (Check why 5802 in positive)
Management practice improvements
1) Rice crops- AWD, UDP, Short Duration Rice
2) Crops- Soil, manure, and water management improvements- also includes crop residue burning reduction and perennial management.
3) Fertilizer- increases and decreases
4) Livestock- herd size management, feed quality and breeding improvements. Grassland increases. With better feeding practices and increases in cow weight comes increased emissions.
CCAFS is now collaborating with a number of countries, including Vietnam, Colombia and Kenya to implement their NDCs. Vietnam for example, according to their NDC plans to implement alternate wetting and drying or mid season drainage in 1.7 mil ha
We are supporting comparative analysis of options for reducing emissions and the development of an investment plan to provide the basis both for policy change and investment in scale-out (at the national level) and submission of proposals for climate finance.
In Kenya we supported similar work. In Columbia we have supported modeling emissions usingthe RUMINANT model and the development of better emission factors. Important lessons are being learned from these experiences that we hope can inform NDCs and pave the way for other countries to also be successful.
Investment plan for AWD should be implemented for 900 thousand hectares, contribute in 10.97 million tCO2e, produced added net benefit of 8,540 billion VND (371.36 million US$/yr.) as compared to conventional rice cultivation in 2030.
2017-2018 data and analysis
Adresses rate, not timing source or placement
What are the most important terrestrial carbon sinks?
What might be the most efficient terrestrial carbon sinks for managing climate change mitigation? What might be the best manageable sinks?
What are good and realizable approaches/ management options for those sinks? What are cost-efficient approaches?
What are relevant financing options and mechanisms?
What are practically applicable MRV options?
What should be policy priorities for managing of terrestrial carbon sinks for climate change mitigation?
How is the climate change mitigation objective for terrestrial carbon sinks aligned with country policies and Intended Nationally Determined Contributions (INDCs)?
What are the challenges to align the climate change mitigation objective for terrestrial carbon sinks with other development priorities such as biodiversity conservation, improving agricultural productivity, increasing food security, eliminating poverty, etc.?
Forests as terrestrial carbon sinks:
Conservation of forests including IFL
Forest management
Afforestation/Reforestation
Soils as terrestrial carbon sinks:
Preservation and restoration of peat soils and grasslands
Restoration of degraded soils and avoidance of soil degradation
Agricultural land management and agro-ecological approaches (conservation agriculture, agroforestry, etc.)
(Other Intertwining concepts and landscape approaches (e.g. forest landscape restoration))
Scientifically based overview of
terrestrial carbon sinks and their potential
MRV (measuring, reporting and verification) system for terrestrial carbon sinks and connected challenges
https://dx.doi.org/10.1038/srep26279
We do have emission factors based on data from temperate areas, but those aren’t great for the tropics
Because of this dearth of information, most developing countries quantify ag emissions using Tier 1 emissions factors, which are calibrated to data from developed temperate countries, with conditions dissimilar to the actual conditions in the tropics
This gives us an inaccurate picture of actual emissions or mitigation potentials in tropical developing countries
What we found is that the calculators tend to overestimate emissions- EX-ACT was only slightly more likely to overestimate as to underestimate emissions (54% of cases)
Comparison between measured and calculator-predicted soil fluxes for N2O, CH4, and the net balance (CO2e). The solid line is a 1:1 line; data points above this line represent an over-estimation of GHG emissions by the calculator. The dashed line is a 1:2 line; data points above this line represent an overestimation by a factor of 2 or more.
Change in GHG balance between control and alternative management practices (e.g. continuous flooding vs. multiple drainage in rice).
Points in the upper right and lower left quadrants represent cases where the calculator predicted the same direction of change as observed in the field study.
Points in the lower right and upper left quadrants represent cases where the calculator predicted the opposite direction of change as observed in the field study.
One reason for using implementation and capitalization phases in EX-ACT is to enable 20 year phase for accounting for C accumulation
Most projects will have only 2 scenarios: baseline (initial conditions) and project
Data collection using expert judgement, project documents, key respondents, observation or resources in Ex-Act
See http://www.fao.org/fileadmin/templates/ex_act/pdf/Technical_guidelines/EX-ACTUserManuaFinal_WB_FAO_IRD.pdf for more detail
One simple indicator: global CO2 in gigatons, gG, Tg, etc.
Estimating mitigation that is meaningful for climate change requires more than metrics. Requires a systematic approach to assess emissions per ha and additionality and leakage: e.g., baselines (historical, averages across multiple years, projections);
GWP is IPCC official number for 2013 to 2020
Duration in atmosphere
CO2 lasts 1000s yrs
N2O 100 yrs
CH4, 10 yrs
Discussion
Comprehensive, but very coarse
High sensitivity to parameters
Data quality only as good as your input
Where can you find Tier 2 inputs?
Time consuming to do input
Cannot compare more than one project
Limited number of zones
N-fixing plants or residue N not included; cannot leave residues on field
Numbers need checking
High variability, nonadditive effects and uncertainties of 10 to 150% (compared to 10-15% for CO2 from fossil fuels)
CBP provides a range of modules:
simple assessment (only requires knowing land use changes)
Detailed assessment module (requires specific information on crop/grass/forest species and systems, improved emission factors, Resources and facilities for field sampling and lab analysis)
Dynamic modeling option (requires use of GIS and data for model paramaterization)
CBP can provide both ex-ante and ex-post analysis