Download as PDF, PPTX
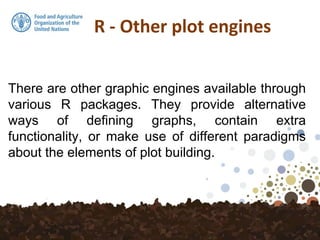
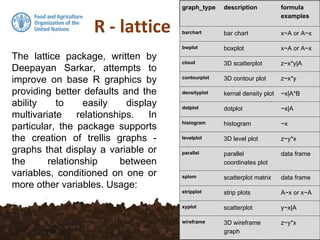
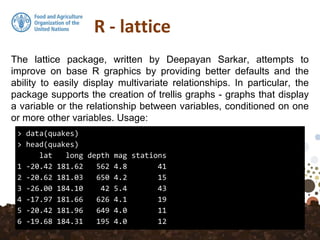

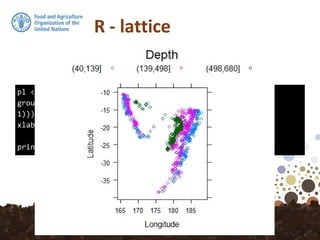

The document discusses alternative R packages for creating graphs beyond base R graphics. It focuses on the lattice package, which aims to improve on base graphics with better defaults and easier multivariate displays using trellis graphs. Trellis graphs display variables or relationships conditioned on other variables. Examples of different graph types like scatterplots, boxplots, and density plots are provided.