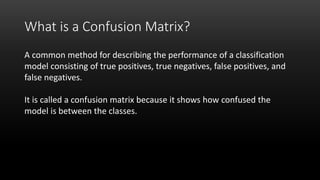
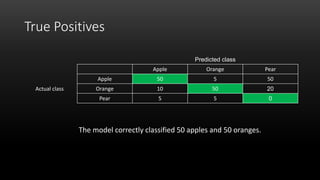
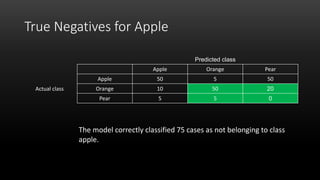
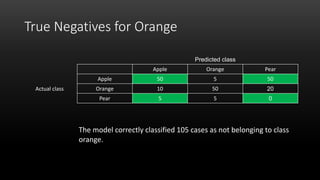
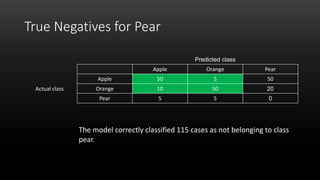
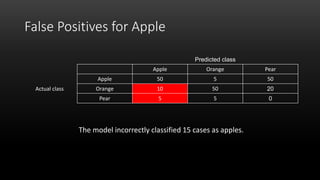
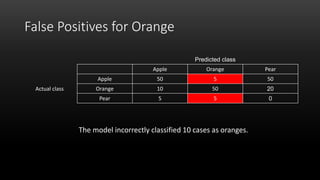
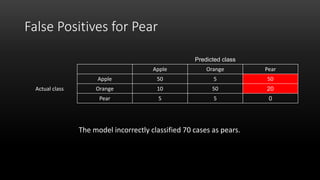
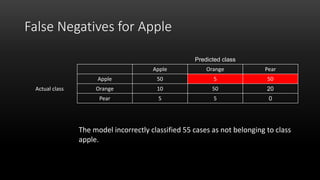
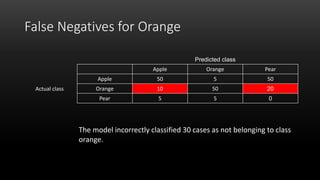
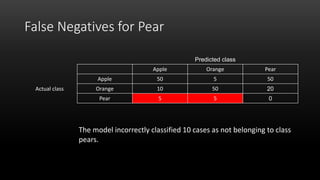
A confusion matrix is a table that shows the performance of a classification model by listing the true positives, true negatives, false positives, and false negatives. It displays how often the model correctly or incorrectly classified observations into their actual classes. The document provides an example confusion matrix for a model classifying apples, oranges, and pears, showing the number of observations the model correctly and incorrectly classified into each class.
Introduces the confusion matrix as a tool for assessing classification model performance, detailing true positives, negatives, false positives, and negatives.
Displays the classification performance, showing correct identifications of apples (50) and oranges (50) among other misclassifications.
Highlights correct classifications across classes: 75 for Apple, 105 for Orange, and 115 for Pear, indicating how many were correctly identified as not belonging to each class.
Details incorrect classifications, with 15 for Apple, 10 for Orange, and 70 for Pear, highlighting misidentified cases.
Examines false negatives, showing misclassifications with 55 for Apple, 30 for Orange, and 10 for Pear, focusing on cases wrongly marked as not belonging.
What is aConfusion Matrix?
A common method for describing the performance of a classification
model consisting of true positives, true negatives, false positives, and
false negatives.
It is called a confusion matrix because it shows how confused the
model is between the classes.
3.
True Positives
Predicted class
AppleOrange Pear
Actual class
Apple 50 5 50
Orange 10 50 20
Pear 5 5 0
The model correctly classified 50 apples and 50 oranges.
4.
True Negatives forApple
The model correctly classified 75 cases as not belonging to class
apple.
Predicted class
Apple Orange Pear
Actual class
Apple 50 5 50
Orange 10 50 20
Pear 5 5 0
5.
True Negatives forOrange
The model correctly classified 105 cases as not belonging to class
orange.
Predicted class
Apple Orange Pear
Actual class
Apple 50 5 50
Orange 10 50 20
Pear 5 5 0
6.
True Negatives forPear
The model correctly classified 115 cases as not belonging to class
pear.
Predicted class
Apple Orange Pear
Actual class
Apple 50 5 50
Orange 10 50 20
Pear 5 5 0
7.
False Positives forApple
The model incorrectly classified 15 cases as apples.
Predicted class
Apple Orange Pear
Actual class
Apple 50 5 50
Orange 10 50 20
Pear 5 5 0
8.
False Positives forOrange
The model incorrectly classified 10 cases as oranges.
Predicted class
Apple Orange Pear
Actual class
Apple 50 5 50
Orange 10 50 20
Pear 5 5 0
9.
False Positives forPear
The model incorrectly classified 70 cases as pears.
Predicted class
Apple Orange Pear
Actual class
Apple 50 5 50
Orange 10 50 20
Pear 5 5 0
10.
False Negatives forApple
The model incorrectly classified 55 cases as not belonging to class
apple.
Predicted class
Apple Orange Pear
Actual class
Apple 50 5 50
Orange 10 50 20
Pear 5 5 0
11.
False Negatives forOrange
The model incorrectly classified 30 cases as not belonging to class
orange.
Predicted class
Apple Orange Pear
Actual class
Apple 50 5 50
Orange 10 50 20
Pear 5 5 0
12.
False Negatives forPear
The model incorrectly classified 10 cases as not belonging to class
pears.
Predicted class
Apple Orange Pear
Actual class
Apple 50 5 50
Orange 10 50 20
Pear 5 5 0