SlideShare a Scribd company logo
1 of 14
Course 3, Lesson 9-4
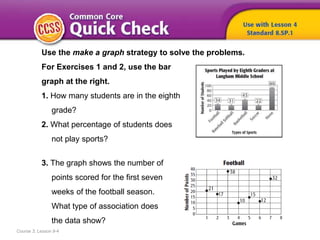
Use the make a graph strategy to solve the problems.
For Exercises 1 and 2, use the bar
graph at the right.
1. How many students are in the eighth
grade?
2. What percentage of students does
not play sports?
3. The graph shows the number of
points scored for the first seven
weeks of the football season.
What type of association does
the data show?
Course 3, Lesson 9-4
ANSWERS
1. 219 students
2. 40.6%
3. no association
HOW are patterns used
when comparing two quantities?
Statistics and Probability
Course 3, Lesson 9-4
Course 3, Lesson 9-4 Common Core State Standards © Copyright 2010. National Governors Association Center for
Best Practices and Council of Chief State School Officers. All rights reserved.
Statistics and Probability
• Preparation for S.ID.1
Represent data with plots on the real number line (dot plots,
histograms, and box plots).
• Preparation for S.ID.2
Use statistics appropriate to the shape of the data distribution to
compare center (median, mean) and spread (interquartile range,
standard deviation) of two or more different data sets.
Course 3, Lesson 9-4 Common Core State Standards © Copyright 2010. National Governors Association Center for
Best Practices and Council of Chief State School Officers. All rights reserved.
Statistics and Probability
Mathematical Practices
1 Make sense of problems and persevere in solving them.
2 Reason abstractly and quantitatively.
3 Construct viable arguments and critique the reasoning of others.
4 Model with mathematics.
7 Look for and make use of structure.
To
• describe univariate data using
measures of center,
• measure quantitative data using
a five-number summary
Course 3, Lesson 9-4 .
Statistics and Probability
• univariate data
• quantitative data
• five-number summary
Course 3, Lesson 9-4
Statistics and Probability
1
Need Another Example?
2
3
4
Step-by-Step Example
1. The ages, in years, of the people seated in one row of a movie theater
are 16, 15, 24, 33, 30, 56, 19, and 19. Find the mean, median, mode, and
range of the data set.
Mean
The mode is 19, since it is the number that occurs most often.
Arrange in order from least to greatest.Median 15, 16, 19, 19, 24, 30, 33, 56
Mode
56 – 15 = 41Range
Answer
Need Another Example?
The ages, in years, of the actors in a play are
5, 16, 32, 15, 26, and 32. Find the mean, median,
mode, and range of the data set.
mean: 21; median: 21; mode: 32; range: 27
1
Need Another Example?
2
3
5
Step-by-Step Example
2. The data for daily average temperatures for
15 days in May are shown in the table.
a. Find the five-number summary of the data.
b. Draw a box plot of the data.
b.
68 69 70 71 72 72 73 74 75 75 75 75 76 76 76
minimum
Draw the box plot and assign a title to the graph.
Daily Temperatures
a. Write the data from least to greatest.
first quartile median third quartile maximum
Draw a number line that includes the least and greatest numbers in the data.
Mark the minimum and maximum values, the median, and the first and third
quartiles above the number line.
4
Answer
Need Another Example?
Find the five-number
summary of the data.
Draw a box plot of
the data.
minimum: 39.1; Q 1 : 59.25; median: 74.1;
Q 3 : 81.4; maximum: 95.5
How did what you learned
today help you answer the
How are patterns used
when comparing two quantities?
Course 3, Lesson 9-4
GeometryStatistics and Probability
How did what you learned
today help you answer the
How are patterns used
when comparing two quantities?
Course 3, Lesson 9-4
GeometryStatistics and Probability
Sample answers:
• You can find the five-number summary of a set of
univariate data.
• Using the five-number summary, you can construct and
analyze a box plot of the data.
Write a set of directions for
finding mean, median, mode,
and range for a data set.
Course 3, Lesson 9-4
Ratios and Proportional RelationshipsFunctionsStatistics and Probability

More Related Content

What's hot

Chapter 2: Frequency Distribution and Graphs
Chapter 2: Frequency Distribution and GraphsChapter 2: Frequency Distribution and Graphs
Chapter 2: Frequency Distribution and GraphsMong Mara
 
3.3 percentiles and boxandwhisker plot
3.3 percentiles and boxandwhisker plot3.3 percentiles and boxandwhisker plot
3.3 percentiles and boxandwhisker plotleblance
 
Frequency Distributions
Frequency DistributionsFrequency Distributions
Frequency Distributionsjasondroesch
 
Box And Whisker Plots
Box And Whisker PlotsBox And Whisker Plots
Box And Whisker PlotsWendiBrown
 
Presentation of Data and Frequency Distribution
Presentation of Data and Frequency DistributionPresentation of Data and Frequency Distribution
Presentation of Data and Frequency DistributionElain Cruz
 
Assessment of Learning 1: Chapter 5 - Utilization of Assessment Data
Assessment of Learning 1: Chapter 5 - Utilization of Assessment DataAssessment of Learning 1: Chapter 5 - Utilization of Assessment Data
Assessment of Learning 1: Chapter 5 - Utilization of Assessment DataDonna Domulot
 
Chapter 9 Study Guide
Chapter 9 Study GuideChapter 9 Study Guide
Chapter 9 Study Guidewzuri
 
(8) Lesson 9.3
(8) Lesson 9.3(8) Lesson 9.3
(8) Lesson 9.3wzuri
 
frequency distribution
 frequency distribution frequency distribution
frequency distributionUnsa Shakir
 
2 1 frequency table
2 1 frequency table2 1 frequency table
2 1 frequency tableKen Kretsch
 
Frequency Distribution
Frequency DistributionFrequency Distribution
Frequency DistributionTeacherMariza
 
2.4 Other Types of Graphs
2.4 Other Types of Graphs2.4 Other Types of Graphs
2.4 Other Types of Graphsmlong24
 
Frequency distribution 6
Frequency distribution 6Frequency distribution 6
Frequency distribution 6NadeemShoukat3
 
NOTE STATISTIC BA301
NOTE STATISTIC BA301NOTE STATISTIC BA301
NOTE STATISTIC BA301faijmsk
 
Frequency Distributions and Graphs
Frequency Distributions and GraphsFrequency Distributions and Graphs
Frequency Distributions and Graphsmonritche
 
Grade level goals
Grade level goalsGrade level goals
Grade level goalsackerkri
 
Probability and statistics (frequency distributions)
Probability and statistics (frequency distributions)Probability and statistics (frequency distributions)
Probability and statistics (frequency distributions)Don Bosco BSIT
 
Box and whiskers power point
Box and whiskers power pointBox and whiskers power point
Box and whiskers power pointmanswag123
 

What's hot (20)

Chapter 2: Frequency Distribution and Graphs
Chapter 2: Frequency Distribution and GraphsChapter 2: Frequency Distribution and Graphs
Chapter 2: Frequency Distribution and Graphs
 
3.3 percentiles and boxandwhisker plot
3.3 percentiles and boxandwhisker plot3.3 percentiles and boxandwhisker plot
3.3 percentiles and boxandwhisker plot
 
Frequency Distributions
Frequency DistributionsFrequency Distributions
Frequency Distributions
 
Box And Whisker Plots
Box And Whisker PlotsBox And Whisker Plots
Box And Whisker Plots
 
Frequency Distribution
Frequency DistributionFrequency Distribution
Frequency Distribution
 
Presentation of Data and Frequency Distribution
Presentation of Data and Frequency DistributionPresentation of Data and Frequency Distribution
Presentation of Data and Frequency Distribution
 
Assessment of Learning 1: Chapter 5 - Utilization of Assessment Data
Assessment of Learning 1: Chapter 5 - Utilization of Assessment DataAssessment of Learning 1: Chapter 5 - Utilization of Assessment Data
Assessment of Learning 1: Chapter 5 - Utilization of Assessment Data
 
Chapter 9 Study Guide
Chapter 9 Study GuideChapter 9 Study Guide
Chapter 9 Study Guide
 
(8) Lesson 9.3
(8) Lesson 9.3(8) Lesson 9.3
(8) Lesson 9.3
 
frequency distribution
 frequency distribution frequency distribution
frequency distribution
 
2 1 frequency table
2 1 frequency table2 1 frequency table
2 1 frequency table
 
Cumulative Frequency
Cumulative FrequencyCumulative Frequency
Cumulative Frequency
 
Frequency Distribution
Frequency DistributionFrequency Distribution
Frequency Distribution
 
2.4 Other Types of Graphs
2.4 Other Types of Graphs2.4 Other Types of Graphs
2.4 Other Types of Graphs
 
Frequency distribution 6
Frequency distribution 6Frequency distribution 6
Frequency distribution 6
 
NOTE STATISTIC BA301
NOTE STATISTIC BA301NOTE STATISTIC BA301
NOTE STATISTIC BA301
 
Frequency Distributions and Graphs
Frequency Distributions and GraphsFrequency Distributions and Graphs
Frequency Distributions and Graphs
 
Grade level goals
Grade level goalsGrade level goals
Grade level goals
 
Probability and statistics (frequency distributions)
Probability and statistics (frequency distributions)Probability and statistics (frequency distributions)
Probability and statistics (frequency distributions)
 
Box and whiskers power point
Box and whiskers power pointBox and whiskers power point
Box and whiskers power point
 

Similar to (8) Lesson 9.4

(8) Lesson 9.3
(8) Lesson 9.3(8) Lesson 9.3
(8) Lesson 9.3wzuri
 
9 Data Handling.pptx
9 Data Handling.pptx9 Data Handling.pptx
9 Data Handling.pptxekamali301
 
Algebra unit 9.3
Algebra unit 9.3Algebra unit 9.3
Algebra unit 9.3Mark Ryder
 
(8) Lesson 9.5
(8) Lesson 9.5(8) Lesson 9.5
(8) Lesson 9.5wzuri
 
Dot Plots and Box Plots.pptx
Dot Plots and Box Plots.pptxDot Plots and Box Plots.pptx
Dot Plots and Box Plots.pptxVaishnaviElumalai
 
Unit 8 Fourth Grade 2012 2013
Unit 8 Fourth Grade 2012 2013Unit 8 Fourth Grade 2012 2013
Unit 8 Fourth Grade 2012 2013Isaac_Schools_5
 
Part ASome questions in Part A require that you access data from.docx
Part ASome questions in Part A require that you access data from.docxPart ASome questions in Part A require that you access data from.docx
Part ASome questions in Part A require that you access data from.docxbridgelandying
 
DEMO LESSON PLAN.docx
DEMO LESSON PLAN.docxDEMO LESSON PLAN.docx
DEMO LESSON PLAN.docxChinGa7
 
Measures of Central Tendency.pdf
Measures of Central Tendency.pdfMeasures of Central Tendency.pdf
Measures of Central Tendency.pdfDenogieCortes
 
1. What type of research uses numeric measurement data (Points .docx
1. What type of research uses numeric measurement data (Points  .docx1. What type of research uses numeric measurement data (Points  .docx
1. What type of research uses numeric measurement data (Points .docxpaynetawnya
 
Unit 7 Fourth Grade 2012 2013
Unit 7 Fourth Grade 2012 2013Unit 7 Fourth Grade 2012 2013
Unit 7 Fourth Grade 2012 2013Isaac_Schools_5
 
lesson-data-presentation-tools-1.pptx
lesson-data-presentation-tools-1.pptxlesson-data-presentation-tools-1.pptx
lesson-data-presentation-tools-1.pptxAnalynPasto
 
Statistics and inferences review - bootcamp
Statistics and inferences review  - bootcampStatistics and inferences review  - bootcamp
Statistics and inferences review - bootcamparinedge
 
Unit 9 Fifth Grade cs 2012 2013
Unit 9 Fifth Grade cs 2012 2013Unit 9 Fifth Grade cs 2012 2013
Unit 9 Fifth Grade cs 2012 2013Isaac_Schools_5
 
Sampling s3 12-01-17-2012
Sampling s3 12-01-17-2012Sampling s3 12-01-17-2012
Sampling s3 12-01-17-2012Kumar Tarun
 

Similar to (8) Lesson 9.4 (20)

(8) Lesson 9.3
(8) Lesson 9.3(8) Lesson 9.3
(8) Lesson 9.3
 
Math Module Sample
Math Module SampleMath Module Sample
Math Module Sample
 
9 Data Handling.pptx
9 Data Handling.pptx9 Data Handling.pptx
9 Data Handling.pptx
 
Algebra unit 9.3
Algebra unit 9.3Algebra unit 9.3
Algebra unit 9.3
 
(8) Lesson 9.5
(8) Lesson 9.5(8) Lesson 9.5
(8) Lesson 9.5
 
Chapter 3.2
Chapter 3.2Chapter 3.2
Chapter 3.2
 
Dot Plots and Box Plots.pptx
Dot Plots and Box Plots.pptxDot Plots and Box Plots.pptx
Dot Plots and Box Plots.pptx
 
MATH DEMO.pptx
MATH DEMO.pptxMATH DEMO.pptx
MATH DEMO.pptx
 
Practice Test 1
Practice Test 1Practice Test 1
Practice Test 1
 
Unit 8 Fourth Grade 2012 2013
Unit 8 Fourth Grade 2012 2013Unit 8 Fourth Grade 2012 2013
Unit 8 Fourth Grade 2012 2013
 
Elementary Statistics
Elementary Statistics Elementary Statistics
Elementary Statistics
 
Part ASome questions in Part A require that you access data from.docx
Part ASome questions in Part A require that you access data from.docxPart ASome questions in Part A require that you access data from.docx
Part ASome questions in Part A require that you access data from.docx
 
DEMO LESSON PLAN.docx
DEMO LESSON PLAN.docxDEMO LESSON PLAN.docx
DEMO LESSON PLAN.docx
 
Measures of Central Tendency.pdf
Measures of Central Tendency.pdfMeasures of Central Tendency.pdf
Measures of Central Tendency.pdf
 
1. What type of research uses numeric measurement data (Points .docx
1. What type of research uses numeric measurement data (Points  .docx1. What type of research uses numeric measurement data (Points  .docx
1. What type of research uses numeric measurement data (Points .docx
 
Unit 7 Fourth Grade 2012 2013
Unit 7 Fourth Grade 2012 2013Unit 7 Fourth Grade 2012 2013
Unit 7 Fourth Grade 2012 2013
 
lesson-data-presentation-tools-1.pptx
lesson-data-presentation-tools-1.pptxlesson-data-presentation-tools-1.pptx
lesson-data-presentation-tools-1.pptx
 
Statistics and inferences review - bootcamp
Statistics and inferences review  - bootcampStatistics and inferences review  - bootcamp
Statistics and inferences review - bootcamp
 
Unit 9 Fifth Grade cs 2012 2013
Unit 9 Fifth Grade cs 2012 2013Unit 9 Fifth Grade cs 2012 2013
Unit 9 Fifth Grade cs 2012 2013
 
Sampling s3 12-01-17-2012
Sampling s3 12-01-17-2012Sampling s3 12-01-17-2012
Sampling s3 12-01-17-2012
 

More from wzuri

Chapter 3
Chapter 3Chapter 3
Chapter 3wzuri
 
Chapter 2 inquiry_lab_presentation_course_3 (1)
Chapter 2 inquiry_lab_presentation_course_3 (1)Chapter 2 inquiry_lab_presentation_course_3 (1)
Chapter 2 inquiry_lab_presentation_course_3 (1)wzuri
 
Chapter 2 Review
Chapter 2 ReviewChapter 2 Review
Chapter 2 Reviewwzuri
 
Chapter 2 lesson_4_presentation_course_3
Chapter 2 lesson_4_presentation_course_3Chapter 2 lesson_4_presentation_course_3
Chapter 2 lesson_4_presentation_course_3wzuri
 
Chapter 5
Chapter 5Chapter 5
Chapter 5wzuri
 
Lesson 5.1
Lesson 5.1Lesson 5.1
Lesson 5.1wzuri
 
Lesson 1.8 grade 8
Lesson 1.8   grade 8Lesson 1.8   grade 8
Lesson 1.8 grade 8wzuri
 
Chapter 7
Chapter 7Chapter 7
Chapter 7wzuri
 
Lesson 7.4
Lesson 7.4Lesson 7.4
Lesson 7.4wzuri
 
Lesson 7.3 (8)
Lesson 7.3 (8)Lesson 7.3 (8)
Lesson 7.3 (8)wzuri
 
Lesson 7.2
Lesson 7.2Lesson 7.2
Lesson 7.2wzuri
 
Pat05 ppt 0201
Pat05 ppt 0201Pat05 ppt 0201
Pat05 ppt 0201wzuri
 
Chapter 6
Chapter 6Chapter 6
Chapter 6wzuri
 
Pat05 ppt 0106
Pat05 ppt 0106Pat05 ppt 0106
Pat05 ppt 0106wzuri
 
Pat05 ppt 0105
Pat05 ppt 0105Pat05 ppt 0105
Pat05 ppt 0105wzuri
 
Chapter 1 Review
Chapter 1 ReviewChapter 1 Review
Chapter 1 Reviewwzuri
 
Lesson 1.10 grade 8
Lesson 1.10   grade 8Lesson 1.10   grade 8
Lesson 1.10 grade 8wzuri
 
Lesson 1.9 grade 8
Lesson 1.9   grade 8Lesson 1.9   grade 8
Lesson 1.9 grade 8wzuri
 
Lesson 1.7 grade 8
Lesson 1.7   grade 8Lesson 1.7   grade 8
Lesson 1.7 grade 8wzuri
 
Lesson 1.7 grade 8
Lesson 1.7   grade 8Lesson 1.7   grade 8
Lesson 1.7 grade 8wzuri
 

More from wzuri (20)

Chapter 3
Chapter 3Chapter 3
Chapter 3
 
Chapter 2 inquiry_lab_presentation_course_3 (1)
Chapter 2 inquiry_lab_presentation_course_3 (1)Chapter 2 inquiry_lab_presentation_course_3 (1)
Chapter 2 inquiry_lab_presentation_course_3 (1)
 
Chapter 2 Review
Chapter 2 ReviewChapter 2 Review
Chapter 2 Review
 
Chapter 2 lesson_4_presentation_course_3
Chapter 2 lesson_4_presentation_course_3Chapter 2 lesson_4_presentation_course_3
Chapter 2 lesson_4_presentation_course_3
 
Chapter 5
Chapter 5Chapter 5
Chapter 5
 
Lesson 5.1
Lesson 5.1Lesson 5.1
Lesson 5.1
 
Lesson 1.8 grade 8
Lesson 1.8   grade 8Lesson 1.8   grade 8
Lesson 1.8 grade 8
 
Chapter 7
Chapter 7Chapter 7
Chapter 7
 
Lesson 7.4
Lesson 7.4Lesson 7.4
Lesson 7.4
 
Lesson 7.3 (8)
Lesson 7.3 (8)Lesson 7.3 (8)
Lesson 7.3 (8)
 
Lesson 7.2
Lesson 7.2Lesson 7.2
Lesson 7.2
 
Pat05 ppt 0201
Pat05 ppt 0201Pat05 ppt 0201
Pat05 ppt 0201
 
Chapter 6
Chapter 6Chapter 6
Chapter 6
 
Pat05 ppt 0106
Pat05 ppt 0106Pat05 ppt 0106
Pat05 ppt 0106
 
Pat05 ppt 0105
Pat05 ppt 0105Pat05 ppt 0105
Pat05 ppt 0105
 
Chapter 1 Review
Chapter 1 ReviewChapter 1 Review
Chapter 1 Review
 
Lesson 1.10 grade 8
Lesson 1.10   grade 8Lesson 1.10   grade 8
Lesson 1.10 grade 8
 
Lesson 1.9 grade 8
Lesson 1.9   grade 8Lesson 1.9   grade 8
Lesson 1.9 grade 8
 
Lesson 1.7 grade 8
Lesson 1.7   grade 8Lesson 1.7   grade 8
Lesson 1.7 grade 8
 
Lesson 1.7 grade 8
Lesson 1.7   grade 8Lesson 1.7   grade 8
Lesson 1.7 grade 8
 

Recently uploaded

Organic Name Reactions for the students and aspirants of Chemistry12th.pptx
Organic Name Reactions  for the students and aspirants of Chemistry12th.pptxOrganic Name Reactions  for the students and aspirants of Chemistry12th.pptx
Organic Name Reactions for the students and aspirants of Chemistry12th.pptxVS Mahajan Coaching Centre
 
CARE OF CHILD IN INCUBATOR..........pptx
CARE OF CHILD IN INCUBATOR..........pptxCARE OF CHILD IN INCUBATOR..........pptx
CARE OF CHILD IN INCUBATOR..........pptxGaneshChakor2
 
Q4-W6-Restating Informational Text Grade 3
Q4-W6-Restating Informational Text Grade 3Q4-W6-Restating Informational Text Grade 3
Q4-W6-Restating Informational Text Grade 3JemimahLaneBuaron
 
Mastering the Unannounced Regulatory Inspection
Mastering the Unannounced Regulatory InspectionMastering the Unannounced Regulatory Inspection
Mastering the Unannounced Regulatory InspectionSafetyChain Software
 
How to Make a Pirate ship Primary Education.pptx
How to Make a Pirate ship Primary Education.pptxHow to Make a Pirate ship Primary Education.pptx
How to Make a Pirate ship Primary Education.pptxmanuelaromero2013
 
Arihant handbook biology for class 11 .pdf
Arihant handbook biology for class 11 .pdfArihant handbook biology for class 11 .pdf
Arihant handbook biology for class 11 .pdfchloefrazer622
 
_Math 4-Q4 Week 5.pptx Steps in Collecting Data
_Math 4-Q4 Week 5.pptx Steps in Collecting Data_Math 4-Q4 Week 5.pptx Steps in Collecting Data
_Math 4-Q4 Week 5.pptx Steps in Collecting DataJhengPantaleon
 
Paris 2024 Olympic Geographies - an activity
Paris 2024 Olympic Geographies - an activityParis 2024 Olympic Geographies - an activity
Paris 2024 Olympic Geographies - an activityGeoBlogs
 
BASLIQ CURRENT LOOKBOOK LOOKBOOK(1) (1).pdf
BASLIQ CURRENT LOOKBOOK  LOOKBOOK(1) (1).pdfBASLIQ CURRENT LOOKBOOK  LOOKBOOK(1) (1).pdf
BASLIQ CURRENT LOOKBOOK LOOKBOOK(1) (1).pdfSoniaTolstoy
 
The Most Excellent Way | 1 Corinthians 13
The Most Excellent Way | 1 Corinthians 13The Most Excellent Way | 1 Corinthians 13
The Most Excellent Way | 1 Corinthians 13Steve Thomason
 
Separation of Lanthanides/ Lanthanides and Actinides
Separation of Lanthanides/ Lanthanides and ActinidesSeparation of Lanthanides/ Lanthanides and Actinides
Separation of Lanthanides/ Lanthanides and ActinidesFatimaKhan178732
 
Measures of Central Tendency: Mean, Median and Mode
Measures of Central Tendency: Mean, Median and ModeMeasures of Central Tendency: Mean, Median and Mode
Measures of Central Tendency: Mean, Median and ModeThiyagu K
 
Industrial Policy - 1948, 1956, 1973, 1977, 1980, 1991
Industrial Policy - 1948, 1956, 1973, 1977, 1980, 1991Industrial Policy - 1948, 1956, 1973, 1977, 1980, 1991
Industrial Policy - 1948, 1956, 1973, 1977, 1980, 1991RKavithamani
 
Alper Gobel In Media Res Media Component
Alper Gobel In Media Res Media ComponentAlper Gobel In Media Res Media Component
Alper Gobel In Media Res Media ComponentInMediaRes1
 
Introduction to ArtificiaI Intelligence in Higher Education
Introduction to ArtificiaI Intelligence in Higher EducationIntroduction to ArtificiaI Intelligence in Higher Education
Introduction to ArtificiaI Intelligence in Higher Educationpboyjonauth
 
Employee wellbeing at the workplace.pptx
Employee wellbeing at the workplace.pptxEmployee wellbeing at the workplace.pptx
Employee wellbeing at the workplace.pptxNirmalaLoungPoorunde1
 
Kisan Call Centre - To harness potential of ICT in Agriculture by answer farm...
Kisan Call Centre - To harness potential of ICT in Agriculture by answer farm...Kisan Call Centre - To harness potential of ICT in Agriculture by answer farm...
Kisan Call Centre - To harness potential of ICT in Agriculture by answer farm...Krashi Coaching
 
SOCIAL AND HISTORICAL CONTEXT - LFTVD.pptx
SOCIAL AND HISTORICAL CONTEXT - LFTVD.pptxSOCIAL AND HISTORICAL CONTEXT - LFTVD.pptx
SOCIAL AND HISTORICAL CONTEXT - LFTVD.pptxiammrhaywood
 
Concept of Vouching. B.Com(Hons) /B.Compdf
Concept of Vouching. B.Com(Hons) /B.CompdfConcept of Vouching. B.Com(Hons) /B.Compdf
Concept of Vouching. B.Com(Hons) /B.CompdfUmakantAnnand
 
Call Girls in Dwarka Mor Delhi Contact Us 9654467111
Call Girls in Dwarka Mor Delhi Contact Us 9654467111Call Girls in Dwarka Mor Delhi Contact Us 9654467111
Call Girls in Dwarka Mor Delhi Contact Us 9654467111Sapana Sha
 

Recently uploaded (20)

Organic Name Reactions for the students and aspirants of Chemistry12th.pptx
Organic Name Reactions  for the students and aspirants of Chemistry12th.pptxOrganic Name Reactions  for the students and aspirants of Chemistry12th.pptx
Organic Name Reactions for the students and aspirants of Chemistry12th.pptx
 
CARE OF CHILD IN INCUBATOR..........pptx
CARE OF CHILD IN INCUBATOR..........pptxCARE OF CHILD IN INCUBATOR..........pptx
CARE OF CHILD IN INCUBATOR..........pptx
 
Q4-W6-Restating Informational Text Grade 3
Q4-W6-Restating Informational Text Grade 3Q4-W6-Restating Informational Text Grade 3
Q4-W6-Restating Informational Text Grade 3
 
Mastering the Unannounced Regulatory Inspection
Mastering the Unannounced Regulatory InspectionMastering the Unannounced Regulatory Inspection
Mastering the Unannounced Regulatory Inspection
 
How to Make a Pirate ship Primary Education.pptx
How to Make a Pirate ship Primary Education.pptxHow to Make a Pirate ship Primary Education.pptx
How to Make a Pirate ship Primary Education.pptx
 
Arihant handbook biology for class 11 .pdf
Arihant handbook biology for class 11 .pdfArihant handbook biology for class 11 .pdf
Arihant handbook biology for class 11 .pdf
 
_Math 4-Q4 Week 5.pptx Steps in Collecting Data
_Math 4-Q4 Week 5.pptx Steps in Collecting Data_Math 4-Q4 Week 5.pptx Steps in Collecting Data
_Math 4-Q4 Week 5.pptx Steps in Collecting Data
 
Paris 2024 Olympic Geographies - an activity
Paris 2024 Olympic Geographies - an activityParis 2024 Olympic Geographies - an activity
Paris 2024 Olympic Geographies - an activity
 
BASLIQ CURRENT LOOKBOOK LOOKBOOK(1) (1).pdf
BASLIQ CURRENT LOOKBOOK  LOOKBOOK(1) (1).pdfBASLIQ CURRENT LOOKBOOK  LOOKBOOK(1) (1).pdf
BASLIQ CURRENT LOOKBOOK LOOKBOOK(1) (1).pdf
 
The Most Excellent Way | 1 Corinthians 13
The Most Excellent Way | 1 Corinthians 13The Most Excellent Way | 1 Corinthians 13
The Most Excellent Way | 1 Corinthians 13
 
Separation of Lanthanides/ Lanthanides and Actinides
Separation of Lanthanides/ Lanthanides and ActinidesSeparation of Lanthanides/ Lanthanides and Actinides
Separation of Lanthanides/ Lanthanides and Actinides
 
Measures of Central Tendency: Mean, Median and Mode
Measures of Central Tendency: Mean, Median and ModeMeasures of Central Tendency: Mean, Median and Mode
Measures of Central Tendency: Mean, Median and Mode
 
Industrial Policy - 1948, 1956, 1973, 1977, 1980, 1991
Industrial Policy - 1948, 1956, 1973, 1977, 1980, 1991Industrial Policy - 1948, 1956, 1973, 1977, 1980, 1991
Industrial Policy - 1948, 1956, 1973, 1977, 1980, 1991
 
Alper Gobel In Media Res Media Component
Alper Gobel In Media Res Media ComponentAlper Gobel In Media Res Media Component
Alper Gobel In Media Res Media Component
 
Introduction to ArtificiaI Intelligence in Higher Education
Introduction to ArtificiaI Intelligence in Higher EducationIntroduction to ArtificiaI Intelligence in Higher Education
Introduction to ArtificiaI Intelligence in Higher Education
 
Employee wellbeing at the workplace.pptx
Employee wellbeing at the workplace.pptxEmployee wellbeing at the workplace.pptx
Employee wellbeing at the workplace.pptx
 
Kisan Call Centre - To harness potential of ICT in Agriculture by answer farm...
Kisan Call Centre - To harness potential of ICT in Agriculture by answer farm...Kisan Call Centre - To harness potential of ICT in Agriculture by answer farm...
Kisan Call Centre - To harness potential of ICT in Agriculture by answer farm...
 
SOCIAL AND HISTORICAL CONTEXT - LFTVD.pptx
SOCIAL AND HISTORICAL CONTEXT - LFTVD.pptxSOCIAL AND HISTORICAL CONTEXT - LFTVD.pptx
SOCIAL AND HISTORICAL CONTEXT - LFTVD.pptx
 
Concept of Vouching. B.Com(Hons) /B.Compdf
Concept of Vouching. B.Com(Hons) /B.CompdfConcept of Vouching. B.Com(Hons) /B.Compdf
Concept of Vouching. B.Com(Hons) /B.Compdf
 
Call Girls in Dwarka Mor Delhi Contact Us 9654467111
Call Girls in Dwarka Mor Delhi Contact Us 9654467111Call Girls in Dwarka Mor Delhi Contact Us 9654467111
Call Girls in Dwarka Mor Delhi Contact Us 9654467111
 

(8) Lesson 9.4

  • 1. Course 3, Lesson 9-4 Use the make a graph strategy to solve the problems. For Exercises 1 and 2, use the bar graph at the right. 1. How many students are in the eighth grade? 2. What percentage of students does not play sports? 3. The graph shows the number of points scored for the first seven weeks of the football season. What type of association does the data show?
  • 2. Course 3, Lesson 9-4 ANSWERS 1. 219 students 2. 40.6% 3. no association
  • 3. HOW are patterns used when comparing two quantities? Statistics and Probability Course 3, Lesson 9-4
  • 4. Course 3, Lesson 9-4 Common Core State Standards © Copyright 2010. National Governors Association Center for Best Practices and Council of Chief State School Officers. All rights reserved. Statistics and Probability • Preparation for S.ID.1 Represent data with plots on the real number line (dot plots, histograms, and box plots). • Preparation for S.ID.2 Use statistics appropriate to the shape of the data distribution to compare center (median, mean) and spread (interquartile range, standard deviation) of two or more different data sets.
  • 5. Course 3, Lesson 9-4 Common Core State Standards © Copyright 2010. National Governors Association Center for Best Practices and Council of Chief State School Officers. All rights reserved. Statistics and Probability Mathematical Practices 1 Make sense of problems and persevere in solving them. 2 Reason abstractly and quantitatively. 3 Construct viable arguments and critique the reasoning of others. 4 Model with mathematics. 7 Look for and make use of structure.
  • 6. To • describe univariate data using measures of center, • measure quantitative data using a five-number summary Course 3, Lesson 9-4 . Statistics and Probability
  • 7. • univariate data • quantitative data • five-number summary Course 3, Lesson 9-4 Statistics and Probability
  • 8. 1 Need Another Example? 2 3 4 Step-by-Step Example 1. The ages, in years, of the people seated in one row of a movie theater are 16, 15, 24, 33, 30, 56, 19, and 19. Find the mean, median, mode, and range of the data set. Mean The mode is 19, since it is the number that occurs most often. Arrange in order from least to greatest.Median 15, 16, 19, 19, 24, 30, 33, 56 Mode 56 – 15 = 41Range
  • 9. Answer Need Another Example? The ages, in years, of the actors in a play are 5, 16, 32, 15, 26, and 32. Find the mean, median, mode, and range of the data set. mean: 21; median: 21; mode: 32; range: 27
  • 10. 1 Need Another Example? 2 3 5 Step-by-Step Example 2. The data for daily average temperatures for 15 days in May are shown in the table. a. Find the five-number summary of the data. b. Draw a box plot of the data. b. 68 69 70 71 72 72 73 74 75 75 75 75 76 76 76 minimum Draw the box plot and assign a title to the graph. Daily Temperatures a. Write the data from least to greatest. first quartile median third quartile maximum Draw a number line that includes the least and greatest numbers in the data. Mark the minimum and maximum values, the median, and the first and third quartiles above the number line. 4
  • 11. Answer Need Another Example? Find the five-number summary of the data. Draw a box plot of the data. minimum: 39.1; Q 1 : 59.25; median: 74.1; Q 3 : 81.4; maximum: 95.5
  • 12. How did what you learned today help you answer the How are patterns used when comparing two quantities? Course 3, Lesson 9-4 GeometryStatistics and Probability
  • 13. How did what you learned today help you answer the How are patterns used when comparing two quantities? Course 3, Lesson 9-4 GeometryStatistics and Probability Sample answers: • You can find the five-number summary of a set of univariate data. • Using the five-number summary, you can construct and analyze a box plot of the data.
  • 14. Write a set of directions for finding mean, median, mode, and range for a data set. Course 3, Lesson 9-4 Ratios and Proportional RelationshipsFunctionsStatistics and Probability