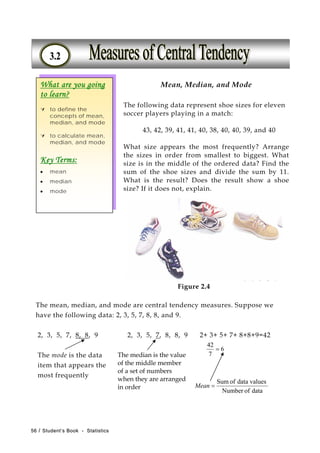
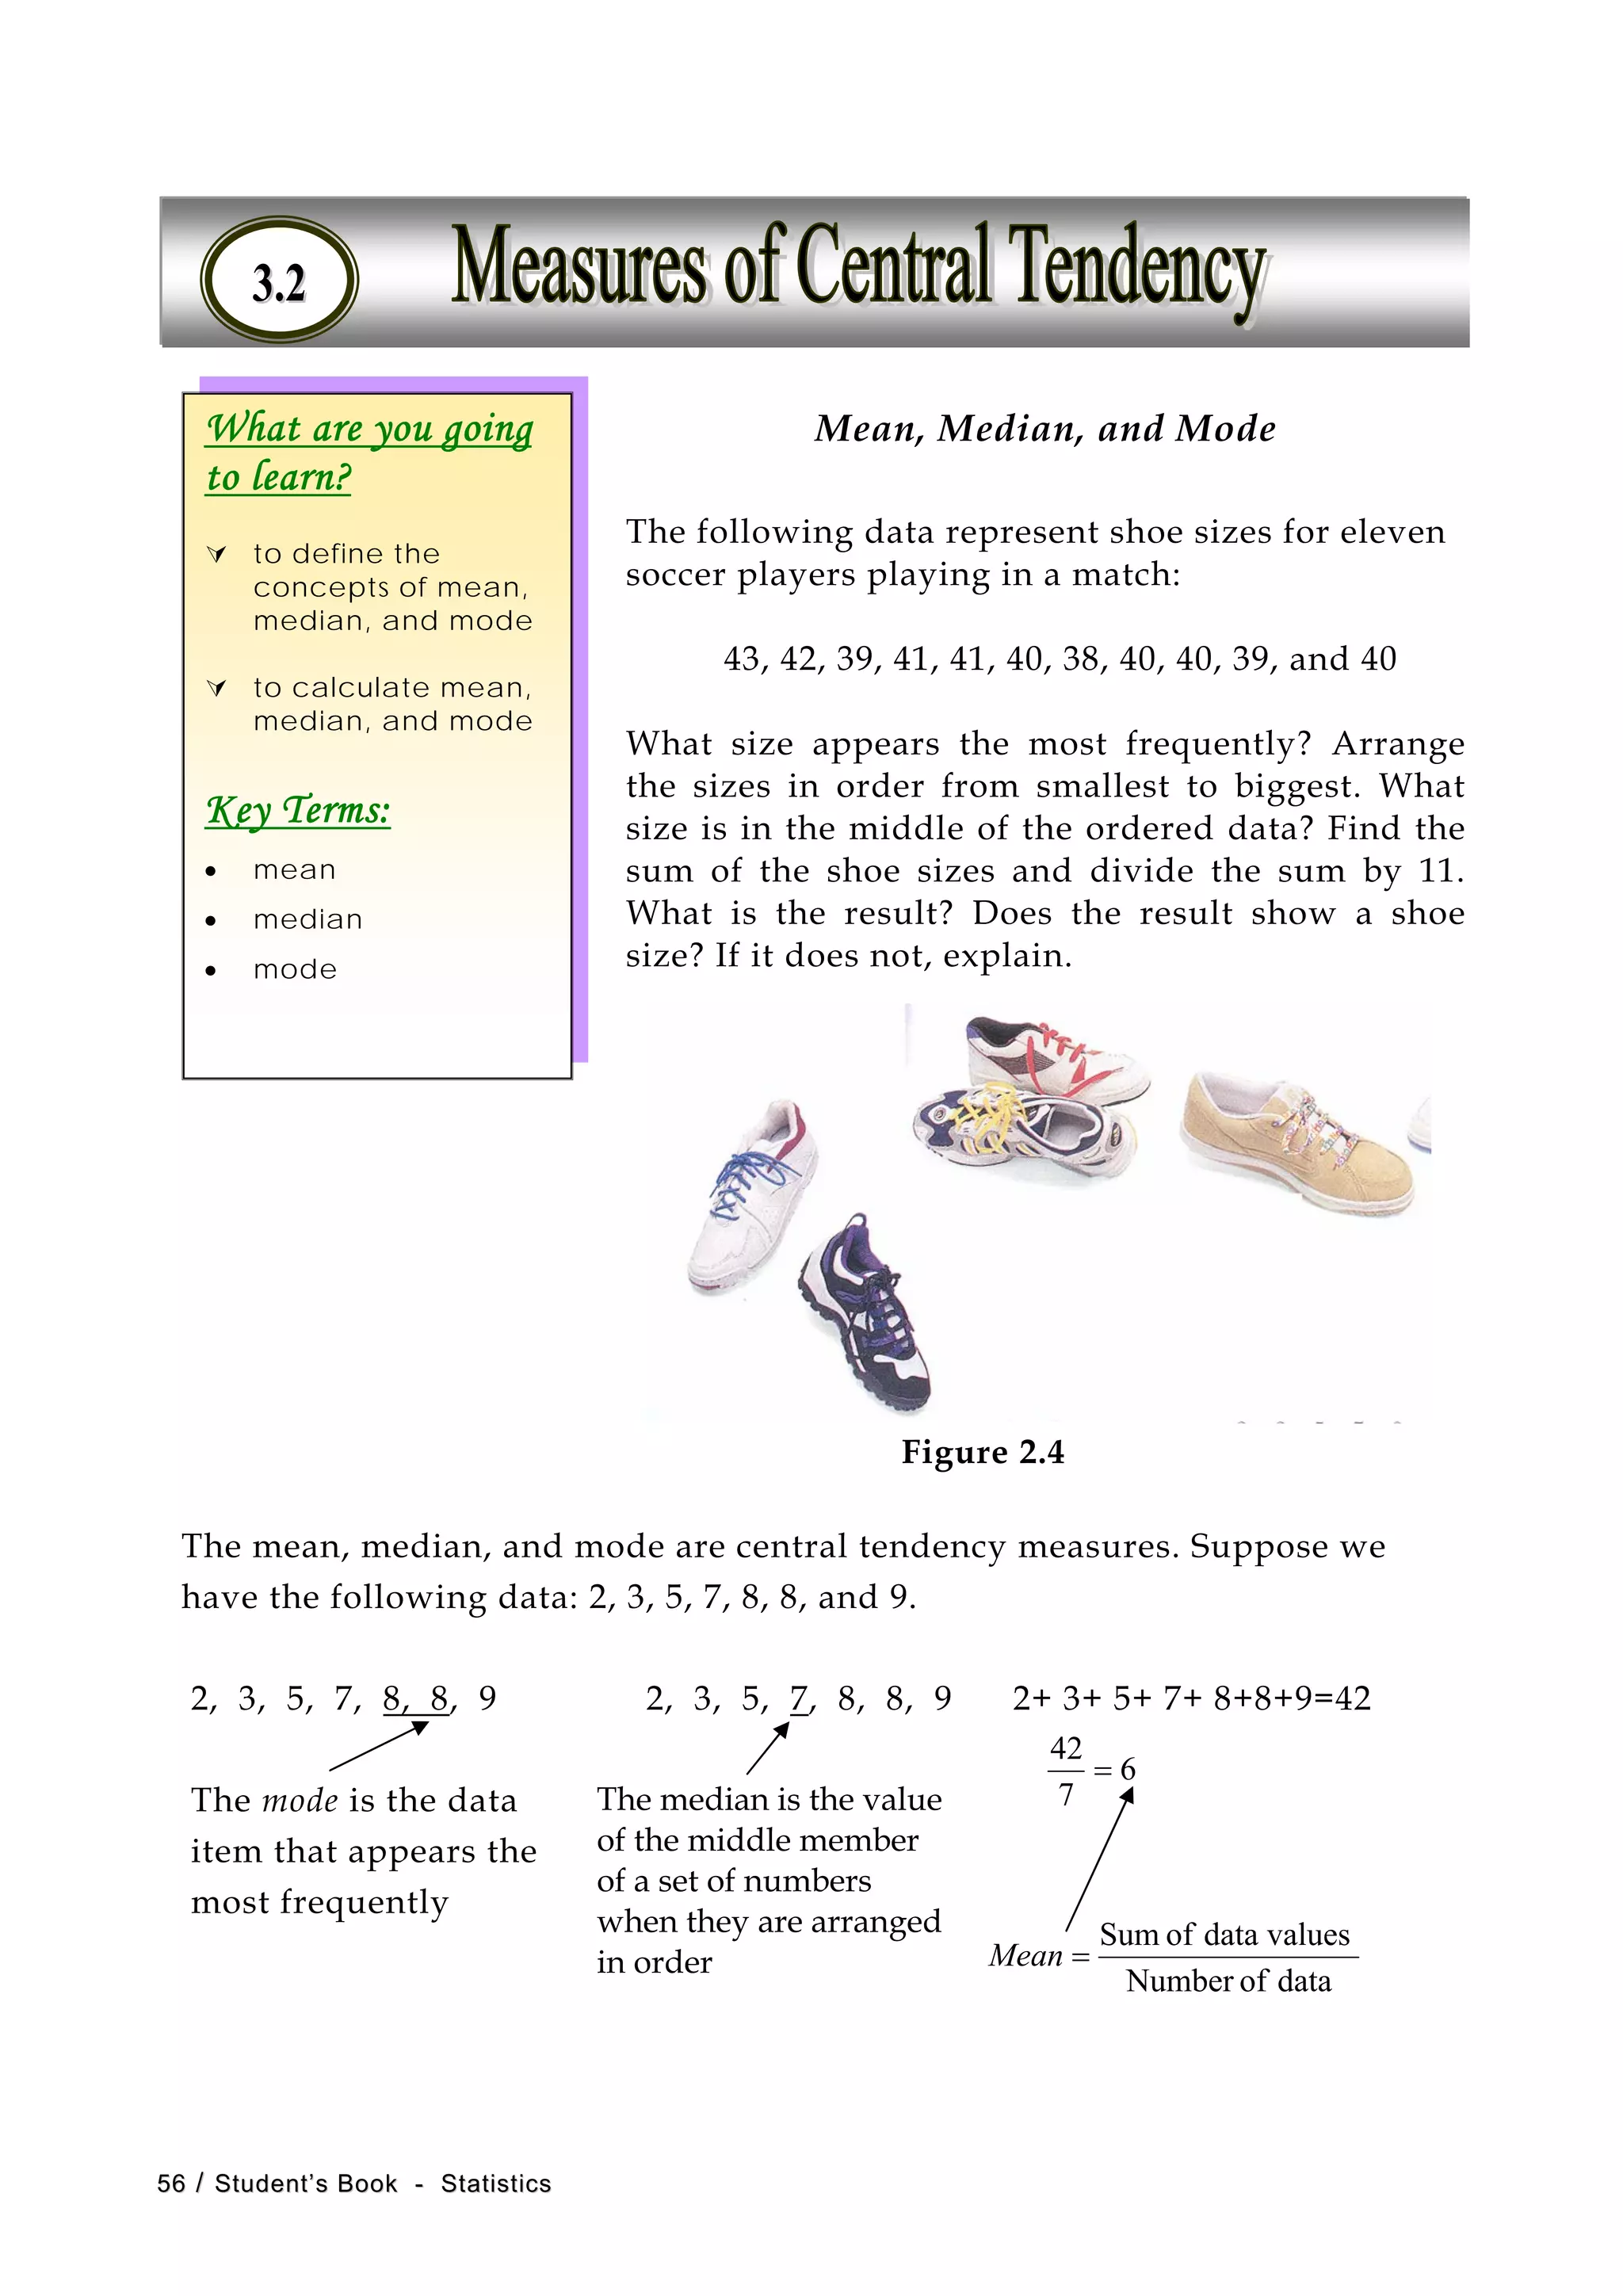
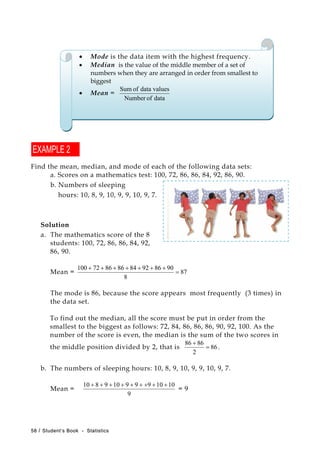
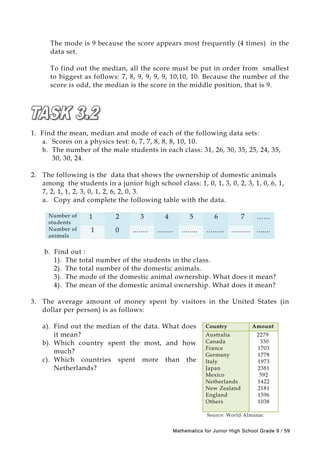
Transcript: New from BookNet Canada for 2024: BNC CataList - Tech Forum 2024
Chapter 3.2
1. Mean, Median, and Mode
The following data represent shoe sizes for eleven
soccer players playing in a match:
43, 42, 39, 41, 41, 40, 38, 40, 40, 39, and 40
What size appears the most frequently? Arrange
the sizes in order from smallest to biggest. What
size is in the middle of the ordered data? Find the
sum of the shoe sizes and divide the sum by 11.
What is the result? Does the result show a shoe
size? If it does not, explain.
The mean, median, and mode are central tendency measures. Suppose we
have the following data: 2, 3, 5, 7, 8, 8, and 9.
2, 3, 5, 7, 8, 8, 9
The mode is the data
item that appears the
most frequently
2, 3, 5, 7, 8, 8, 9
The median is the value
of the middle member
of a set of numbers
when they are arranged
in order
2+ 3+ 5+ 7+ 8+8+9=42
6
7
42
=
dataofNumber
valuesdataofSum
=Mean
What are you going
to learn?
to define the
concepts of mean,
median, and mode
to calculate mean,
median, and mode
Key Terms:
• mean
• median
• mode
33..22
Figure 2.4
5566 // SSttuuddeenntt’’ss BBooookk -- SSttaattiissttiiccss
2. Rate of Death in Surabaya
in 1999
Month Number
January
February
March
April
May
June
July
August
September
October
November
December
82
163
131
141
115
149
103
130
144
154
163
216
Source: Office of Civil
Affairs Surabaya
Figure 2.5
Find the mean, the median and
the mode of the data on the right
about the death rate in Surabaya in 1999.
Solution
a. To find the mean, find the sum of the data and then divide the sum
by 12 as follows:
12
21616315414413010314911514113116382 +++++++++++
= 1691/12 = 140.9167
b. To find the median, arrange the data in order from smallest to
biggest: 82, 103, 115, 130, 131, 141, 144, 149, 154, 163, 163, 216
5,142
2
144141 =+ Because the number of the data is even, the
median is determined by summing the two
data in the middle and then dividing the sum
by 2. Therefore, the median of the data is
142.5.
c. To find the mode, study the data in the table and find the data item
that appears the most frequently (the value that has the highest
frequency). Because number 163 appears twice, while the other
numbers appear only once, therefore, the mode of the data is 163.
MMaatthheemmaattiiccss ffoorr JJuunniioorr HHiigghh SScchhooooll GGrraaddee 99 // 5577
3. • Mode is the data item with the highest frequency.
• Median is the value of the middle member of a set of
numbers when they are arranged in order from smallest to
biggest
• Mean =
dataofNumber
valuesdataofSum
Find the mean, median, and mode of each of the following data sets:
a. Scores on a mathematics test: 100, 72, 86, 86, 84, 92, 86, 90.
b. Numbers of sleeping
hours: 10, 8, 9, 10, 9, 9, 10, 9, 7.
Solution
a. The mathematics score of the 8
students: 100, 72, 86, 86, 84, 92,
86, 90.
Mean = 87
8
90869284868672100
=
+++++++
The mode is 86, because the score appears most frequently (3 times) in
the data set.
To find out the median, all the score must be put in order from the
smallest to the biggest as follows: 72, 84, 86, 86, 86, 90, 92, 100. As the
number of the score is even, the median is the sum of the two scores in
the middle position divided by 2, that is 86
2
8686
=
+
.
b. The numbers of sleeping hours: 10, 8, 9, 10, 9, 9, 10, 9, 7.
Mean =
9
1010999109810 +++++++++
= 9
5588 // SSttuuddeenntt’’ss BBooookk -- SSttaattiissttiiccss
4. The mode is 9 because the score appears most frequently (4 times) in the
data set.
To find out the median, all the score must be put in order from smallest
to biggest as follows: 7, 8, 9, 9, 9, 9, 10,10, 10. Because the number of the
score is odd, the median is the score in the middle position, that is 9.
1. Find the mean, median and mode of each of the following data sets:
a. Scores on a physics test: 6, 7, 7, 8, 8, 8, 10, 10.
b. The number of the male students in each class: 31, 26, 30, 35, 25, 24, 35,
30, 30, 24.
2. The following is the data that shows the ownership of domestic animals
among the students in a junior high school class: 1, 0, 1, 3, 0, 2, 3, 1, 0, 6, 1,
7, 2, 1, 1, 2, 3, 0, 1, 2, 6, 2, 0, 3.
a. Copy and complete the following table with the data.
Number of
students
1 2 3 4 5 6 7 ……
Number of
animals
1 0 ........ ........ ........ ......... .......... .......
b. Find out :
1). The total number of the students in the class.
2). The total number of the domestic animals.
3). The mode of the domestic animal ownership. What does it mean?
4). The mean of the domestic animal ownership. What does it mean?
Country Amount
Australia
Canada
France
Germany
Italy
Japan
Mexico
Netherlands
New Zealand
England
Others
2279
330
1703
1778
1973
2381
592
1422
2181
1596
1038
Source: World Almanac
3. The average amount of money spent by visitors in the United States (in
dollar per person) is as follows:
a). Find out the median of the data. What does
it mean?
b). Which country spent the most, and how
much?
c). Which countries spent more than the
Netherlands?
MMaatthheemmaattiiccss ffoorr JJuunniioorr HHiigghh SScchhooooll GGrraaddee 99 // 5599