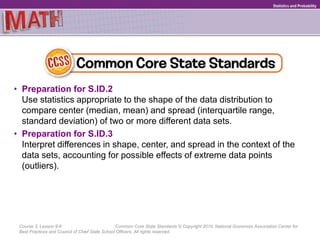
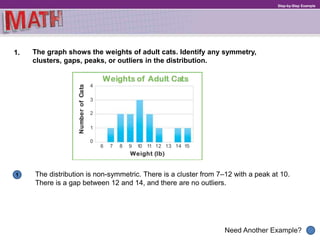
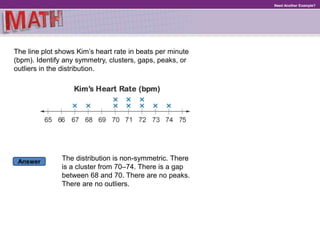
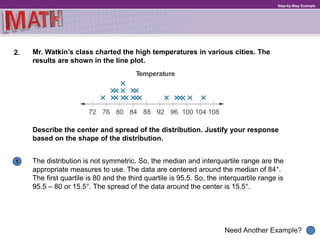
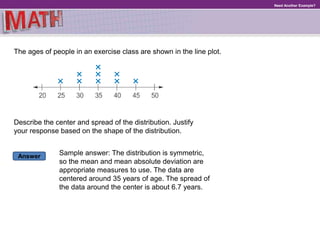
The document provides examples and explanations for describing distributions of data sets. It discusses identifying symmetry, clusters, gaps, peaks, and outliers. It explains that the median and interquartile range should be used to describe the center and spread of non-symmetric distributions, while the mean and mean absolute deviation can describe symmetric distributions. Students are told that patterns in distributions help compare two quantities and that describing distributions involves noting their shape, center, and spread.