This document discusses calculating the arithmetic mean of a data set. It provides examples of finding the mean goals scored by a hockey team and the mean number of times students bought lunch. The mean is calculated by summing all values and dividing by the total number of values. For data with frequencies, each value is multiplied by its frequency before summing. The document also reviews calculating the mean from frequency tables and lists of raw data values.

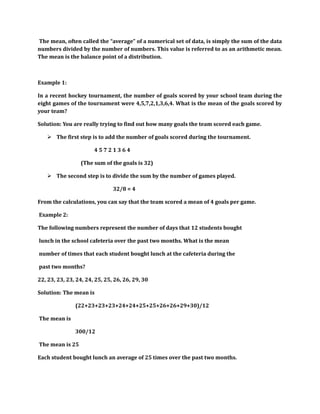
![If we let x represent the data numbers and n represent the number of numbers, we can write
a formula that can be used to calculate the mean x of the data. The symbol Σmeans “the sum
of”and can be used when we write a formula for calculating the mean.
Mean = [Σ(x1+x2+…+xn)]/n
Now, the mean can be calculated by multiplying each value by its frequency, adding these
results, and then dividing by the total number of values (the sum of the frequencies). The
formula that was written before can now be written to accommodate the values that
appeared more than once.
Mean =[ Σ(x1f1+x2f2+…+xnfn)/(f1+f2+…+fn)]
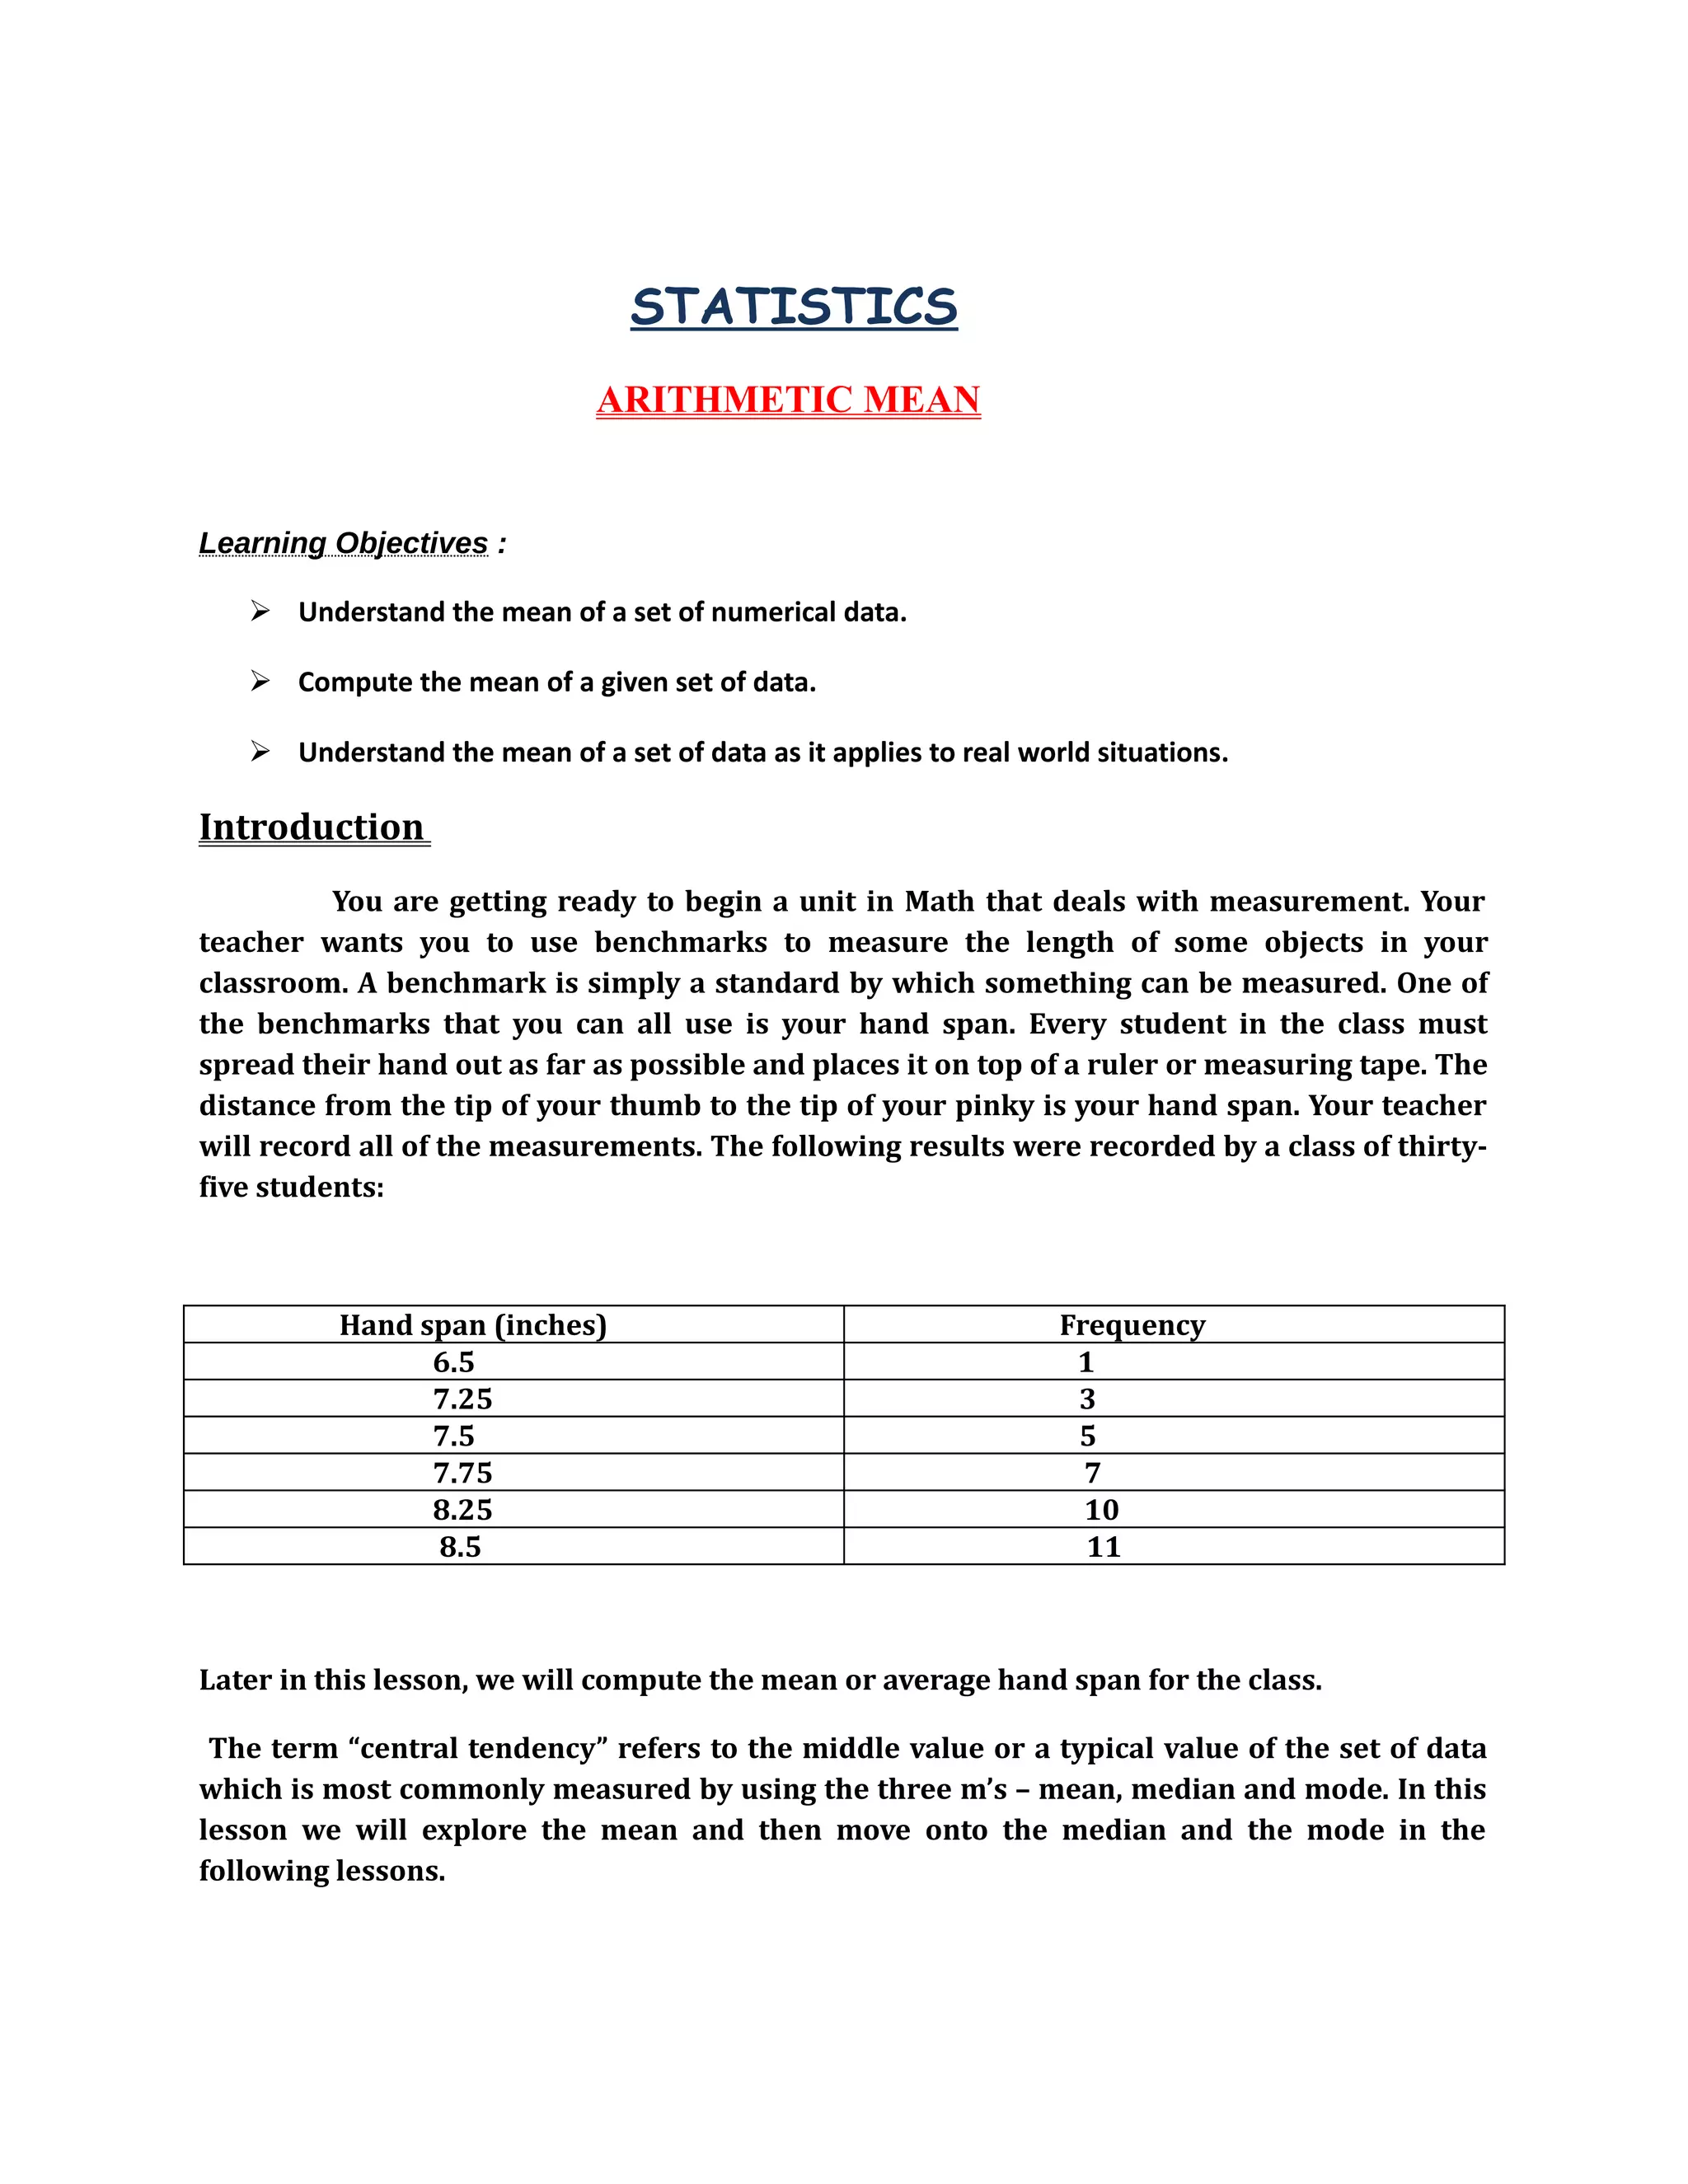
Now we will return to the problem that was posed at the beginning of the lesson – the one
that dealt with hand spans.
Hand span (inches) Frequency
6.5 1
7.25 3
7.5 5
7.75 7
8.25 10
8.5 11
Solution:
Mean = =[ Σ(x1f1+x2f2+…+xnfn)/(f1+f2+…+fn)]
= [6.5(1)+7.25(3)+7.5(5)+7.75(7)+8.25(10)+8.5(11)]/(1+3+5+7+10+11)
= 296/37
= 8
The mean hand span for 37 students is therefore 8 inches.
Lesson Summary
You have learned the significance of the mean as it applies to a set of numerical data. You
have also learned how to calculate the mean when the data is presented as a list of numbers
as well as when it is represented in a frequency table. To facilitate the process of calculating
the mean, you have also learned to apply the formulas necessary to do the calculations.](https://image.slidesharecdn.com/digitaltextbookstdix-140829092518-phpapp02/85/Digital-textbook-std-ix-3-320.jpg)