- The document discusses periodic functions and properties of the sine function.
- A periodic function repeats its values over regular intervals called periods. Trigonometric functions like sine are periodic with period 2π.
- The graph of y=sin(θ) is generated by plotting points (θ, sinθ) as an ant walks around the unit circle, with the arc length θ representing the angle and sinθ giving the vertical height. This traces out the familiar sine wave.
The document describes the graph of y=sin(θ). It explains that an ant runs counterclockwise around a unit circle, with the arc distance representing the angle θ. The height of the ant's position, sin(θ), is plotted for different values of θ to generate the sine wave graph. Key properties are that sin(θ) is periodic with period 2π, equals 0 when θ is a multiple of π, equals 1 when θ is π/2 plus a multiple of 2π, and equals -1 when θ is -π/2 plus a multiple of 2π. The graph is symmetric across the origin due to the property that sin(-θ) equals -sin(θ).
07 periodic functions and fourier seriesKrishna Gali
This document discusses periodic functions and Fourier series. A periodic function repeats its values over a time period. The Fourier series represents a periodic function as an infinite sum of trigonometric terms (sines and cosines). The coefficients in the Fourier series (an and bn) can be determined by integrating the function multiplied by trigonometric terms over one period. Even functions can be represented by cosine terms alone, while odd functions use sine terms alone. The number of terms needed for an accurate representation depends on the function.
Its states Periodic function, Fourier series for disontinous function, Fourier series, Intervals, Odd and even functions, Half range fourier series etc. Mostly used as active learning assignment in Degree 3rd sem students.
The document discusses Fourier series and their applications. It provides the general forms of the Fourier series for even and odd functions over a periodic interval. The key points are:
- Fourier series can be used to represent functions as an infinite sum of sines and cosines, known as harmonic analysis.
- They have wide applications in fields like signal processing, vibrations, and heat transfer.
- The Fourier series for an even function contains only cosine terms, while an odd function contains only sine terms.
- The Fourier coefficients are found using the orthogonal properties of sines and cosines and integrating the function over the period.
1) The document provides review material for Exam 3 of Math 285 including definitions of piecewise continuous and piecewise smooth functions and the convergence theorem for Fourier series.
2) It also defines Fourier series for periodic piecewise continuous functions and discusses Fourier sine and cosine series for odd and even functions.
3) Applications of Fourier series include using them to find formal solutions to boundary value problems involving differential equations.
The document discusses Fourier series and two of their applications. Fourier series can be used to represent periodic functions as an infinite series of sines and cosines. This allows approximating functions that are not smooth using trigonometric polynomials. Two key applications are representing forced oscillations, where a periodic driving force can be modeled as a Fourier series, and solving the heat equation, where the method of separation of variables results in a Fourier series representation of temperature over space and time.
Topic: Fourier Series ( Periodic Function to change of interval)Abhishek Choksi
The document discusses Fourier series and their properties. Fourier series can be used to represent periodic functions as an infinite sum of sines and cosines. The key points are:
- Fourier series can represent functions over any interval length by transforming the variable.
- Examples show how to calculate the Fourier coefficients for specific functions over given intervals.
- The Fourier series representation allows periodic functions to be broken down into their constituent trigonometric components.
Unit 2 analysis of continuous time signals-mcq questionsDr.SHANTHI K.G
The document discusses key concepts regarding continuous time signals and their analysis using Fourier transforms. Some key points covered include:
- The trigonometric Fourier series of an even function contains only cosine terms, while an odd function contains only sine terms. A half-wave symmetric signal contains only odd harmonic terms.
- For a signal to be represented by a Fourier series, it must satisfy Dirichlet conditions such as being absolutely integrable over its period.
- The Fourier transform of a continuous time signal x(t) is defined as X(jω)=∫x(t)e-jωtdt from -∞ to ∞. The inverse Fourier transform is defined as x(t)=1
The document discusses recurrence relations for Legendre polynomials. It presents 6 recurrence relations and provides proofs of each one. The relations involve differentiation and combinations of Legendre polynomials of different orders. The proofs use properties of Legendre polynomials and differntiate, combine, and manipulate the recurrence relations to derive new ones.
This document introduces Fourier series and their motivation. Joseph Fourier realized that many physical phenomena, like heat diffusion, could be modeled using partial differential equations. He developed a method of separation of variables to solve these equations, which led him to represent functions as infinite sums of sines and cosines, now known as Fourier series. The document outlines Fourier's approach, showing how assuming a solution of the form of separated variables leads to an eigenvalue problem. The eigenfunctions form a basis to represent more general functions as Fourier series. The Fourier coefficients that define a particular function can be determined by integrating the function against the eigenfunctions.
This MATLAB code provides an example of plotting a truncated Fourier series representation of a square wave signal. It computes the Fourier series in both complex exponential form (yce) and trigonometric form (yt) up to the Nth term, where N is an odd integer. It plots the original square wave, the truncated Fourier series approximations yce and yt, and their amplitude and phase spectra. The code demonstrates how to calculate and visualize truncated Fourier series representations of a periodic signal.
Fourier series can be used to represent periodic and discontinuous functions. The document discusses:
1. The Fourier series expansion of a sawtooth wave, showing how additional terms improve the accuracy of the representation.
2. How Fourier series are well-suited to represent periodic functions over intervals like [0,2π] since the basis functions are also periodic.
3. An example of using Fourier series to analyze a square wave, finding the coefficients for its expansion in terms of sines and cosines.
1) The document provides the proof of the Master Theorem for analyzing divide-and-conquer recurrences.
2) It introduces key lemmas used in the proof, including bounding the contribution of subproblem sizes.
3) The proof considers three cases depending on how the work at each level relates to the decrease in problem size, showing the recurrence has a runtime of O(nlogba), O(nklogn), or O(nk) respectively.
This document discusses step functions and their Laplace transforms. It defines the unit step function uc(t) and negative step function -uty(c). Translating a function f(t) by c units results in the function g(t)=uc(t)f(t-c). The Laplace transform of uc(t) is 1/s. Translating f(t) corresponds to multiplying F(s) by e-cs in the Laplace domain. Several examples demonstrate finding the Laplace transform and inverse Laplace transform of functions involving step functions.
This document discusses Fourier series and their applications. It contains the following key points:
1. Fourier introduced Fourier series to solve heat equations through metal plates, expressing functions as infinite sums of sines and cosines.
2. Sine and cosine functions are orthogonal and periodic, allowing any piecewise continuous periodic function to be represented by a Fourier series.
3. The Euler-Fourier formulas relate the Fourier coefficients to the function, allowing the coefficients to be determined.
4. Even functions only have cosine terms, odd only sine, and the Fourier series converges to the average at discontinuities for piecewise continuous functions.
The document discusses asymptotic notation and its use in analyzing algorithms. It introduces big-O, big-Theta, and big-Omega notation to describe the asymptotic growth rates of functions. These notations are defined precisely using limits. Examples are given to illustrate how functions can be classified based on their rate of growth. Properties like transitivity and symmetry of the notations are covered. Common functions like polynomials, logarithms, and exponentials are discussed in terms of asymptotic notation.
1) The document outlines a stochastic approach to modeling warm inflation, where inflation occurs in the presence of radiation.
2) It discusses using a Langevin equation to describe the dynamics of the inflaton field interacting with other fields, resulting in the production of radiation during inflation.
3) The approach uses a Fokker-Planck equation to model the probability distribution of the inflaton field, transforming it into a Schrodinger-like equation with an effective potential that incorporates the effects of radiation on the inflationary dynamics.
The document discusses Hermite integrators and Riordan arrays. It provides:
1) An overview of a general form for the correctors of a family of 2-step Hermite integrators that achieve 2(p+1)-th order accuracy by directly calculating up to the p-th order derivative of the force.
2) Details on constructing Hermite integrators by solving a linear equation to determine the coefficients, with an example of a 6th order integrator.
3) An outline of the proof for the general form of the coefficients, which involves setting up a differential recurrence relation and solving a linear system using LU decomposition, with the proof of the inverse matrices later shown using Riordan arrays.
Mathematics (from Greek μάθημα máthēma, “knowledge, study, learning”) is the study of topics such as quantity (numbers), structure, space, and change. There is a range of views among mathematicians and philosophers as to the exact scope and definition of mathematics
The Fourier transform decomposes a signal into its constituent frequencies, representing it in the frequency domain rather than the spatial domain, which can make certain operations and analyses easier to perform; it has both magnitude and phase components that provide information about the frequency content and relative phases of the signal. The discrete Fourier transform (DFT) is a sampled version of the continuous Fourier transform that is useful for digital signal and image processing applications.
The document discusses graphs in polar coordinates. It begins by reviewing how polar coordinates (r, θ) represent a point P, where r is the distance from the origin and θ is the angle relative to the x-axis. It then discusses how to convert between rectangular (x, y) and polar (r, θ) coordinates. The document explains that polar equations relate r and θ, giving the example of r = θ which graphs as an Archimedean spiral. It also discusses the graphs of constant equations like r = c, which is a circle, and θ = c, which is a line. The document concludes by explaining how to graph other polar equations by plotting points.
The document discusses the Fourier series representation of periodic functions with an arbitrary period. It provides the general form of the Fourier series for a function f(x) with period 2L, defined over the interval c < x < c + 2L. It also gives the specific forms when c = 0, -L, or L. An example of finding the Fourier series of the function f(x) = x^2 from 0 to 2 is worked out step-by-step.
Convergence methods for approximated reciprocal and reciprocal-square-rootKeigo Nitadori
This document discusses convergence methods for approximating reciprocal (1/x) and reciprocal-square-root (1/√x) values using polynomials expanded in a Taylor series. It presents the general forms for reciprocal and reciprocal-square-root approximations up to eighth order. For reciprocal-square-root, the well-known Newton-Raphson method and its optimized form for fused multiply-add hardware are described. Examples for other functions like reciprocal-cube-root are also provided. Higher order methods are noted to require more registers for coefficient storage.
The document discusses techniques for parameter selection and sensitivity analysis when estimating parameters from observational data. It introduces local sensitivity analysis based on derivatives to determine how sensitive model outputs are to individual parameters. Global sensitivity analysis techniques like ANOVA (analysis of variance) are also discussed, which quantify how parameter uncertainties contribute to uncertainty in model outputs. The ANOVA approach uses a Sobol decomposition to represent models as sums of parameter main effects and interactions, allowing variance-based sensitivity indices to be defined that quantify the influence of individual parameters and groups of parameters.
Poster for Bayesian Statistics in the Big Data Era conferenceChristian Robert
The document proposes a new version of Hamiltonian Monte Carlo (HMC) sampling that is essentially calibration-free. It achieves this by learning the optimal leapfrog scale from the distribution of integration times using the No-U-Turn Sampler algorithm. Compared to the original NUTS algorithm on benchmark models, this new enhanced HMC (eHMC) exhibits significantly improved efficiency with no hand-tuning of parameters required. The document tests eHMC on a Susceptible-Infected-Recovered model of disease transmission.
The document discusses recurrences and the master theorem for finding asymptotic bounds of recursive equations. It covers the substitution method, recursive tree method, and master theorem. The master theorem provides bounds for recurrences of the form T(n) = aT(n/b) + f(n) based on comparing f(n) to nlogba. It also discusses exceptions, gaps in the theorem, and proofs of the main results.
The document discusses periodic functions and their properties. The key points are:
- A periodic function f(x) satisfies f(x) = f(x + T) for some fixed period T and all real x.
- Periodic functions repeat their values at intervals of their period, including integer multiples of the period.
- Functions are defined as even if f(-x) = f(x) and odd if f(-x) = -f(x).
- Several important formulas are provided for integrating exponential and trigonometric functions.
t5 graphs of trig functions and inverse trig functionsmath260
The document discusses the benefits of exercise for mental health. Regular physical activity can help reduce anxiety and depression and improve mood and cognitive functioning. Exercise causes chemical changes in the brain that may help protect against mental illness and improve symptoms.
Graphing Trig Functions-Tangent and Cotangent.pptReyRoluna1
1. The document discusses trigonometric functions including sine, cosine, tangent, and cotangent. It defines their domains, ranges, and periodic behavior.
2. Key aspects covered include the definitions of radians, amplitude and period as they relate to graphing trig functions. Properties like symmetry, maximum and minimum values are also addressed.
3. Examples are provided of graphing trig functions based on their period and any vertical asymptotes. Conversions between trig function notations are also demonstrated.
The document discusses the unit circle and trigonometric functions. It provides information on:
- The initial and terminal sides of angles on the unit circle
- The values of sine, cosine, and tangent in each quadrant of the unit circle
- Using Pythagorean theorem to determine values on the unit circle
- Definitions of sine, cosine, and tangent in terms of the x- and y-coordinates on the unit circle
- Rules for transforming basic sine and cosine functions
- Steps for solving trigonometric equations by taking the inverse sine or cosine of both sides.
It is a new theory based on an algorithmic approach. Its only element
is called nokton. These rules are precise. The innities are completely
absent whatever the system studied. It is a theory with discrete space
and time. The theory is only at these beginnings.
11. amplitude, phase shift and period of trig formulas-xmath260
The document discusses amplitude, period, and phase shift of waves. It defines amplitude as the distance from the waistline of a wave to its peak or trough. Period is the length of time or space for a wave to complete one cycle. Vertically stretching or compressing a sine or cosine graph changes its amplitude. Horizontally compressing or stretching changes its period. For example, y=sin(2x) has half the period of y=sin(x) because as x varies from 0 to π, 2x varies from 0 to 2π, compressing the wave horizontally.
The document discusses parametric equations, which describe the motion of a particle in a plane by giving its position (x, y) at time t as functions of t, known as parametric equations. Examples are provided of parametric equations defining circles, ellipses, and other curves. The parameter does not need to be time. Slopes of parametric curves can be found from the derivatives of the parametric equations with respect to t. Standard parameterizations of functions y=f(x) are also discussed.
This document defines and provides examples of curves and parametrized curves. It discusses regular and unit-speed curves. The key points are:
i) A parametrized curve is a continuous function from an interval to Rn. Examples of parametrized curves include ellipses, parabolas, and helices.
ii) A regular curve is one where the derivative of the parametrization is never zero. A unit-speed curve has a derivative of constant length 1.
iii) The arc-length of a curve is defined as the integral of the derivative of the parametrization. Any reparametrization of a regular curve is also regular. A curve has a unit-
TIU CET Review Math Session 6 - part 2 of 2youngeinstein
1. The document provides a review of math concepts for a college entrance exam, including functions, trigonometric functions, exponential and logarithmic functions.
2. It reviews concepts like evaluating functions, adding and composing functions, finding roots and intercepts of functions, and properties of trigonometric, exponential and logarithmic functions.
3. The document provides examples and problems to solve related to these various math concepts as a study guide for the exam.
This document provides notation and details on a sinogram interpolation technique. It begins by defining notation for continuous and discrete indices used to represent images and sinograms. It then describes how sinograms are formed from images through the forward Radon transform, representing projections of an image at different angles. Warps are introduced as weighted cosine waves that pass through sinogram elements, with conditions defined for valid warps. The algorithm steps are outlined as calculating warp properties from the original image, setting up an equation system to solve for warp weights, and reconstructing sinogram columns from the warps. The technique aims to improve blurry sinograms by exploiting known image properties represented by the warps.
02Application of Derivative # 1 (Tangent & Normal)~1 Module-4.pdfRajuSingh806014
If y = f(x) be a given function, then the differential coefficient f' (x) or dy at the point P (x , y ) is
(i) If the tangent at P (x1,y1) of the curve y = f(x) is parallel to the x- axis (or perpendicular to y- axis) then = 0 i.e. its slope will be
zero.
FGdy J
dx 1 1
m = H K = 0
the trigonometrical tangent of the angle (say) which the positive direction of the tangent to the curve at P makes with the positive direction of x- axis Gdy J, therefore represents the slope of the
tangent. Thus
dx (x1,y1)
The converse is also true. Hence the tangent at (x1,y1) is parallel to x- axis.
GJ = 0
(x1,y1)
(ii) If the tangent at P (x , y ) of the curve y =
1 1
f (x) is parallel to y - axis (or perpendicular
to x-axis) then = / 2 , and its slope will be infinity i.e.
dy
m = =
dx (x ,y )
The converse is also true. Hence the tangent at (x1, y1) is parallel to y- axis
Fdy
(x1,y1)
Thus
(i) The inclination of tangent with x- axis.
dy
(iii) If at any point P (x1, y1) of the curve y = f(x), the tangent makes equal angles with the
axes, then at the point P, = / 4 or 3 / 4 ,
= tan–1
GHdxJK
Hence at P, tan = dy/dx = 1. The
(ii) Slope of tangent = dy
dx
(iii) Slope of the normal = – dx/dy
Ex.1 Find the following for the curve y2 = 4x at point (2,–2)
(i) Inclination of the tangent
(ii) Slope of the tangent
(iii) Slope of the normal
Sol. Differentiating the given equation of curve, we get dy/dx = 2/y = –1 at (2,–2)
so at the given point.
(i) Inclination of the tangent = tan–1(–1) = 135º
(ii) Slope of the tangent = –1
(iii) Slope of the normal = 1
converse of the result is also true. thus at
(x1,y1) the tangent line makes equal angles with the axes.
GJ = 1
(x1,y1)
Ex.2 The equation of tangent to the curve y2 = 6x at (2, – 3).
(A) x + y – 1 = 0 (B) x + y + 1 = 0 (C) x – y + 1 = 0 (D) x + y + 2 = 0
Sol. Differentiating equation of the curve with respect to x
(a) Equation of tangent to the curve y = f(x) at A (x1,y1) is
2y dy = 6
dx
FGdy J
dx (2,3)
= 3 = –1
3
y – y1 =
FGdy J
(x1,y1)
(x–x1)
Therefore equation of tangent is y + 3 = – (x – 2)
x + y + 1 = 0 Ans. [B]
Ex.3 The equation of tangent at any of the curve x = at2, y = 2at is -
(A) x = ty + at2 (B) ty + x + at2 = 0
(C) ty = x + at2 (D) ty = x + at3
2 a 1
Sol. dy/dx = (dy/dt)/(dx/dt) = 2 at = t
equation of the tangent at (x,y) point is
(y – 2 at) = 1 (x – at2)
t
ty = x + at2 Ans.[C]
Ex.4 The equation of the tangent to the curve x2 (x – y) + a2 (x + y) = 0 at origin is-
(A) x + y + 1 = 0 (B) x + y + 2 = 0 (C) x + y = 0 (D) 2x – y = 0
Sol. Differentiating equation of the curve w.r.t. x
dy/dx = – y x
(i) If tangent line is parallel to x - axis, then dy/dx = 0 y = 0 and x = a
Thus the point is (a,0)
(ii) If tangent is parallel to y – axis , then dy/dx = x = 0 and y = a
Thus the point is (0,a)
(iii) If tangent line makes equal angles with both axis , then dy/dx = 1
y =
Find the compact trigonometric Fourier series for the periodic signal.pdfarihantelectronics
Find the compact trigonometric Fourier series for the periodic signal x(t) and sketch the
amplitude and phase spectrum for first 4 frequency components. By inspection of the spectra,
sketch the exponential Fourier spectra. By inspection of spectra in part b), write the exponential
Fourier series for x(t)
Solution
ECE 3640 Lecture 4 – Fourier series: expansions of periodic functions. Objective: To build upon
the ideas from the previous lecture to learn about Fourier series, which are series representations
of periodic functions. Periodic signals and representations From the last lecture we learned how
functions can be represented as a series of other functions: f(t) = Xn k=1 ckik(t). We discussed
how certain classes of things can be built using certain kinds of basis functions. In this lecture we
will consider specifically functions that are periodic, and basic functions which are
trigonometric. Then the series is said to be a Fourier series. A signal f(t) is said to be periodic
with period T0 if f(t) = f(t + T0) for all t. Diagram on board. Note that this must be an everlasting
signal. Also note that, if we know one period of the signal we can find the rest of it by periodic
extension. The integral over a single period of the function is denoted by Z T0 f(t)dt. When
integrating over one period of a periodic function, it does not matter when we start. Usually it is
convenient to start at the beginning of a period. The building block functions that can be used to
build up periodic functions are themselves periodic: we will use the set of sinusoids. If the period
of f(t) is T0, let 0 = 2/T0. The frequency 0 is said to be the fundamental frequency; the
fundamental frequency is related to the period of the function. Furthermore, let F0 = 1/T0. We
will represent the function f(t) using the set of sinusoids i0(t) = cos(0t) = 1 i1(t) = cos(0t + 1)
i2(t) = cos(20t + 2) . . . Then, f(t) = C0 + X n=1 Cn cos(n0t + n) The frequency n0 is said to be
the nth harmonic of 0. Note that for each basis function associated with f(t) there are actually two
parameters: the amplitude Cn and the phase n. It will often turn out to be more useful to
represent the function using both sines and cosines. Note that we can write Cn cos(n0t + n) = Cn
cos(n) cos(n0t) Cn sin(n)sin(n0t). ECE 3640: Lecture 4 – Fourier series: expansions of periodic
functions. 2 Now let an = Cn cos n bn = Cn sin n Then Cn cos(n0t + n) = an cos(n0t) + bn
sin(n0t) Then the series representation can be f(t) = C0 + X n=1 Cn cos(n0t + n) = a0 + X n=1 an
cos(n0t) + bn sin(n0t) The first of these is the compact trigonometric Fourier series. The second
is the trigonometric Fourier series.. To go from one to the other use C0 = a0 Cn = p a 2 n + b 2 n
n = tan1 (bn/an). To complete the representation we must be able to compute the coefficients.
But this is the same sort of thing we did before. If we can show that the set of functions
{cos(n0t),sin(n0t)} is in fact an orthogonal set, then we can use the same.
The document discusses frequency response analysis of control systems. It defines frequency response as the amplitude and phase differences between the input and output sinusoids of a linear system subjected to a sinusoidal input. Frequency response consists of magnitude frequency response and phase frequency response. The document provides examples of using frequency response concepts like plotting Bode diagrams, calculating key points on Nyquist diagrams, and using the Nyquist criterion to determine stability.
The document provides an overview of circular functions and trigonometry. It discusses the properties of sine, cosine, and tangent graphs, including their periodic nature, amplitude, and period. Students are expected to learn to graph these functions, describe their properties, and solve trigonometric equations. The document also contains examples and practice problems related to these objectives.
The document discusses the unit circle and trigonometric functions. It defines the unit circle as having a radius of 1 unit and center at the origin (0,0). The equation of the unit circle is provided as x2 + y2 = 1. Quadrantal angles are defined as angles whose terminal rays lie along one of the axes at 90°, 180°, 270°, and 360°. Trigonometric functions are defined in terms of the x- and y-coordinates on the unit circle. Special right triangles and their properties are also discussed.
1. Match the right triangle definition with its trigonometric fu.docxjoyjonna282
1. Match the right triangle definition with its trigonometric function.
(a)
hyp
adj
=
(b)
opp
adj
=
(c)
opp
hyp
=
(d)
adj
opp
=
(e)
hyp
opp
=
(f)
adj
hyp
=
2. Fill in the blanks.
Relative to the acute angle θ, the three sides of a right triangle are the , the side, and the side.
3. Use the figure to answer the question.
What is the length of the side opposite the angle θ?
4. Use the figure to answer the question.
What is the length of the side adjacent to the angle θ?
5. Use the figure to answer the question.
What is the length of the hypotenuse?
6. Find the exact values of the six trigonometric functions of the angle θ shown in the figure. (Use the Pythagorean Theorem to find the third side of the triangle. Let b = 3 and c = 5.)
sin(θ)
=
cos(θ)
=
tan(θ)
=
csc(θ)
=
sec(θ)
=
cot(θ)
=
7. Find the exact values of the six trigonometric functions of the angle θ shown in the figure. (Use the Pythagorean Theorem to find the third side of the triangle.)
sin θ
=
cos θ
=
tan θ
=
csc θ
=
sec θ
=
cot θ
=
8. Sketch a right triangle corresponding to the trigonometric function of the acute angle θ. Use the Pythagorean Theorem to determine the third side and then find the other five trigonometric functions of θ.
cos θ =
6
8
sin θ
=
tan θ
=
csc θ
=
sec θ
=
cot θ
=
9. Sketch a right triangle corresponding to the trigonometric function of the acute angle θ. Use the Pythagorean Theorem to determine the third side and then find the other five trigonometric functions of θ.
csc θ =
13
3
sin θ
=
cos θ
=
tan θ
=
sec θ
=
cot θ
=
10. Construct an appropriate triangle to complete the table. (0 ≤ θ ≤ 90°, 0 ≤ θ ≤ π/2)
Function
θ (deg)
θ (rad)
Function Value
cos
135°
11. Construct an appropriate triangle to complete the table. (0 ≤ θ ≤ 90°, 0 ≤ θ ≤ π/2)
Function
θ (deg)
θ (rad)
Function Value
sec
°
π
4
12. Construct an appropriate triangle to complete the table. (0 ≤ θ ≤ 90°, 0 ≤ θ ≤ π/2)
Function
θ (deg)
θ (rad)
Function Value
sin
°
0
13. Complete the identity.
sin θ =
1
14. Complete the identity.
cos θ =
1
15. Complete the identity.
csc θ =
1
16. Complete the identity.
cot θ =
1
17. Complete the identity.
1 + tan2 θ =
18. Complete the identity.
sin(90° − θ) =
19. Complete the identity.
cos(90° − θ) =
20. Use the given function values, and trigonometric identities (including the cofunction identities), to find the indicated trigonometric functions.
sin(30°) =
1
2
, tan(30°) =
3
3
(a) csc(30°) =
(b) cot(60°) =
(c) cos(30°) =
(d) cot(30°) =
21. Use the given function value and the trigonometric identities to find the indicated trigonometric functions.
tan β = 8
(a) cot β
...
The document provides an overview of Calculus I taught by Professor Matthew Leingang at New York University. It outlines key topics that will be covered in the course, including different classes of functions, transformations of functions, and compositions of functions. The first assignments are due on January 31 and February 2, with first recitations on February 3. The document uses examples to illustrate concepts like linear functions, other polynomial functions, and trigonometric functions. It also explains how vertical and horizontal shifts can transform the graph of a function.
Lesson 2: A Catalog of Essential Functions (slides)Matthew Leingang
This document provides an overview of different types of functions including: linear, polynomial, rational, power, trigonometric, and exponential functions. It discusses representing functions verbally, numerically, visually, and symbolically. Key topics covered include transformations of functions through shifting graphs vertically and horizontally, as well as composing multiple functions.
I am Bing Jr. I am a Signal Processing Assignment Expert at matlabassignmentexperts.com. I hold a Master's in Matlab Deakin University, Australia. I have been helping students with their assignments for the past 9 years. I solve assignments related to Signal Processing.
Visit matlabassignmentexperts.com or email info@matlabassignmentexperts.com. You can also call on +1 678 648 4277 for any assistance with Signal Processing Assignments.
Exploiting Artificial Intelligence for Empowering Researchers and Faculty, In...Dr. Vinod Kumar Kanvaria
Exploiting Artificial Intelligence for Empowering Researchers and Faculty,
International FDP on Fundamentals of Research in Social Sciences
at Integral University, Lucknow, 06.06.2024
By Dr. Vinod Kumar Kanvaria
it describes the bony anatomy including the femoral head , acetabulum, labrum . also discusses the capsule , ligaments . muscle that act on the hip joint and the range of motion are outlined. factors affecting hip joint stability and weight transmission through the joint are summarized.
Chapter wise All Notes of First year Basic Civil Engineering.pptxDenish Jangid
Chapter wise All Notes of First year Basic Civil Engineering
Syllabus
Chapter-1
Introduction to objective, scope and outcome the subject
Chapter 2
Introduction: Scope and Specialization of Civil Engineering, Role of civil Engineer in Society, Impact of infrastructural development on economy of country.
Chapter 3
Surveying: Object Principles & Types of Surveying; Site Plans, Plans & Maps; Scales & Unit of different Measurements.
Linear Measurements: Instruments used. Linear Measurement by Tape, Ranging out Survey Lines and overcoming Obstructions; Measurements on sloping ground; Tape corrections, conventional symbols. Angular Measurements: Instruments used; Introduction to Compass Surveying, Bearings and Longitude & Latitude of a Line, Introduction to total station.
Levelling: Instrument used Object of levelling, Methods of levelling in brief, and Contour maps.
Chapter 4
Buildings: Selection of site for Buildings, Layout of Building Plan, Types of buildings, Plinth area, carpet area, floor space index, Introduction to building byelaws, concept of sun light & ventilation. Components of Buildings & their functions, Basic concept of R.C.C., Introduction to types of foundation
Chapter 5
Transportation: Introduction to Transportation Engineering; Traffic and Road Safety: Types and Characteristics of Various Modes of Transportation; Various Road Traffic Signs, Causes of Accidents and Road Safety Measures.
Chapter 6
Environmental Engineering: Environmental Pollution, Environmental Acts and Regulations, Functional Concepts of Ecology, Basics of Species, Biodiversity, Ecosystem, Hydrological Cycle; Chemical Cycles: Carbon, Nitrogen & Phosphorus; Energy Flow in Ecosystems.
Water Pollution: Water Quality standards, Introduction to Treatment & Disposal of Waste Water. Reuse and Saving of Water, Rain Water Harvesting. Solid Waste Management: Classification of Solid Waste, Collection, Transportation and Disposal of Solid. Recycling of Solid Waste: Energy Recovery, Sanitary Landfill, On-Site Sanitation. Air & Noise Pollution: Primary and Secondary air pollutants, Harmful effects of Air Pollution, Control of Air Pollution. . Noise Pollution Harmful Effects of noise pollution, control of noise pollution, Global warming & Climate Change, Ozone depletion, Greenhouse effect
Text Books:
1. Palancharmy, Basic Civil Engineering, McGraw Hill publishers.
2. Satheesh Gopi, Basic Civil Engineering, Pearson Publishers.
3. Ketki Rangwala Dalal, Essentials of Civil Engineering, Charotar Publishing House.
4. BCP, Surveying volume 1
This document provides an overview of wound healing, its functions, stages, mechanisms, factors affecting it, and complications.
A wound is a break in the integrity of the skin or tissues, which may be associated with disruption of the structure and function.
Healing is the body’s response to injury in an attempt to restore normal structure and functions.
Healing can occur in two ways: Regeneration and Repair
There are 4 phases of wound healing: hemostasis, inflammation, proliferation, and remodeling. This document also describes the mechanism of wound healing. Factors that affect healing include infection, uncontrolled diabetes, poor nutrition, age, anemia, the presence of foreign bodies, etc.
Complications of wound healing like infection, hyperpigmentation of scar, contractures, and keloid formation.
বাংলাদেশের অর্থনৈতিক সমীক্ষা ২০২৪ [Bangladesh Economic Review 2024 Bangla.pdf] কম্পিউটার , ট্যাব ও স্মার্ট ফোন ভার্সন সহ সম্পূর্ণ বাংলা ই-বুক বা pdf বই " সুচিপত্র ...বুকমার্ক মেনু 🔖 ও হাইপার লিংক মেনু 📝👆 যুক্ত ..
আমাদের সবার জন্য খুব খুব গুরুত্বপূর্ণ একটি বই ..বিসিএস, ব্যাংক, ইউনিভার্সিটি ভর্তি ও যে কোন প্রতিযোগিতা মূলক পরীক্ষার জন্য এর খুব ইম্পরট্যান্ট একটি বিষয় ...তাছাড়া বাংলাদেশের সাম্প্রতিক যে কোন ডাটা বা তথ্য এই বইতে পাবেন ...
তাই একজন নাগরিক হিসাবে এই তথ্য গুলো আপনার জানা প্রয়োজন ...।
বিসিএস ও ব্যাংক এর লিখিত পরীক্ষা ...+এছাড়া মাধ্যমিক ও উচ্চমাধ্যমিকের স্টুডেন্টদের জন্য অনেক কাজে আসবে ...
हिंदी वर्णमाला पीपीटी, hindi alphabet PPT presentation, hindi varnamala PPT, Hindi Varnamala pdf, हिंदी स्वर, हिंदी व्यंजन, sikhiye hindi varnmala, dr. mulla adam ali, hindi language and literature, hindi alphabet with drawing, hindi alphabet pdf, hindi varnamala for childrens, hindi language, hindi varnamala practice for kids, https://www.drmullaadamali.com
This presentation was provided by Steph Pollock of The American Psychological Association’s Journals Program, and Damita Snow, of The American Society of Civil Engineers (ASCE), for the initial session of NISO's 2024 Training Series "DEIA in the Scholarly Landscape." Session One: 'Setting Expectations: a DEIA Primer,' was held June 6, 2024.
Main Java[All of the Base Concepts}.docxadhitya5119
This is part 1 of my Java Learning Journey. This Contains Custom methods, classes, constructors, packages, multithreading , try- catch block, finally block and more.
This slide is special for master students (MIBS & MIFB) in UUM. Also useful for readers who are interested in the topic of contemporary Islamic banking.
How to Add Chatter in the odoo 17 ERP ModuleCeline George
In Odoo, the chatter is like a chat tool that helps you work together on records. You can leave notes and track things, making it easier to talk with your team and partners. Inside chatter, all communication history, activity, and changes will be displayed.
How to Make a Field Mandatory in Odoo 17Celine George
In Odoo, making a field required can be done through both Python code and XML views. When you set the required attribute to True in Python code, it makes the field required across all views where it's used. Conversely, when you set the required attribute in XML views, it makes the field required only in the context of that particular view.
3. The records of star-positions over the years,
the temperatures throughout the seasons, or one's
cardiac measurements are all examples of cyclic or
periodic data,
Periodic Functions
4. The records of star-positions over the years,
the temperatures throughout the seasons, or one's
cardiac measurements are all examples of cyclic or
periodic data, i.e. repetitive measurements having a
basic block appearing at a regular interval-a period.
Periodic Functions
5. The records of star-positions over the years,
the temperatures throughout the seasons, or one's
cardiac measurements are all examples of cyclic or
periodic data, i.e. repetitive measurements having a
basic block appearing at a regular interval-a period,
Periodic Functions
Given a function f(x), f(x) is periodic if there exists a
nonzero number b such that f(x) = f(x + b) for all x’s,
6. The records of star-positions over the years,
the temperatures throughout the seasons, or one's
cardiac measurements are all examples of cyclic or
periodic data, i.e. repetitive measurements having a
basic block appearing at a regular interval-a period,
Periodic Functions
Given a function f(x), f(x) is periodic if there exists a
nonzero number b such that f(x) = f(x + b) for all x’s,
and the smallest number p > 0 where f(x) = f(x + p)
is called the period of f(x).
7. The records of star-positions over the years,
the temperatures throughout the seasons, or one's
cardiac measurements are all examples of cyclic or
periodic data, i.e. repetitive measurements having a
basic block appearing at a regular interval-a period,
Periodic Functions
Given a function f(x), f(x) is periodic if there exists a
nonzero number b such that f(x) = f(x + b) for all x’s,
and the smallest number p > 0 where f(x) = f(x + p)
is called the period of f(x).
The graph of
a periodic function
8. The records of star-positions over the years,
the temperatures throughout the seasons, or one's
cardiac measurements are all examples of cyclic or
periodic data, i.e. repetitive measurements having a
basic block appearing at a regular interval-a period,
one period p
Periodic Functions
Given a function f(x), f(x) is periodic if there exists a
nonzero number b such that f(x) = f(x + b) for all x’s,
and the smallest number p > 0 where f(x) = f(x + p)
is called the period of f(x).
p0
The graph of
a periodic function
9. The records of star-positions over the years,
the temperatures throughout the seasons, or one's
cardiac measurements are all examples of cyclic or
periodic data, i.e. repetitive measurements having a
basic block appearing at a regular interval-a period,
one period p
Periodic Functions
Given a function f(x), f(x) is periodic if there exists a
nonzero number b such that f(x) = f(x + b) for all x’s,
and the smallest number p > 0 where f(x) = f(x + p)
is called the period of f(x).
x x+p
For all x’s, f(x) = f(x+p)
p
p0
The graph of
a periodic function
10. The records of star-positions over the years,
the temperatures throughout the seasons, or one's
cardiac measurements are all examples of cyclic or
periodic data, i.e. repetitive measurements having a
basic block appearing at a regular interval-a period,
one period p
Periodic Functions
Given a function f(x), f(x) is periodic if there exists a
nonzero number b such that f(x) = f(x + b) for all x’s,
and the smallest number p > 0 where f(x) = f(x + p)
is called the period of f(x).
Since the trig-functions
are defined by positions
on the unit circle, so
trig-functions are periodic
with periods 2π (or π).
x x+p
For all x’s, f(x) = f(x+p)
p
p0
The graph of
a periodic function
12. Graphs of Trig–Functions
The graph of y = sin(θ)
An ant, starting from the point (1, 0) runs counter-
clockwise around the unit circle.
(1, 0)
13. Graphs of Trig–Functions
The graph of y = sin(θ)
An ant, starting from the point (1, 0) runs counter-
clockwise around the unit circle. The arc-distance it
covered is the radian measurement of the angle θ as
shown
(1, 0)
14. Graphs of Trig–Functions
The graph of y = sin(θ)
An ant, starting from the point (1, 0) runs counter-
clockwise around the unit circle. The arc-distance it
covered is the radian measurement of the angle θ as
shown
θ
(x, y)
(1, 0)
θ
15. Graphs of Trig–Functions
The graph of y = sin(θ)
An ant, starting from the point (1, 0) runs counter-
clockwise around the unit circle. The arc-distance it
covered is the radian measurement of the angle θ as
shown
θ
(x, y)
(1, 0)
θ
θ
θ
16. Graphs of Trig–Functions
y
An ant, starting from the point (1, 0) runs counter-
clockwise around the unit circle. The arc-distance it
covered is the radian measurement of the angle θ as
shown and sin(θ) = y = the height of the ant’s position.
θ
(x, y)
(1, 0)
θ
The graph of y = sin(θ)
θ
θ
17. Graphs of Trig–Functions
The graph of y = sin(θ)
An ant, starting from the point (1, 0) runs counter-
clockwise around the unit circle. The arc-distance it
covered is the radian measurement of the angle θ as
shown and sin(θ) = y = the height of the ant’s position.
By plotting the points (θ, y=sin(θ)),
θθ
(x, y)
yy
(1, 0) θ
θ
18. Graphs of Trig–Functions
The graph of y = sin(θ)
An ant, starting from the point (1, 0) runs counter-
clockwise around the unit circle. The arc-distance it
covered is the radian measurement of the angle θ as
shown and sin(θ) = y = the height of the ant’s position.
By plotting the points (θ, y=sin(θ)),
θθ
(x, y)
yy
(1, 0) θ
θ
19. Graphs of Trig–Functions
The graph of y = sin(θ)
An ant, starting from the point (1, 0) runs counter-
clockwise around the unit circle. The arc-distance it
covered is the radian measurement of the angle θ as
shown and sin(θ) = y = the height of the ant’s position.
By plotting the points (θ, y=sin(θ)),
θθ
(x, y)
yy
(1, 0) θ
θ
20. Graphs of Trig–Functions
The graph of y = sin(θ)
An ant, starting from the point (1, 0) runs counter-
clockwise around the unit circle. The arc-distance it
covered is the radian measurement of the angle θ as
shown and sin(θ) = y = the height of the ant’s position.
By plotting the points (θ, y=sin(θ)),
θθ
π
2
(x, y)
yy
(1, 0) θ
θ
21. Graphs of Trig–Functions
The graph of y = sin(θ)
An ant, starting from the point (1, 0) runs counter-
clockwise around the unit circle. The arc-distance it
covered is the radian measurement of the angle θ as
shown and sin(θ) = y = the height of the ant’s position.
By plotting the points (θ, y=sin(θ)),
θθ
π
2
π
(x, y)
yy
(1, 0) θ
θ
22. Graphs of Trig–Functions
The graph of y = sin(θ)
An ant, starting from the point (1, 0) runs counter-
clockwise around the unit circle. The arc-distance it
covered is the radian measurement of the angle θ as
shown and sin(θ) = y = the height of the ant’s position.
By plotting the points (θ, y=sin(θ)),
θθ
π
2
π 2π
(x, y)
yy
(1, 0) θ
θ
23. Graphs of Trig–Functions
The graph of y = sin(θ)
An ant, starting from the point (1, 0) runs counter-
clockwise around the unit circle. The arc-distance it
covered is the radian measurement of the angle θ as
shown and sin(θ) = y = the height of the ant’s position.
By plotting the points (θ, y=sin(θ)),
θθ
π
2
π 2π
(x, y)
yy
(1, 0) θ
θ
24. Graphs of Trig–Functions
The graph of y = sin(θ)
An ant, starting from the point (1, 0) runs counter-
clockwise around the unit circle. The arc-distance it
covered is the radian measurement of the angle θ as
shown and sin(θ) = y = the height of the ant’s position.
By plotting the points (θ, y=sin(θ)), we obtain the
undulating sine wave as shown.
θθ
π
2
π 2π
(x, y)
yy
(1, 0) θ
θ
25. Graphs of Trig–Functions
The graph of y = sin(θ)
An ant, starting from the point (1, 0) runs counter-
clockwise around the unit circle. The arc-distance it
covered is the radian measurement of the angle θ as
shown and sin(θ) = y = the height of the ant’s position.
By plotting the points (θ, y=sin(θ)), we obtain the
undulating sine wave as shown.
Here are the important properties of the sine wave.
θθ
π
2
π 2π
(x, y)
yy
(1, 0) θ
θ
27. Properties of y = sin(θ)
1. It’s periodic with period 2π and | sin(θ) | ≤ 1 for all θ.
Graphs of Trig–Functions
0 π 2π–π–2π 3π–3π
y = 1
y = –1
28. 2. sin(θ) = 0 for θ = .., –2π, –π, 0, π, 2π.. or θ = {nπ}.
Properties of y = sin(θ)
1. It’s periodic with period 2π and | sin(θ) | ≤ 1 for all θ.
Graphs of Trig–Functions
0 π 2π–π–2π 3π–3π
sin(θ) = 0
for θ = {nπ} y = 1
y = –1
29. 2. sin(θ) = 0 for θ = .., –2π, –π, 0, π, 2π.. or θ = {nπ}.
Properties of y = sin(θ)
1. It’s periodic with period 2π and | sin(θ) | ≤ 1 for all θ.
Graphs of Trig–Functions
0 π 2π–π–2π 3π–3π
sin(θ) = 0
for θ = {nπ} y = 1
y = –1
The ant is on the x-axis
if sin(θ) = 0 and it does this
twice for every cycle.
30. 2. sin(θ) = 0 for θ = .., –2π, –π, 0, π, 2π.. or θ = {nπ}.
sin(θ) = 1 for θ = .., –7π/2, –3π/2, 1π/2, 5π/2, 9π/2..
or θ = {2nπ + π/2)}.
Properties of y = sin(θ)
1. It’s periodic with period 2π and | sin(θ) | ≤ 1 for all θ.
sin(θ) =1
for θ = {π/2+2nπ)}
Graphs of Trig–Functions
0 π 2π–π–2π 3π–3π
sin(θ) = 0
for θ = {nπ} y = 1
y = –1
31. 2. sin(θ) = 0 for θ = .., –2π, –π, 0, π, 2π.. or θ = {nπ}.
sin(θ) = 1 for θ = .., –7π/2, –3π/2, 1π/2, 5π/2, 9π/2..
or θ = {2nπ + π/2)}.
Properties of y = sin(θ)
1. It’s periodic with period 2π and | sin(θ) | ≤ 1 for all θ.
sin(θ) =1
for θ = {π/2+2nπ)}
Graphs of Trig–Functions
0 π 2π–π–2π 3π–3π
sin(θ) = 0
for θ = {nπ} y = 1
y = –1
The ant is at the apex
if sin(θ) = 1 and it does
this once every round.
32. 2. sin(θ) = 0 for θ = .., –2π, –π, 0, π, 2π.. or θ = {nπ}.
sin(θ) = 1 for θ = .., –7π/2, –3π/2, 1π/2, 5π/2, 9π/2..
or θ = {2nπ + π/2)}.
sin(θ) = –1 for θ = .., –9π/2, –5π/2, –1π/2, 3π/2, 7π/2,..
or θ = {2nπ – π/2)}.
Properties of y = sin(θ)
1. It’s periodic with period 2π and | sin(θ) | ≤ 1 for all θ.
sin(θ) =1
for θ = {π/2+2nπ)}
Graphs of Trig–Functions
0 π 2π–π–2π 3π–3π
sin(θ) = –1
for θ = {–π/2+2nπ)}
sin(θ) = 0
for θ = {nπ} y = 1
y = –1
33. 2. sin(θ) = 0 for θ = .., –2π, –π, 0, π, 2π.. or θ = {nπ}.
sin(θ) = 1 for θ = .., –7π/2, –3π/2, 1π/2, 5π/2, 9π/2..
or θ = {2nπ + π/2)}.
sin(θ) = –1 for θ = .., –9π/2, –5π/2, –1π/2, 3π/2, 7π/2,..
or θ = {2nπ – π/2)}.
Properties of y = sin(θ)
1. It’s periodic with period 2π and | sin(θ) | ≤ 1 for all θ.
sin(θ) =1
for θ = {π/2+2nπ)}
Graphs of Trig–Functions
0 π 2π–π–2π 3π–3π
sin(θ) = –1
for θ = {–π/2+2nπ)}
sin(θ) = 0
for θ = {nπ} y = 1
y = –1
The ant is at the nadir
if sin(θ) = 1 and it does
this once every round.
34. 2. sin(θ) = 0 for θ = .., –2π, –π, 0, π, 2π.. or θ = {nπ}.
sin(θ) = 1 for θ = .., –7π/2, –3π/2, 1π/2, 5π/2, 9π/2..
or θ = {2nπ + π/2)}.
sin(θ) = –1 for θ = .., –9π/2, –5π/2, –1π/2, 3π/2, 7π/2,..
or θ = {2nπ – π/2)}.
Properties of y = sin(θ)
1. It’s periodic with period 2π and | sin(θ) | ≤ 1 for all θ.
sin(θ) =1
for θ = {π/2+2nπ)}
3. Sin(–θ) = –sin(θ) is odd so its graph is symmetric to
the origin.
Graphs of Trig–Functions
0 π 2π–π–2π 3π–3π
sin(θ) = –1
for θ = {–π/2+2nπ)}
sin(θ) = 0
for θ = {nπ} y = 1
y = –1
36. Graph of y = cos(θ)
The cosine function tracks the x-coordinates of
the position of the ant as it runs around the circle.
Graphs of Trig–Functions
θ
(1, 0)
cos(θ) = x
(x, y)
37. Graph of y = cos(θ)
The cosine function tracks the x-coordinates of
the position of the ant as it runs around the circle.
The coordinates of (x, y) of an angle θ, after rotating
90o counter-clockwise,
Graphs of Trig–Functions
θ
y
(1, 0)
cos(θ) = x
(x, y)
at θ
A rotation of π/2
gives the identity
cos(θ) = sin(θ + π/2)
θ
(x, y)
38. Graph of y = cos(θ)
The cosine function tracks the x-coordinates of
the position of the ant as it runs around the circle.
The coordinates of (x, y) of an angle θ, after rotating
90o counter-clockwise,
Graphs of Trig–Functions
θ
y
(1, 0)
cos(θ) = x
(x, y)
at θ
A rotation of π/2
gives the identity
cos(θ) = sin(θ + π/2)
π
θ
(x, y)
39. Graph of y = cos(θ)
The cosine function tracks the x-coordinates of
the position of the ant as it runs around the circle.
The coordinates of (x, y) of an angle θ, after rotating
90o counter-clockwise, become (–y, x), which is the
position corresponding to the of the angle (θ + π/2).
Graphs of Trig–Functions
θ
y
(1, 0)
cos(θ) = x
(x, y)
at θ
(–y, x) at
θ+π/2
A rotation of π/2
gives the identity
cos(θ) = sin(θ + π/2)
π
θ
(x, y)
40. Graph of y = cos(θ)
The cosine function tracks the x-coordinates of
the position of the ant as it runs around the circle.
The coordinates of (x, y) of an angle θ, after rotating
90o counter-clockwise, become (–y, x), which is the
position corresponding to the the angle (θ + π/2).
So cos(θ) = sin(θ + π/2),
Graphs of Trig–Functions
θ
y
(1, 0)
cos(θ) = x
(x, y)
at θ
(–y, x) at
θ+π/2
A rotation of π/2
gives the identity
cos(θ) = sin(θ + π/2)
π
θ
(x, y)
41. Graph of y = cos(θ)
The cosine function tracks the x-coordinates of
the position of the ant as it runs around the circle.
The coordinates of (x, y) of an angle θ, after rotating
90o counter-clockwise, become (–y, x), which is the
position corresponding to the the angle (θ + π/2).
So cos(θ) = sin(θ + π/2), i.e. the graph of y = cos(θ)
is the sine graph shifted left by π/2.
Graphs of Trig–Functions
θ
y
(1, 0)
cos(θ) = x
(x, y)
at θ
(–y, x) at
θ+π/2
A rotation of π/2
gives the identity
cos(θ) = sin(θ + π/2)
π
θ
(x, y)
42. Graphs of Trig–Functions
A rotation of π/2 gives that cos(θ) = sin(θ + π/2).
This means the graph of y = cos(θ) is the π/2-left-shift
of y = sin(θ),
Graph of y = cos(θ)
y = sin(θ)(π/2, 1)
π
(0, 0)
43. Graphs of Trig–Functions
A rotation of π/2 gives that cos(θ) = sin(θ + π/2).
This means the graph of y = cos(θ) is the π/2-left-shift
of y = sin(θ), e.g. the point (π/2, 1) is shifted to (0, 1)
and (0, 0) is shifted to (–π/2, 1).
Graph of y = cos(θ)
y = sin(θ)(π/2, 1)
π
(0, 0)
44. Graphs of Trig–Functions
y = sin(θ)
A rotation of π/2 gives that cos(θ) = sin(θ + π/2).
This means the graph of y = cos(θ) is the π/2-left-shift
of y = sin(θ), e.g. the point (π/2, 1) is shifted to (0, 1)
and (0, 0) is shifted to (–π/2, 1).
y = cos(θ)
(π/2, 1)
(0, 1)
Here is the graph of y = cos(θ) after shifting sin(θ).
π
(0, 0)
(–π/2,0)
Graph of y = cos(θ)
(π/2,0)
46. Graph of y = tan(θ)
Graphs of Trig–Functions
x
y
(x , y)
y
xtan()
Given an angle , tan() =
is the length as shown here,
which is also the slope of the dial.(1,0)
47. Graph of y = tan(θ)
Graphs of Trig–Functions
x
y
(x , y)
y
xtan()
Given an angle , tan() =
is the length as shown here,
which is also the slope of the dial.(1,0)
x
y t
1
~~
48. Graph of y = tan(θ)
Graphs of Trig–Functions
x
y
(x , y)
y
xtan()
Given an angle , tan() =
is the length as shown here,
which is also the slope of the dial.(1,0)
Tan(θ) is defined between ±π/2
but not at ±π/2.
x
y t
1
~~
49. Graph of y = tan(θ)
Graphs of Trig–Functions
x
y
(x , y)
y
xtan()
Given an angle , tan() =
is the length as shown here,
which is also the slope of the dial.(1,0)
Tan(θ) is defined between ±π/2
but not at ±π/2. Specifically,
as θ →π/2– , tan(θ) → ∞θ →π/2–
tan(θ) → ∞
x
y t
1
~~
50. Graph of y = tan(θ)
Graphs of Trig–Functions
x
y
(x , y)
y
xtan()
Given an angle , tan() =
is the length as shown here,
which is also the slope of the dial.(1,0)
Tan(θ) is defined between ±π/2
but not at ±π/2. Specifically,
as θ →π/2– , tan(θ) → ∞
as θ → –π/2+ , tan(θ) → –∞
θ →π/2–
tan(θ) → ∞
θ → –π/2+
tan(θ) → –∞
x
y t
1
~~
51. Graph of y = tan(θ)
Graphs of Trig–Functions
x
y
(x , y)
y
xtan()
Given an angle , tan() =
is the length as shown here,
which is also the slope of the dial.(1,0)
Tan(θ) is defined between ±π/2
but not at ±π/2. Specifically,
as θ →π/2– , tan(θ) → ∞
as θ → –π/2+ , tan(θ) → –∞
Here are some tan(θ) values:
θ →π/2–
tan(θ) → ∞
θ → –π/2+
tan(θ) → –∞
x
y t
1
~~
π/60 π/4 π/3
0 1/3 1 3 ∞
π/2 –
θ
tan(θ)
0–π/2+
0
–π/6
–1/3
–π/4
–1
–π/3
–3–∞
tan(θ)
θ
52. Graph of y = tan(θ)
Graphs of Trig–Functions
π/60 π/4 π/3
0 1/3 1 3 ∞
π/2 –
θ
tan(θ)
0–π/2+
0
–π/6
–1/3
–π/4
–1
–π/3
–3–∞
tan(θ)
θ
x
y
(x , y)
tan()
(1,0)
y = tan(θ)
–π/2 π/2
0
θ
Plot these points to
obtain the graph of
y = tan(θ).
53. Graph of y = tan(θ)
Graphs of Trig–Functions
π/60 π/4 π/3
0 1/3 1 3 ∞
π/2 –
θ
tan(θ)
0–π/2+
0
–π/6
–1/3
–π/4
–1
–π/3
–3–∞
tan(θ)
θ
x
y
(x , y)
tan()
(1,0)
y = tan(θ)
–π/2 π/2
0
θ
Plot these points to
obtain the graph of
y = tan(θ).
54. Graph of y = tan(θ)
Graphs of Trig–Functions
π/60 π/4 π/3
0 1/3 1 3 ∞
π/2 –
θ
tan(θ)
0–π/2+
0
–π/6
–1/3
–π/4
–1
–π/3
–3–∞
tan(θ)
θ
x
y
(x , y)
tan()
(1,0)
y = tan(θ)
–π/2 π/2 3π/2–3π/2
0
The basic periodic interval
for tan(θ) is (–π/2, π/2) with
period π
θ
Plot these points to
obtain the graph of
y = tan(θ).
55. Graph of y = tan(θ)
Graphs of Trig–Functions
π/60 π/4 π/3
0 1/3 1 3 ∞
π/2 –
θ
tan(θ)
0–π/2+
0
–π/6
–1/3
–π/4
–1
–π/3
–3–∞
tan(θ)
θ
x
y
(x , y)
tan()
(1,0)
Plot these points to
obtain the graph of
y = tan(θ).
y = tan(θ)
–π/2 π/2 3π/2–3π/2
π–π 0
The basic periodic interval
for tan(θ) is (–π/2, π/2) with
period π and like sin(x),
tan(nπ) = 0
where n is an integer.
θ
56. Graph of y = cot(θ)
Graphs of Trig–Functions
x
y
(x , y)
y
x
cot()
Given an angle , cot() =
is the length as shown here.
(0, 1)
57. Graph of y = cot(θ)
Graphs of Trig–Functions
x
y
(x , y)
y
x
cot()
Given an angle , cot() =
is the length as shown here.
(0, 1)
Cot(θ) is defined between 0 and π
but not at 0 or π. Specifically,
as θ →0+ , cot(θ) → ∞
as θ → π– , cot(θ) → –∞
θ →0 +
cot(θ) →∞
θ → π–
cot(θ) → –∞
58. Graph of y = cot(θ)
Graphs of Trig–Functions
x
y
(x , y)
y
x
cot()
Given an angle , cot() =
is the length as shown here.
(0, 1)
Cot(θ) is defined between 0 and π
but not at 0 or π. Specifically,
as θ →0+ , cot(θ) → ∞
as θ → π– , cot(θ) → –∞
Here are some cot(θ) values:
θ →0 +
cot(θ) →∞
θ → π–
cot(θ) → –∞
π/6 0+π/4π/3
0 1/3 1 3 ∞
π/2
θ
cot(θ)
π
0
2π/3
–1/3
3π/4
–1
5π/6
–3–∞
cot(θ)
θ
π/2
59. Graph of y = cot(θ)
Graphs of Trig–Functions
x
y
(x , y)
cot()(0, 1)
π/6 0+π/4π/3
0 1/3 1 3 ∞
π/2
θ
cot(θ)
π
0
2π/3
–1/3
3π/4
–1
5π/6
–3–∞
cot(θ)
θ
π/2
60. Graph of y = cot(θ)
Graphs of Trig–Functions
x
y
(x , y)
cot()(0, 1)
π/6 0+π/4π/3
0 1/3 1 3 ∞
π/2
θ
cot(θ)
π
0
2π/3
–1/3
3π/4
–1
5π/6
–3–∞
cot(θ)
θ
π/2
We’ve the graph of y = cot(θ)
by plotting these points.
The periodic interval of cot(θ)
is (0, π),
y = cot(θ)
π/2
π–π 0
θ
2π
61. Graph of y = cot(θ)
Graphs of Trig–Functions
x
y
(x , y)
cot()(0, 1)
π/6 0+π/4π/3
0 1/3 1 3 ∞
π/2
θ
cot(θ)
π
0
2π/3
–1/3
3π/4
–1
5π/6
–3–∞
cot(θ)
θ
π/2
We’ve the graph of y = cot(θ)
by plotting these points.
The periodic interval of cot(θ)
is (0, π), and like cos(θ)
cot(θ) = 0 for
θ =
= {(2n+1)π/2} with n an integer.
–π
2 ,
π
2 ,
–3π
2 ,
3π
2 ,... .{ {
y = cot(θ)
–π/2 π/2 3π/2
π–π 0
θ
2π
62. Graph of y = cot(θ)
Graphs of Trig–Functions
x
y
(x , y)
cot()(0, 1)
π/6 0+π/4π/3
0 1/3 1 3 ∞
π/2
θ
cot(θ)
π
0
2π/3
–1/3
3π/4
–1
5π/6
–3–∞
cot(θ)
θ
π/2
We’ve the graph of y = cot(θ)
by plotting these points.
The periodic interval of cot(θ)
is (0, π), and like cos(θ)
cot(θ) = 0 for
θ =
= {(2n+1)π/2} with n an integer.
–π
2 ,
π
2 ,
–3π
2 ,
3π
2 ,... .{ {
y = cot(θ)
–π/2 π/2 3π/2
π–π 0
θ
2π
63. The reciprocal-ratios sec() = 1/cos() and
csc() = 1/sin(), the "secant" and the "cosecant" of ,
are used in science and engineering.
Graphs of Trig–Functions
64. The reciprocal-ratios sec() = 1/cos() and
csc() = 1/sin(), the "secant" and the "cosecant" of ,
are used in science and engineering.
Graphs of Trig–Functions
Their graphs may be obtained by "reciprocating"
the graphs of y = sin() and y = cos().
65. The reciprocal-ratios sec() = 1/cos() and
csc() = 1/sin(), the "secant" and the "cosecant" of ,
are used in science and engineering.
Graphs of Trig–Functions
Their graphs may be obtained by "reciprocating"
the graphs of y = sin() and y = cos().
Reciprocating Graphs
66. The reciprocal-ratios sec() = 1/cos() and
csc() = 1/sin(), the "secant" and the "cosecant" of ,
are used in science and engineering.
Graphs of Trig–Functions
Their graphs may be obtained by "reciprocating"
the graphs of y = sin() and y = cos().
Reciprocating Graphs
To form the reciprocal graph of a
continuous function, let's track the
position (x, 1/y) from (x, y).
y=1
67. The reciprocal-ratios sec() = 1/cos() and
csc() = 1/sin(), the "secant" and the "cosecant" of ,
are used in science and engineering.
Graphs of Trig–Functions
Their graphs may be obtained by "reciprocating"
the graphs of y = sin() and y = cos().
Reciprocating Graphs
To form the reciprocal graph of a
continuous function, let's track the
position (x, 1/y) from (x, y).
Points (x, y) where 0 < y < 1 are
reciprocated to the top with 1/y > 1,
and vice versa as shown.
y=1
(x, y)
(x, 1/y)
(x, 1/y)
(x, y)
(x, y)
(x, 1/y)
68. The reciprocal-ratios sec() = 1/cos() and
csc() = 1/sin(), the "secant" and the "cosecant" of ,
are used in science and engineering.
Graphs of Trig–Functions
Their graphs may be obtained by "reciprocating"
the graphs of y = sin() and y = cos().
Reciprocating Graphs
To form the reciprocal graph of a
continuous function, let's track the
position (x, 1/y) from (x, y).
Points (x, y) where 0 < y < 1 are
reciprocated to the top with 1/y > 1,
and vice versa as shown.
The points (x, 1)’s stay fixed
y=1(x, 1)
(x, y)
(x, 1/y)
(x, 1/y)
(x, y)
(x, y)
(x, 1/y)
69. The reciprocal-ratios sec() = 1/cos() and
csc() = 1/sin(), the "secant" and the "cosecant" of ,
are used in science and engineering.
Graphs of Trig–Functions
Their graphs may be obtained by "reciprocating"
the graphs of y = sin() and y = cos().
Reciprocating Graphs
To form the reciprocal graph of a
continuous function, let's track the
position (x, 1/y) from (x, y).
Points (x, y) where 0 < y < 1 are
reciprocated to the top with 1/y > 1,
and vice versa as shown.
The points (x, 1)’s stay fixed and
y=1
(x, y)
(x, 1/y)
(x, 1/y)
(x, y)
(x, 1)
(x, y)
(x, 1/y)
asymptotes are formed at (x,0)’s since 1/0 is UDF.
(x,0)
Vertical
Asymptotes
70. Graphs of Trig–Functions
Sine is periodic so we may reciprocate one period of
the sine wave to get the graph y = csc().
Reciprocating the y-coordinates
71. Graphs of Trig–Functions
Sine is periodic so we may reciprocate one period of
the sine wave to get the graph y = csc().
Reciprocating the y-coordinates π0 2π
( π/2, 1)
(3π/2, –1 )
y=sin()
y=csc()
72. Graphs of Trig–Functions
Sine is periodic so we may reciprocate one period of
the sine wave to get the graph y = csc().
Reciprocating the y-coordinates π0 2π
( π/2, 1)
(3π/2, –1 )
y=sin()
y=csc()
73. Graphs of Trig–Functions
Sine is periodic so we may reciprocate one period of
the sine wave to get the graph y = csc().
Reciprocating the y-coordinates π0 2π
( π/2, 1)
(3π/2, –1 )
y=sin()
y=csc()
The graph of csc() is periodic with period 2π.
74. Graphs of Trig–Functions
Sine is periodic so we may reciprocate one period of
the sine wave to get the graph y = csc().
Reciprocating the y-coordinates π0 2π
( π/2, 1)
(3π/2, –1 )
y=sin()
y=csc()
The graph of csc() is periodic with period 2π.
Since cos() is the left-shift of the sin(), so the graph
of sec() is the left shift of the graph of csc().
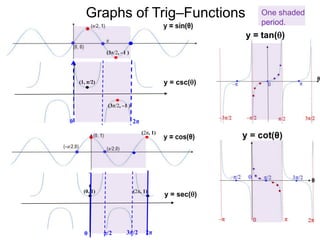
75. Graphs of Trig–Functions
Sine is periodic so we may reciprocate one period of
the sine wave to get the graph y = csc().
Reciprocating the y-coordinates π0 2π
( π/2, 1)
(3π/2, –1 )
y=sin()
y=csc()
The graph of csc() is periodic with period 2π.
Since cos() is the left-shift of the sin(), so the graph
of sec() is the left shift of the graph of csc().
Here are the graphs of all six trig-functions.
76. π/2 3π/20 2π
(1, π/2)
One shaded
period.
0 2π
Graphs of Trig–Functions
0
y = csc()
y = sec()
y = tan()
(0, 1) (2π, 1)
(2π, 1)
(3π/2, –1 )
(3π/2, –1 )