This document provides procedures for estimating precision error and determining confidence intervals of measurement means and differences between data sets. It begins by explaining how to calculate a confidence interval of the mean using the central limit theorem when sample size is large (>30), which gives a Gaussian distribution of mean values. When sample size is small (<30), it recommends using the Student's t-distribution. Examples are given of calculating confidence intervals at 95% probability levels. The document also covers the Student's t-test for determining if two data sets are significantly different based on calculating the t-value and comparing to t-distribution tables. In general, it advises using a 95% probability level for uncertainty calculations.


![Statistical measurement theory
∑
=
+
+
+
+
=
=
N
i
N
i
N
x
x
x
x
N
x
x
1
3
2
1 ...
]
)
(
[
1
1
1
)
(
...
)
(
)
(
2
1
2
2
2
2
2
2
1
2
∑
=
−
−
=
−
−
+
+
−
+
−
=
N
i
i
x
N
x
x
N
x
N
S
N
x
x
x
x
x
x
S
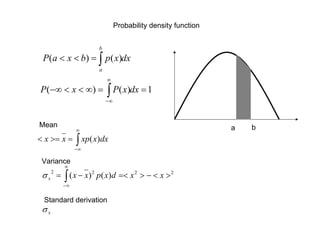
We want to estimate
x
u
x
x ±
=
'
ux is the uncertainty or confidence interval at some probability level P%
(P%)
x
x u
x
x
u
x −
≤
≤
− '](https://image.slidesharecdn.com/5-propability-2-87-231021190540-6663bf7f/85/5-Propability-2-87-pdf-17-320.jpg)


![Statistical measurement theory
Measured values: X1, X2, X3, X4, X5, … XN
Sx
σ
X’
Sample measurement
Population
x
∑
=
+
+
+
+
=
=
N
i
N
i
N
x
x
x
x
N
x
x
1
3
2
1 ...
]
)
(
[
1
1
1
)
(
...
)
(
)
( 2
1
2
2
2
2
2
1
2
∑
=
−
−
=
−
−
+
+
−
+
−
=
N
i
i
N
x x
N
x
N
N
x
x
x
x
x
x
S
How good is the mean estimation?](https://image.slidesharecdn.com/5-propability-2-87-231021190540-6663bf7f/85/5-Propability-2-87-pdf-21-320.jpg)