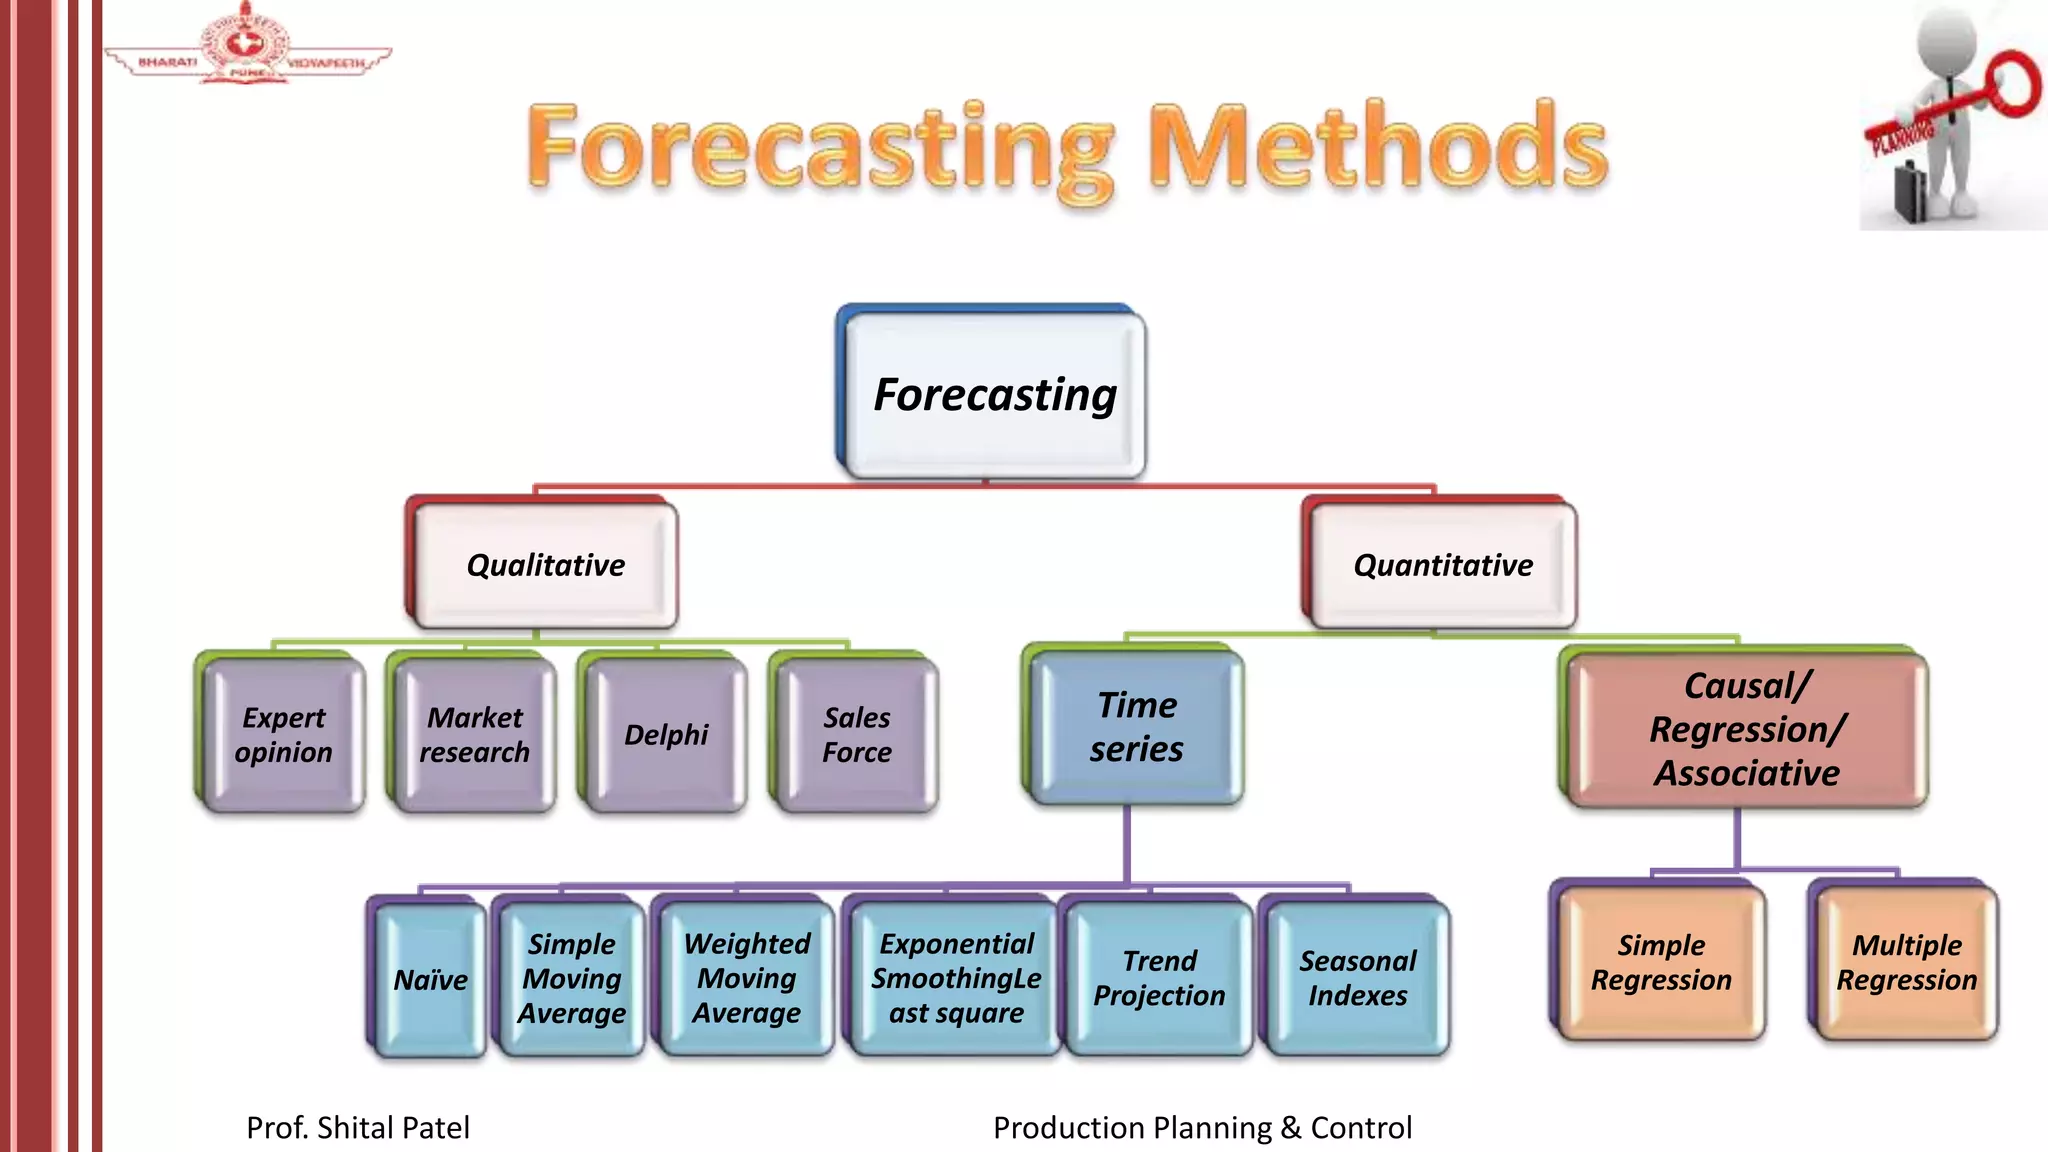
SlideShare a Scribd company logo
1 of 106
Production Planning & Control
Prof. Shital Patel
FORECASTING
AGGREGATE PLANNING
CAPACITY PLANNING
Prof. Shital Patel Production Planning & Control
• Forecasting is the art and science of predicting what will happen in the future
• Determined by a mathematical method or on the intuition of the Experts–combination
Prof. Shital Patel Production Planning & Control
• Majority of the industrial activities depend upon the future sales.
• Projected demand for the future assists in decision making with respect to
investment in plant and machinery, market planning and programmers.
• To schedule the production activity to ensure optimum utilization of plant’s
capacity.
• To prepare material planning to take up replenishment action to make the
materials available at right quantity and right time.
• To provide an information about the relationship between demand for
different products in order to obtain a balanced production in terms of
quantity required of different products as a function of time.
• To provide a future trend which is very much essential for product design and
development.
Prof. Shital Patel Production Planning & Control
• Backbone of PPC
• What (Product type), How( Process), How much(Quantity) and of What quality, will be
manufactured
• Strategic decision of investment in men(Skills), machines(Capacity & Precision) and
materials(type)
• Plant Layout ( Sequence of Machine arrangements)
• Budgets and control
• Inventory control
• Leading to Aggregate Planning, Capacity planning, Process Planning, Scheduling &
Sequencing…
• Lays foundation for Long rang and Short range planning
- long term: location, capacity, technology etc. questions
- short term: production planning, material management, hiring and scheduling
employees, allocating transportation etc.
Prof. Shital Patel Production Planning & Control
Step 1 Determine purpose of forecast
Step 2 Establish a time horizon
Step 3 Select a forecasting technique
Step 4 Gather and analyze data
Step 5 Prepare the forecast
Step 6 Monitor the forecast
“The forecast”
Prof. Shital Patel Production Planning & Control
Principles- Many types of forecasting models that differ in complexity and
amount of data & way they generate forecasts:
1. Forecasts are rarely perfect
2. Forecasts are more accurate for grouped data than for individual items
3. Forecast are more accurate for shorter than longer time periods
Types of Forecasts
 Economic forecasts -Predict a variety of economic indicators, like
money supply, inflation rates, interest rates, etc.
 Technological forecasts - Predict rates of technological progress and
innovation.
 Demand forecasts - Predict the future demand for a company’s
products or services.
Prof. Shital Patel Production Planning & Control
Forecasting
Qualitative
Expert
opinion
Market
research
Delphi
Sales
Force
Quantitative
Time
series
Naïve
Simple
Moving
Average
Weighted
Moving
Average
Exponential
SmoothingLe
ast square
Trend
Projection
Seasonal
Indexes
Causal/
Regression/
Associative
Simple
Regression
Multiple
Regression
Prof. Shital Patel Production Planning & Control
 Used when little data exist
 New products
 New technology
 Involves intuition, experience
 e.g., forecasting sales on Internet
Prof. Shital Patel Production Planning & Control
• Consultants who specialise in the motor industry, in food retailing, in internet
marketing and so on
• Different types of economists such as motor industry economists, energy
economists, and political economists, all of whom have opinions on future
demand and expenditure patterns in the country and the global markets
• Some businesses, affected by seasonal variations in sales, consult specialists
on long term weather forecasts in an attempt to predict sales of weather-
dependent products
• Other experts to be consulted can include distributors, wholesalers, suppliers
and trade organisations
• Experts are useful for gaining specialised insights into likely future patterns
and trends but should not be used on a ‘standalone basis’.
• Panels of experts are more reliable than consulting individual
Prof. Shital Patel Production Planning & Control
• Surveys of consumers’ intentions- makes predictions by asking people directly what
they intend to do in the future
• Market research companies that are continually gathering vast quantities of
information and make money by selling this research to businesses
• The results of surveys allow businesses to predict sales patterns and plan for the
future in terms of staffing and production levels
• Test marketing - Consumers’ response to a product, before the full release of the
product
• Involve the release of a product in a limited geographical area, or to a small section
of the target market
• For example, many films are test marketed before they are put on general release (by
being shown to invited audiences), and if the response of the test marketing process
is negative then changes can be made to the films before being made available to be
general market.
Prof. Shital Patel Production Planning & Control
• Developed by the RAND Corporation in the late 1950s
• Based on researching the views of a panel of experts
• Begins with the initial development of a questionnaire focusing on the problem or issue
in question
• A panel of experts is selected, and then the questionnaire is sent to each of them
• Each participant answers the questionnaire independently and returns it
• Responses to the questionnaire are summarised before a further questionnaire is
developed
• The members of the expert panel independently rate and prioritise ideas included in the
second questionnaire
• This enables the group of experts to arrive at a consensus forecast
• Based on the principle that forecasts from a structured group of experts are more
accurate than those from individuals or unstructured groups.
Prof. Shital Patel Production Planning & Control
Advantages –
• Flexible enough to be used in a variety of situations and can be applied to a range
of complex problems
• Provides a structured way for a group of people to make decisions
• Participants have time to think through their ideas leading to a better quality of
response
• Creates a record of the expert group’s responses and ideas which can be used when
needed.
Disadvantages-
• Require a substantial period of time to complete as the process is time consuming
to coordinate and manage
• It assumes that experts are willing to come to a consensus and allow their opinions
to be altered by the views of other experts
• Monetary payments to the experts may lead to bias in the results of the study.
Prof. Shital Patel Production Planning & Control
• Sales teams within businesses interact closely with
customers
• Sales staff might notice any developing trends, and
they have the experience to spot market changes
and shifts in customer preferences and attitudes
• This direct sales information can be collected by
management requesting statistical predictions of
future sales, and by encouraging the upward flow of
information through their organisation.
Prof. Shital Patel Production Planning & Control
 Used when situation is ‘stable’ and historical
data exist
 Existing products
 Current technology
 Involves mathematical techniques
 e.g., forecasting sales of LCD televisions
Prof. Shital Patel Production Planning & Control
 Naive approach
 Moving averages
 Exponential
smoothing
 Trend projection
 Linear regression
time-series
models
associative
model
Prof. Shital Patel Production Planning & Control
 Set of evenly spaced numerical data
 Obtained by observing response variable at
regular time periods
 Forecast based only on past values, no
other variables important
 Assumes that factors influencing past and
present will continue influence in future
Prof. Shital Patel Production Planning & Control
Uh, give me a minute....
We sold 250 wheels last
week.... Now, next week we
should sell....
The forecast for any period equals the
previous period’s actual value.
Prof. Shital Patel Production Planning & Control
• Simple to use
• Virtually no cost
• Quick and easy to prepare
• Data analysis is nonexistent
• Easily understandable
• Cannot provide high accuracy
• Can be a standard for accuracy
Prof. Shital Patel Production Planning & Control
• This method consists of computing an average of
the most recent “n” data values in the time series.
This average is then used as a forecast for the next
period.
• Moving average =  (most recent n data values)
n
• Moving average usually tends to eliminate the
seasonal and random components.
Prof. Shital Patel Production Planning & Control
• Weighted moving average – More recent values in a
series are given more weight in computing the forecast
 Used when some trend might be present
 Older data usually less important
 Weights based on experience and intuition
Weighted
moving average =
∑ (weight for period n)
x (demand in period n)
∑ weights
Prof. Shital Patel Production Planning & Control
Weights Applied Period
3 Last month
2 Two months ago
1 Three months ago
6 Sum of weights
January 10
February 12
March 13
April 16
May 19
June 23
July 26
Actual 3-Month Weighted
Month Shed Sales Moving Average
[(3 x 16) + (2 x 13) + (12)]/6 = 141/3
[(3 x 19) + (2 x 16) + (13)]/6 = 17
[(3 x 23) + (2 x 19) + (16)]/6 = 201/2
10
12
13
[(3 x 13) + (2 x 12) + (10)]/6 = 121/6
Prof. Shital Patel Production Planning & Control
• It is a forecasting technique that uses a smoothed
value of time series in one period to forecast the value
of time series in the next period. The basic model is as
follows:
• Ft = α Dt-1 + (1- α)Ft-1
• Where:
• Ft= the forecast of time series for period t
• Dt-1 = the actual value of the time series in period t-1
• Ft-1 = the forecast of time series for period t-1
• α = the smoothing constant 0<α≤1
Prof. Shital Patel Production Planning & Control
One of the two wheeler manufacturing
company experienced irregular but
usually increasing demand for three
products. The demand was found to be
420 bikes for June and 440 bikes for July.
They use a forecasting method which
takes average of past year to forecast
future demand. Using the simple
average method demand forecast for
June is found as 320 bikes (Use a
smoothing coefficient 0.7 to weight the
recent demand most heavily) and find
the demand forecast for August.
Prof. Shital Patel Production Planning & Control
Trend
Seasonal
Cyclical
Random
Prof. Shital Patel Production Planning & Control
Average demand
over 4 years
Trend
component
Actual demand
line
Random variation
Seasonal peaks
Demand
for
product
or
service
| | | |
1 2 3 4
Time (years)
Prof. Shital Patel Production Planning & Control
A time series technique that computes a forecast
with trend by drawing a straight line through a
set of data using this formula:
Y = a + bX where
Y = forecast for period X
X = the number of time periods from X = 0
A = value of y at X = 0 (Y intercept)
B = slope of the line
Prof. Shital Patel Production Planning & Control
• Identify dependent (y) and
independent (x) variables
• Solve for the slope of the line
• Solve for the y intercept
• Develop your equation for the
trend line
Y=a + bX
X
b
Y
a 





 2
2
X
n
X
Y
X
n
XY
b
Prof. Shital Patel Production Planning & Control
• In least squares regression
– The sum of squared residuals is minimised
– The mean of residuals is zero
– residuals are assumed to be randomly
distributed around the mean according to the
normal distribution
Prof. Shital Patel Production Planning & Control
At a small regional college enrollments have grown
steadily over the past six years, as evidenced below.
Use time series regression to forecast the student
enrollments for the next three years.
Students Students
Year Enrolled (1000s) Year Enrolled (1000s)
1 2.5 4 3.2
2 2.8 5 3.3
3 2.9 6 3.4
Prof. Shital Patel Production Planning & Control
x y x2 xy
1 2.5 1 2.5
2 2.8 4 5.6
3 2.9 9 8.7
4 3.2 16 12.8
5 3.3 25 16.5
6 3.4 36 20.4
Sx=21 Sy=18.1 Sx2=91 Sxy=66.5
Prof. Shital Patel Production Planning & Control
Y = 2.387 + 0.180X
Prof. Shital Patel Production Planning & Control
Y7 = 2.387 + 0.180(7) = 3.65 or 3,650 students
Y8 = 2.387 + 0.180(8) = 3.83 or 3,830 students
Y9 = 2.387 + 0.180(9) = 4.01 or 4,010 students
Note: Enrollment is expected to increase by 180
students per year.
Prof. Shital Patel Production Planning & Control
 Simple linear regression can also be used
when the independent variable X
represents a variable other than time.
 In this case, linear regression is
representative of a class of forecasting
models called
Prof. Shital Patel Production Planning & Control
 Simple Linear Regression – Causal Model
The manager of RPC wants to project the firm’s
sales for the next 3 years. He knows that RPC’s long-
range sales are tied very closely to national freight car
loadings. On the next slide are 7 years of relevant
historical data.
Develop a simple linear regression model between
RPC sales and national freight car loadings. Forecast RPC
sales for the next 3 years, given that the rail industry
estimates car loadings of 250, 270, and 300 Thousands.
Prof. Shital Patel Production Planning & Control
RPC Sales Car Loadings
Year (Rs.Thousand) (Rs.Thousand)
1 9.5 120
2 11.0 135
3 12.0 130
4 12.5 150
5 14.0 170
6 16.0 190
7 18.0 220
Prof. Shital Patel Production Planning & Control
x y x2 xy
120 9.5 14,400 1,140
135 11.0 18,225 1,485
130 12.0 16,900 1,560
150 12.5 22,500 1,875
170 14.0 28,900 2,380
190 16.0 36,100 3,040
220 18.0 48,400 3,960
1,115 93.0 185,425 15,440
Prof. Shital Patel Production Planning & Control
Y = 0.528 + 0.0801X
Prof. Shital Patel Production Planning & Control
Y8 = 0.528 + 0.0801(250) = Rs. 20.55 thousand
Y9 = 0.528 + 0.0801(270) = Rs. 22.16 thousand
Y10 = 0.528 + 0.0801(300) = Rs. 24.56 thousand
Note: RPC sales are expected to increase by
Rs. 80,100 for each additional million national
freight car loadings.
Prof. Shital Patel Production Planning & Control
• A simple regression model
(one independent variable) fits
a regression line in 2-
dimensional space
• A multiple regression model
with two explanatory variables
fits a regression plane in 3-
dimensional space
Prof. Shital Patel Production Planning & Control
 Multiple regression analysis is used when there are two
or more independent variables.
 An example of a multiple regression equation is:
Y = 50.0 + 0.05X1 + 0.10X2 – 0.03X3
where: Y = firm’s annual sales (Rs. thousands)
X1 = industry sales (Rs. thousands)
X2 = regional per capita income (Rs. thousands)
X3 = regional per capita debt (Rs. thousands)
Prof. Shital Patel Production Planning & Control
Coefficient of Correlation
x y x2 xy y2
120 9.5 14,400 1,140 90.25
135 11.0 18,225 1,485 121.00
130 12.0 16,900 1,560 144.00
150 12.5 22,500 1,875 156.25
170 14.0 28,900 2,380 196.00
190 16.0 36,100 3,040 256.00
220 18.0 48,400 3,960 324.00
1,115 93.0 185,425 15,440 1,287.50
Prof. Shital Patel Production Planning & Control
Coefficient of Correlation
r = 0.9829
r2 = (0.9829)2 = 0.966
96.6% of the variation in RPC sales is explained
by national freight car loadings.
Prof. Shital Patel Production Planning & Control
The past data regarding the sales of ABC for the
last five years is given below. Using the least
square method, fit a straight line. Estimate the
sales for the year 2021 and 2022.
Year 2016 2017 2018 2019 2020
Sales (‘00) 35 56 79 80 40
Prof. Shital Patel Production Planning & Control
Year Sales (y) Deviation(x) x2 xy
2016 35 -2 4 -70
2017 56 -1 1 -56
2018 79 0 0 0
2019 80 1 1 80
2020 40 2 4 80
N=5 ∑y=290 ∑x=0 ∑x2=10 ∑xy=34
Prof. Shital Patel Production Planning & Control
• In this case, as the number of periods is odd, we make ∑x=0, the
deviations are calculated from the middle period
• Now to fit straight lie y = a+bx, the a and b are calculated as
• a= ∑y/n=290/5=58
• b=∑xy/∑x2 =34/10=3.4
• y= 58+3.4x
• Deviation for 2021 is x=3 and for 2022 x=4
• Substituting values of x, we get
• Year 2021=58+3.4 X 3= 68.2, forecast is 6820 units
• Year 2022=58+3.4 X 4= 71.6, forecast is 7160 units
Prof. Shital Patel Production Planning & Control
• Least square method when the sum of
deviation is not zero (∑x ≠ 0)
• For y= a + bx,
Prof. Shital Patel Production Planning & Control
A company manufacturing washing machine establishes a
fact that there is a relationship between sale of washing
machine and population of the city. The market research
carried out reveals the following information. Fit linear
equation and estimate demand for 45 million population.
Population
( million)
5 7 15 22 27 36
Washing
machine
demand
(‘000)
28 40 65 80 96 130
Prof. Shital Patel Production Planning & Control
Population (x) Demand (y) x2 xy
5 28 25 140
7 40 49 280
15 65 225 975
22 80 484 1760
27 96 729 2592
36 130 1296 4680
∑x=112 ∑y=439 ∑x2=2808 ∑xy=10427
Prof. Shital Patel Production Planning & Control
= 15.07
= 3.11
Regression equation y=15.07 +3.11x
For 45 million, forecast demand
y=155.02=155020
Prof. Shital Patel Production Planning & Control
 Error - difference between actual value and predicted
value
 Mean Absolute Deviation (MAD)
– Average absolute error
 Mean Squared Error (MSE)
– Average of squared error
 Mean Absolute Percent Error (MAPE)
– Average absolute percent error
Prof. Shital Patel Production Planning & Control
MAD =
Actual forecast


n
MSE =
Actual forecast)
-1
2


n
(
MAPE =
Actual forecast

n
/ Actual ) *100
 (
Prof. Shital Patel Production Planning & Control
Period Actual Forecast (A-F) |A-F| (A-F)^2 (|A-F|/Actual)*100
1 217 215 2 2 4 0.92
2 213 216 -3 3 9 1.41
3 216 215 1 1 1 0.46
4 210 214 -4 4 16 1.90
5 213 211 2 2 4 0.94
6 219 214 5 5 25 2.28
7 216 217 -1 1 1 0.46
8 212 216 -4 4 16 1.89
-2 22 76 10.26
MAD= 2.75
MSE= 10.86
MAPE= 1.28
Prof. Shital Patel Production Planning & Control
• Aggregate Planning is an intermediate planning method used to determine the
necessary resource capacity a firm will need in order to meet its expected
demand with minimization of costs
• Medium range capacity planning that typically covers a 3 to 18 month period
of time
• Used in a manufacturing environment and determines overall output levels
planned as well as appropriate resource input mix to be used for related
groups of products
• The term "aggregate" is used because planning at this level includes all
resources "in the aggregate;" for example, as a product line or family
• Aggregate resources could be total number of workers, hours of machine time,
or tons of raw materials
Prof. Shital Patel Production Planning & Control
• It does not distinguish among sizes, colors, features, and so forth. For example,
with automobile manufacturing, aggregate planning would consider the total
number of cars planned for not the individual models, colors, or options
• It serve as a foundation for future short-range type planning, such as
production scheduling, sequencing, and loading.
• Steps taken to produce an aggregate plan begin with the determination of
demand and the determination of current capacity
• Capacity is expressed as total number of units per time period that can be
produced
• Demand is expressed as total number of units needed
• If the two are not in balance (equal), the firm must decide whether to increase
or decrease capacity to meet demand or increase or decrease demand to
meet capacity
Prof. Shital Patel Production Planning & Control
Aggregate
Plan for
Production
Demand
Forecasts,
orders
Master
Production
Schedule, and MRP systems
Detailed Work
Schedules
External
Capacity
Subcontractors
Inventory On
Hand
Raw Materials
Available
Work Force
Marketplace
and Demand
Research and
Technology
Product
Decisions
Process
Planning & Capacity
Decisions
Prof. Shital Patel Production Planning & Control
The main objectives :
• Maximize customer service.
• Minimize inventory investment.
• Minimize changes in workforce levels.
• Minimize changes in production rates.
• Maximize utilization of plant and equipment.
Prof. Shital Patel Production Planning & Control
• Plays an important part in achieving long-term objectives of the
organization
• Achieving financial goals by reducing overall variable cost and
improving the bottom line
• Maximum utilization of the available production facility
• Provide customer delight by matching demand and reducing
wait time for customers
• Reduce investment in inventory stocking
• Able to meet scheduling goals there by creating a happy and
satisfied work force
Prof. Shital Patel Production Planning & Control
• To minimize total production costs (labor, overtime, hiring/lay off, inventory carrying
cost)
• Helps achieve balance between operation goal, financial goal and overall strategic
objective of the organization
• It serves as a platform to manage capacity and demand planning.
• In a scenario where demand is not matching the capacity, an organization can try to
balance both by pricing, promotion, order management and new demand creation.
• In scenario where capacity is not matching demand, an organization can try to balance
the both by
1. Laying off/hiring excess/inadequate excess/inadequate excess/inadequate
workforce until demand decrease/increase.
2. Including overtime as part of scheduling there by creating additional capacity.
3. Hiring a temporary workforce for a fix period or outsourcing activity to a sub-
contractor.
Prof. Shital Patel Production Planning & Control
There are two pure planning strategies available to the aggregate planner:
• LEVEL STRATEGY
• CHASE STRATEGY
Level
Strategy
Chase
Strategy
Production
equals demand
Production rate is
constant
Prof. Shital Patel Production Planning & Control
• Steady production rate even though customer demand is low
• A first alternative would be to maintains a level workforce and a steady rate of
• Higher inventory levels than are currently needed
• As demand increases, the firm is able to continue a steady production rate/steady
employment level, while allowing the inventory surplus to absorb the increased demand
A second alternative would be to use a backlog or backorder.
• A backorder is simply a promise to deliver the product at a later date when it is more
readily available
• The backorder is a device for moving demand from one period to another, preferably
one in which demand is lower, thereby smoothing demand requirements over time.
 A level strategy allows a firm to maintain a constant level of output and still meet
demand maintaining employee relations
 Negative results - include the cost of excess inventory, subcontracting or overtime costs,
and backorder costs, which typically are the cost of expediting orders and the loss of
customer goodwill.
Prof. Shital Patel Production Planning & Control
• Demand Options — change demand:
– influencing demand
– backordering during high demand periods
– Counter seasonal product mixing
Prof. Shital Patel Production Planning & Control
• Matching demand and capacity period by period
• Results in
– A considerable amount of hiring, firing or laying off of employees-insecure and unhappy
employees, problems with labour unions
– Increased inventory carrying costs
– Erratic utilization of plant and equipment
The major advantage
• Flexibility of plant & worker utilization
• Allows inventory to be held to the lowest level possible
• Considerable savings
Most firms embracing the just-in-time production concept utilize a chase strategy approach to
aggregate planning.
• Most firms find it advantageous to utilize a combination of the level and chase
strategy. A combination strategy (sometimes called a hybrid or mixed strategy)
can be found to better meet organizational goals and policies and achieve
lower costs than either of the pure strategies used independently.
Prof. Shital Patel Production Planning & Control
Capacity Options — change capacity:
– changing inventory levels
– varying work force size by hiring or layoffs
– varying production capacity through overtime
or idle time
– subcontracting
– using part-time workers
Prof. Shital Patel Production Planning & Control
Option Advantage Disadvantage Some Comments
Changing
Inventory level
Changes in human
resources are
gradual, not
abrupt production
changes
Inventory holding
costs; Shortages
may results in lost
sales
Applies mainly to
production, not
service, operations
Varying workforce
size by hiring or
layoffs
Avoids use of
other alternatives
Hiring, layoff and
training costs
Used where size of
labour pool is
large
Prof. Shital Patel Production Planning & Control
Option Advantage Disadvantage Some Comments
Varying
production rates
through overtime
or idle time
Matches seasonal
Fluctuations
hiring/training
costs
Overtime
premiums, tired
workers, may not
meet demand
Allows flexibility
within the
aggregate plan
Subcontracting Permits flexibility
and smoothing of
the firm's output
Loss of quality
control; reduced
profits; loss of
future business
Applies mainly in
production
settings
Prof. Shital Patel Production Planning & Control
Option Advantage Disadvantage Some Comments
Using part-time
workers
Less costly and
more flexible than
full-time workers
High turnover/
training costs;
quality suffers;
scheduling
difficult
Good for unskilled
jobs in areas with
large temporary
labor pools
Influencing
demand
Tries to use excess
capacity Discounts
draw new
customers
Uncertainty in
demand. Hard to
match demand to
supply exactly
Creates marketing
ideas.
Overbooking
used in some
businesses
Prof. Shital Patel Production Planning & Control
Option Advantage Disadvantage Some Comments
Back ordering High
demand period
May avoid
overtime. Keeps
Capacity constant
Customer must be
willing to wait, but
goodwill is lost
Many companies
backorder
Counter seasonal
And service mixing
Fully utilizes
Resources ; allows
stable workforce
May require skills
or equipment
outside a firm’s
area of expertise
Risky finding
Products or
services with
opposite demand
pattern
Prof. Shital Patel Production Planning & Control
A company manufactures the consumer durable products and the company intends to develop an
aggregate plan for six months starting from January through June. The following information is available.
Demand for working days.
Month Jan Feb March April may June
Demand 500 600 650 800 900 800
Working days 22 19 21 21 22 20
Cost Details- 6. Labour hours required- Rs.4/unit
1. Material- Rs.100/unit 7. Lay off Costs- Rs.100/worker
2. Inventory carrying cost- Rs.10/unit/month 8. Regular time Costs ( For first 8hrs)- Rs.12.50/hour
3. Cost of stock outs- Rs.20/unit/month 9. Over time cost- Rs.18.75/hour
4. Cost of sub contracting- Rs.200/unit 10. Beginning inventory- 200 units
5. Hiring and Training cost- Rs.50/worker 11. Safety stock required- Nill
Prof. Shital Patel Production Planning & Control
Work out the cost of the following strategies-
1. Produce exactly to meet demand- vary the work force
2. Constant work force- vary inventory and allow shortages
3. Constant work force and use sub contracting
Solution:-
Strategy-1 Produce exactly to meet demand- vary the work force
Assumption- Opening work force equals the first month’s requirements
Aggregate Production Planning requirements
Jan Feb March April May June Total
Beginning Inventory 200 0 0 0 0 0
Forecasted Demand 500 600 650 800 900 800
Production requirement (demand + safety stock-
beginning inventory)
300 600 650 800 900 800
Ending Inventory (beginning inventory + production
requirement – demand forecast)
0 0 0 0 0 0
Prof. Shital Patel Production Planning & Control
Strategy – Exact Production, Vary work force
Jan Feb March April May June Total
Production requirement 300 460 650 800 900 800
Production Hrs. reqd. (Prod. Req x 4hrs/unit) 1200 2400 2600 3200 3600 3200
Working days per month 22 19 21 21 22 20
Hours/month/worker ( working days x 8 hrs/day) 176 152 168 168 176 160
No. of workers reqd.(Prod. Hrs reqd.÷ hrs/month/wrkr) 7 16 15 19 20 20
Net wrkr hired (assume opening wrkr =1st month of 7) 0 9 0 4 1 0
Hiring cost (wrkrs hired x Rs. 50) 0 450 0 200 50 0 700
Workers laid off 0 0 1 0 0 0
Lay off cost ( wrkrs laid off x Rs. 100) 0 0 100 0 0 0 100
Regular production cost( prod. Hrs.reqd. x 12.50 Rs./hr) 15000 30000 32500 40000 45000 40000 202500
Total 203300
Prof. Shital Patel Production Planning & Control
Strategy II – Constant work force, Vary Inventory and stock out
Jan Feb March April May June Total
Beginning inventory 200 140 -80 -310 -690 -1150
Working days per month 22 19 21 21 22 20
Produ.Hrs.availabl(working days/mthx8hrs/day x10wrkr) 1760 1520 1680 1680 1760 1600
Actual production(Prod. Hrs. available÷4hrs/unit) 440 380 420 420 440 400
Forecast demand 500 600 650 800 900 800
Ending inventory ( beginning inventory + actual) 140 -80 -310 -690 -1150 -1550
Shortage cost( Unit short x Rs. 20/unit) 0 1600 6200 13800 23000 31000 75600
Units Excess ( ending inventory – safety stock) 140 0 0 0 0 0
Inventory cost ( Unit excess x 10 ) 1400 0 0 0 0 0 0
Regular production cost ( prod.hrs.Reqd. x 12.50 Rs./hrs) 22000 19000 21000 21000 22000 20000 125000
Total 202000
Prof. Shital Patel Production Planning & Control
Strategy – Exact Production, Vary work force
Jan Feb March April May June Total
Production requirement 300 460 650 800 900 800
Working days per month 22 19 21 21 22 20
Prod. hrs. availabl(working days x 8 hrs/day x 10 wrkrs) 1760 1520 1680 1680 1760 1600
Actual production(Prod. Hrs. available÷4hrs/unit) 440 380 420 420 440 400
Unit subcontracted ( prod. Requirement- actual prod.) 0 220 230 380 460 400
Subcontracting cost( Unit subcontracted x Rs. 100) 0 8000 23000 38000 46000 4000 155000
Regular production cost( prod. Hrs.reqd. x 12.50 Rs./hr) 22000 19000 21000 21000 22000 20000 125000
Total 280000
Prof. Shital Patel Production Planning & Control
Strategy – Exact Production, Vary work force
PLAN Hiring Lay off Subcontract RT
production
Shortage Excess
Inventory
Total Cost
PLAN-I Exact Production,
Vary Work Force
700 100 - 202500 - - 2033000
PLAN-II Constant Work Force,
Vary Inventory and Shortages
- - - 125000 75600 1400 202000
PLAN – III Constant Work
Force Subcontract
- - 155000 125000 - - 280000
Assume a constant work force of 10
600-140 = 460 units of beginning inventory in February.
Prof. Shital Patel Production Planning & Control
• It is easy and simple to measure the capacity of the unit manufacturing
homogenous tangible products which can be counted and can be
expressed as number of units of output per period.
• For example, the capacity of a automobile unit can be expressed as
number of vehicles produced per month.
• However it is difficult to express the capacities when the company
manufactures multiple products and some of the products requiring
common facilities and others specialized facilities.
• In such cases the capacity is expressed as man hours, machine hours
or sometimes in terms of applicable resources.
• For example, a job shop can measure its capacity in machine hours and
man hours.
Prof. Shital Patel Production Planning & Control
• Design capacity: Designed capacity of a facility
is the planned or engineered rate of output of
goods or services under normal or full scale
operating conditions.
For example, the designed capacity of the
cement plant is 100 TPD (Tonnes per day).
Capacity of the sugar factory is 150 tonnes of
sugarcane crushing per day.
Prof. Shital Patel Production Planning & Control
• System capacity: System capacity is the maximum output of the
specific product or product mix the system of workers and machines is
capable of producing as an integrated whole
• System capacity is less than design capacity or at the most equal,
because of the limitation of product mix, quality specification,
breakdowns and some long range uncontrollable factors
• The actual is even less because of many factors affecting the output
such as actual demand, downtime due to machine/equipment failure,
unauthorized absenteeism, inefficiency of labor
• The system efficiency is expressed as ratio of actual measured output
to the system capacity.
• System Efficiency (SE)=Actual output/System capacity
Prof. Shital Patel Production Planning & Control
• Licensed capacity: Capacity licensed by the various
regulatory agencies or government authorities. This
is the limitation on the output exercised by the
government.
• Installed capacity: The capacity provided at the time
of installation of the plant is called installed capacity.
• Rated capacity: Capacity based on the highest
production rate established by actual trials is
referred to as rated capacity.
Prof. Shital Patel Production Planning & Control
Effective capacity planning is dependent upon factors like
1. Forecast of Demand,
2. Production facility (layout, design, and location),
3. Product line or matrix,
4. Production technology,
5. Plant & Labour efficiency,
6. Human capital (job design, compensation),
7. Multiple shift operations,
8. Subcontracting,
9. Operational structure (scheduling, quality assurance) and
10. External structure ( Management policy, safety regulations)
Prof. Shital Patel Production Planning & Control
• Capacity planning is concerned with defining the long-term and
the short-term capacity needs of an organization and
determining how those needs will be satisfied
• Capacity planning decisions are taken based upon the consumer
demand and this is merged with the human, material and
financial resources of the organization.
• Capacity requirements can be evaluated from two perspectives
long-term capacity strategies and short-term capacity strategies.
Prof. Shital Patel Production Planning & Control
• Long-term capacity requirements are more difficult to determine because the
future demand and technology are uncertain
• Forecasting for five or ten years into the future is more risky and difficult
• Even sometimes company’s today’s products may not be existing in the future
• Long range capacity requirements are dependent on marketing plans, product
development and life- cycle of the product
• Long-term capacity planning is concerned with accommodating major changes
that affect overall level of the output in long-term
• Marketing environmental assessment and implementing the long-term
capacity plans in a systematic manner are the major responsibilities of
management
Prof. Shital Patel Production Planning & Control
• Following parameters will affect long range capacity decisions
– Multiple products
– Phasing in capacity
– Phasing out capacity
Multiple products
– Company’s produce more than one product using the same facilities in
order to increase the profit.
– The manufacturing of multiple products will reduce the risk of failure.
– Having more than one product helps the capacity planners to do a better
job.
– Because products are in different stages of their life-cycles, it is easy to
schedule them to get maximum capacity utilization.
Prof. Shital Patel Production Planning & Control
Phasing in capacity:
 In high technology industries, and in industries where technology
developments are very fast, the rate of obsolescence is high.
 The products should be brought into the market quickly.
 The time to construct the facilities will be long and there is no much time as
the products should be introduced into the market quickly.
 Here the solution is phase in capacity on modular basis.
 Some commitment is made for building funds and men towards facilities over a
period of 3–5 years.
 This is an effective way of capitalizing on technological breakthrough.
Prof. Shital Patel Production Planning & Control
Phasing out capacity :
 The outdated manufacturing facilities cause excessive plant closures and down
time.
 The impact of closures is not limited to only fixed costs of plant and machinery.
 Thus, the phasing out here is done with humanistic way without affecting the
community.
 The phasing out options makes alternative arrangements for men like shifting
them to other jobs or to other locations, compensating the employees, etc.
Prof. Shital Patel Production Planning & Control
• Managers often use forecasts of product demand to estimate the short-term workload the facility must
handle.
• Also looking ahead up to 12 months, anticipate output requirements for different products, and
services.
• Managers then compare requirements with existing capacity and then take decisions as to when the
capacity adjustments are needed.
• For short-term periods of up to one year, fundamental capacity is fixed and major facilities will not be
changed.
• Many short-term adjustments for increasing or decreasing capacity are possible and its requirement
depend upon the conversion process like whether it is capital intensive or labor intensive or whether
product can be stored as inventory.
• Capital intensive processes depend on physical facilities, plant and equipment.
• Short-term capacity can be modified by operating these facilities more or less intensively than normal.
• In labor intensive processes short-term capacity can be changed by laying off or hiring people or by
giving overtime to workers.
• The strategies for changing capacity also depend upon how long the product can be stored as
inventory.
Prof. Shital Patel Production Planning & Control
• The short-term capacity strategies are:
– Inventories: Stock of finished goods during slack periods to meet the
demand during peak period.
– Backlog: During peak periods, the willing customers are requested to wait
and their orders are fulfilled after a peak demand period.
– Employment level (hiring or firing): Hire additional employees during
peak demand period and layoff employees as demand decreases.
– Employee training: Develop multi-skilled employees through training so
that they can be rotated among different jobs. The multi-skilling helps as
an alternative to hiring employees.
– Subcontracting: During peak periods, hire the capacity of other firms
temporarily to make the component parts or products.
– Process design: Change job contents by redesigning the job.
Prof. Shital Patel Production Planning & Control
• The main goal in rough-cut capacity planning is to identify
where overloading or under-loading of production capacity
occurs and revise the MPS as required.
• Overloading means that too much production of products
has been planned in the facility and insufficient capacity
exists to produce planned quantities of products required
in MPS.
• Under-loading means that not enough production of
products has been planned to fully load the facility.
Prof. Shital Patel Production Planning & Control
• Rough cut capacity planning (RCCP) is the process of verifying if organization
have sufficient capacity available to meet the requirements of master
production schedule across a specific period.
• RCCP is a long-term technique that marketing and production departments
will use to stabilize the capacity available and what is required, so organization
can make changes to production schedule or available capacity.
• Traditionally, many manufacturers would adopt Master Resource Planning
(MRP-II) software to pull off their rough cut capacity planning, as it’s a
Production Management Software that gives the tools for:
• — Production planning and scheduling;
• — Raw material and finished goods inventory management; and
• — Calculating manufacturing costs.
Prof. Shital Patel Production Planning & Control
• When organization working out rough cut capacity planning, it can be done at
two levels:
• Routing-Based RCCP
• Routing-based rough cut capacity planning shows resource availability. For
this, organization is going to look into the required and available capacity in
hours per week per resource.
• Rate-Based RCCP
• This is where organization measure rough cut capacity by production lines. For
this, organization will need to figure out required and available capacity per
week per production line.
• So, to quickly summarize, rough cut capacity planning will look into how much
need to produce, how much are organization able to produce, and how can
find a balance between the two.
Prof. Shital Patel Production Planning & Control
Benefits-
It’s worth reiterating that rough cut capacity planning allows to understand
how much supply are going to need to meet demand, but also give a schedule
that is flexible (as things happen on the shop floor which disrupts
production).
But, other benefits of rough cut capacity planning includes:
• Improved Project Management
• Understanding all operations and outstanding job operations means ,
organization can improve project management.
• For example, one can see which operations should start by a specific date, and
which jobs can start later because they have a short turnaround.
• Essentially, organization team will be able to easily prioritize operations by
their start date.
Prof. Shital Patel Production Planning & Control
• Better Resource Management
• Rough cut capacity planning allows to understand the total
number of hours of work for each week by each manufacturing
process.
• For example, knowing how much work is passing through a
workstation can help to determine if too much or not
enough workloads are being processed, which will allow to
adjust the capacity by:
• — Changing the number of shifts;
• — Changing the number of workstations in operation; or
• — Passing operations onto a contract manufacturer.
Prof. Shital Patel Production Planning & Control
• Improved Manufacturing Lead Time
• The transparency offered by rough cut capacity planning allows manufacturers
to easily identify areas along their production lines that are being overworked
or are prone to other issues such as a bottleneck in production.
• With this overview, it’s easy to see an area of concern and make important
business decisions immediately to address the problem, which is going to:
• — Reduce your manufacturing lead time;
• — Reduce costs; and
• — Improve customer satisfaction by finishing projects on-time.
• The benefits of rough cut capacity planning are numerous. But, to pull off
RCCP, organization needs to develop proper planning and forecasting
Prof. Shital Patel Production Planning & Control
The following data gives the sales of the company for the various
years. Fit the straight line and forecast the sales for the year 2018
and 2019. [Tabulate the calculations] ( Dec.17)
Year 2009 2010 2011 2012 2013 2014 2015 2016 2017
Sales
(‘000)
13 20 20 28 30 32 33 38 43
Prof. Shital Patel Production Planning & Control
Year Sales (y) Deviation (x) x2 xy
1 13 -4 16 -52
2 20 -3 9 -60
3 20 -2 4 -40
4 28 -1 1 -28
5 30 0 0 0
6 32 1 1 32
7 33 2 4 66
8 38 3 9 114
9 43 4 16 172
∑y=257 ∑x = 0 ∑x2 = 60 ∑xy = 204
Prof. Shital Patel Production Planning & Control
• a= 28.56
• b=3.4
• Y= 28.56 + 3.4x
• Forecast for 2018, y18= 45560
• Forecast for 2019, y19= 49000

More Related Content

What's hot

Capacity planning
Capacity planningCapacity planning
Capacity planningRatan479
 
Chapter 7 demand forecasting in a supply chain
Chapter 7 demand forecasting in a supply chainChapter 7 demand forecasting in a supply chain
Chapter 7 demand forecasting in a supply chainsajidsharif2022
 
Forecasting in Supply Chain
Forecasting in Supply ChainForecasting in Supply Chain
Forecasting in Supply ChainE P John
 
Supply Chain Management chap 11
Supply Chain Management chap 11Supply Chain Management chap 11
Supply Chain Management chap 11Umair Arain
 
Supply Chain Integration Strategies
Supply Chain Integration StrategiesSupply Chain Integration Strategies
Supply Chain Integration StrategiesBidyut Bikash
 
Sales & Operations Planning Process
Sales & Operations Planning ProcessSales & Operations Planning Process
Sales & Operations Planning ProcessHarshal Badgujar
 
Supply Chain Management chap 18
Supply Chain Management chap 18Supply Chain Management chap 18
Supply Chain Management chap 18Umair Arain
 
Supply Chain Management chap 5
Supply Chain Management chap 5Supply Chain Management chap 5
Supply Chain Management chap 5Umair Arain
 
Supply Chain Management chap 4
Supply Chain Management chap 4Supply Chain Management chap 4
Supply Chain Management chap 4Umair Arain
 
Supply Chain Management chap 15
Supply Chain Management chap 15Supply Chain Management chap 15
Supply Chain Management chap 15Umair Arain
 
Supply chain performance achieving strategic fit and scope MBA STRATERGIC MAN...
Supply chain performance achieving strategic fit and scope MBA STRATERGIC MAN...Supply chain performance achieving strategic fit and scope MBA STRATERGIC MAN...
Supply chain performance achieving strategic fit and scope MBA STRATERGIC MAN...Babasab Patil
 
Supply chain management ch03 chopra
Supply chain management ch03 chopraSupply chain management ch03 chopra
Supply chain management ch03 chopraJamil Ahmed AKASH
 
Chapter 3 forecasting.ppt
Chapter 3 forecasting.pptChapter 3 forecasting.ppt
Chapter 3 forecasting.pptAmira591487
 
Theory of Constraints
Theory of ConstraintsTheory of Constraints
Theory of ConstraintsIshan Parekh
 
Capacity planning mom
Capacity  planning momCapacity  planning mom
Capacity planning mompratisoni
 
Supply Chain Management chap 10
Supply Chain Management chap 10Supply Chain Management chap 10
Supply Chain Management chap 10Umair Arain
 

What's hot (20)

Capacity planning
Capacity planningCapacity planning
Capacity planning
 
Chopra Meindl Chapter 8
Chopra Meindl Chapter 8Chopra Meindl Chapter 8
Chopra Meindl Chapter 8
 
Chapter 7 demand forecasting in a supply chain
Chapter 7 demand forecasting in a supply chainChapter 7 demand forecasting in a supply chain
Chapter 7 demand forecasting in a supply chain
 
Forecasting in Supply Chain
Forecasting in Supply ChainForecasting in Supply Chain
Forecasting in Supply Chain
 
Supply Chain Management chap 11
Supply Chain Management chap 11Supply Chain Management chap 11
Supply Chain Management chap 11
 
Supply Chain Integration Strategies
Supply Chain Integration StrategiesSupply Chain Integration Strategies
Supply Chain Integration Strategies
 
Sales & Operations Planning Process
Sales & Operations Planning ProcessSales & Operations Planning Process
Sales & Operations Planning Process
 
Supply Chain Management chap 18
Supply Chain Management chap 18Supply Chain Management chap 18
Supply Chain Management chap 18
 
Supply Chain Management chap 5
Supply Chain Management chap 5Supply Chain Management chap 5
Supply Chain Management chap 5
 
Supply Chain Management chap 4
Supply Chain Management chap 4Supply Chain Management chap 4
Supply Chain Management chap 4
 
Supply Chain Management chap 15
Supply Chain Management chap 15Supply Chain Management chap 15
Supply Chain Management chap 15
 
Supply chain performance achieving strategic fit and scope MBA STRATERGIC MAN...
Supply chain performance achieving strategic fit and scope MBA STRATERGIC MAN...Supply chain performance achieving strategic fit and scope MBA STRATERGIC MAN...
Supply chain performance achieving strategic fit and scope MBA STRATERGIC MAN...
 
Supply chain management ch03 chopra
Supply chain management ch03 chopraSupply chain management ch03 chopra
Supply chain management ch03 chopra
 
Chapter 3 forecasting.ppt
Chapter 3 forecasting.pptChapter 3 forecasting.ppt
Chapter 3 forecasting.ppt
 
Theory of Constraints
Theory of ConstraintsTheory of Constraints
Theory of Constraints
 
Models of aggregate planning
Models of aggregate planningModels of aggregate planning
Models of aggregate planning
 
Capacity planning mom
Capacity  planning momCapacity  planning mom
Capacity planning mom
 
Chopra Meindl Chapter 9
Chopra Meindl Chapter 9Chopra Meindl Chapter 9
Chopra Meindl Chapter 9
 
Supply Chain Management chap 10
Supply Chain Management chap 10Supply Chain Management chap 10
Supply Chain Management chap 10
 
Jit
JitJit
Jit
 

Similar to 2.Forecasting, Aggregate planning, Capacity planning.pptx

What is Forecasting.pdf
What is Forecasting.pdfWhat is Forecasting.pdf
What is Forecasting.pdfPankaj Chandel
 
Demand forecasting in supply chain
Demand forecasting in supply chainDemand forecasting in supply chain
Demand forecasting in supply chainvishnuvsvn
 
Week 10_Demand Forecasting.pdf
Week 10_Demand Forecasting.pdfWeek 10_Demand Forecasting.pdf
Week 10_Demand Forecasting.pdfssusercbc19c
 
Production planning and control; Sale Froecasting
Production planning and control; Sale FroecastingProduction planning and control; Sale Froecasting
Production planning and control; Sale Froecastingssp183
 
18ME56 Operations Management- Module 2-Forecasting
18ME56 Operations Management- Module 2-Forecasting18ME56 Operations Management- Module 2-Forecasting
18ME56 Operations Management- Module 2-ForecastingDr. Bhimsen Soragaon
 
Forecasting.pptx
Forecasting.pptxForecasting.pptx
Forecasting.pptxSairaali51
 
18ME56-OM_ Module 2-Forecasting.pdf
18ME56-OM_ Module 2-Forecasting.pdf18ME56-OM_ Module 2-Forecasting.pdf
18ME56-OM_ Module 2-Forecasting.pdfDr. Bhimsen Soragaon
 
7. Demand Forecast.pdf
7. Demand Forecast.pdf7. Demand Forecast.pdf
7. Demand Forecast.pdfdrgurudutta
 
A presentation on Demand forecasting
A presentation on Demand forecastingA presentation on Demand forecasting
A presentation on Demand forecastingethanmahmud
 
Forecasting practice in manufacturing business
Forecasting practice in manufacturing businessForecasting practice in manufacturing business
Forecasting practice in manufacturing businessMRPeasy
 
Forecasting subject in Marketing Management.pptx
Forecasting subject in Marketing Management.pptxForecasting subject in Marketing Management.pptx
Forecasting subject in Marketing Management.pptxRajMishra712896
 
Bba 1584 planning n forecasting
Bba 1584 planning n forecastingBba 1584 planning n forecasting
Bba 1584 planning n forecastinglecturer-notes2014
 
"From Insights to Production with Big Data Analytics", Eliano Marques, Senior...
"From Insights to Production with Big Data Analytics", Eliano Marques, Senior..."From Insights to Production with Big Data Analytics", Eliano Marques, Senior...
"From Insights to Production with Big Data Analytics", Eliano Marques, Senior...Dataconomy Media
 
FORECASTING TECHNIQUES.pdf
 FORECASTING TECHNIQUES.pdf FORECASTING TECHNIQUES.pdf
FORECASTING TECHNIQUES.pdfvijay511413
 

Similar to 2.Forecasting, Aggregate planning, Capacity planning.pptx (20)

What is Forecasting.pdf
What is Forecasting.pdfWhat is Forecasting.pdf
What is Forecasting.pdf
 
Demand forecasting in supply chain
Demand forecasting in supply chainDemand forecasting in supply chain
Demand forecasting in supply chain
 
Week 10_Demand Forecasting.pdf
Week 10_Demand Forecasting.pdfWeek 10_Demand Forecasting.pdf
Week 10_Demand Forecasting.pdf
 
Topic1
Topic1Topic1
Topic1
 
Forecasting
ForecastingForecasting
Forecasting
 
Production planning and control; Sale Froecasting
Production planning and control; Sale FroecastingProduction planning and control; Sale Froecasting
Production planning and control; Sale Froecasting
 
FORECASTING
FORECASTINGFORECASTING
FORECASTING
 
18ME56 Operations Management- Module 2-Forecasting
18ME56 Operations Management- Module 2-Forecasting18ME56 Operations Management- Module 2-Forecasting
18ME56 Operations Management- Module 2-Forecasting
 
Forecasting.pptx
Forecasting.pptxForecasting.pptx
Forecasting.pptx
 
18ME56-OM_ Module 2-Forecasting.pdf
18ME56-OM_ Module 2-Forecasting.pdf18ME56-OM_ Module 2-Forecasting.pdf
18ME56-OM_ Module 2-Forecasting.pdf
 
7. Demand Forecast.pdf
7. Demand Forecast.pdf7. Demand Forecast.pdf
7. Demand Forecast.pdf
 
Planning and decision making.pptx
Planning and decision making.pptxPlanning and decision making.pptx
Planning and decision making.pptx
 
A presentation on Demand forecasting
A presentation on Demand forecastingA presentation on Demand forecasting
A presentation on Demand forecasting
 
Forecasting practice in manufacturing business
Forecasting practice in manufacturing businessForecasting practice in manufacturing business
Forecasting practice in manufacturing business
 
Forecasting subject in Marketing Management.pptx
Forecasting subject in Marketing Management.pptxForecasting subject in Marketing Management.pptx
Forecasting subject in Marketing Management.pptx
 
Bba 1584 planning n forecasting
Bba 1584 planning n forecastingBba 1584 planning n forecasting
Bba 1584 planning n forecasting
 
Demand forecasting
Demand forecastingDemand forecasting
Demand forecasting
 
Big Data Analytics: From Insights to Production
Big Data Analytics: From Insights to ProductionBig Data Analytics: From Insights to Production
Big Data Analytics: From Insights to Production
 
"From Insights to Production with Big Data Analytics", Eliano Marques, Senior...
"From Insights to Production with Big Data Analytics", Eliano Marques, Senior..."From Insights to Production with Big Data Analytics", Eliano Marques, Senior...
"From Insights to Production with Big Data Analytics", Eliano Marques, Senior...
 
FORECASTING TECHNIQUES.pdf
 FORECASTING TECHNIQUES.pdf FORECASTING TECHNIQUES.pdf
FORECASTING TECHNIQUES.pdf
 

More from virshit

5.Production Scheduling and Sequencing.pptx
5.Production Scheduling and Sequencing.pptx5.Production Scheduling and Sequencing.pptx
5.Production Scheduling and Sequencing.pptxvirshit
 
4.Process Planning and Line Balancing.pptx
4.Process Planning and Line Balancing.pptx4.Process Planning and Line Balancing.pptx
4.Process Planning and Line Balancing.pptxvirshit
 
Agile manufacturing.pptx
Agile manufacturing.pptxAgile manufacturing.pptx
Agile manufacturing.pptxvirshit
 
Facility Design.pptx
Facility Design.pptxFacility Design.pptx
Facility Design.pptxvirshit
 
Work system design.pptx
Work system design.pptxWork system design.pptx
Work system design.pptxvirshit
 
Work study.pptx
Work study.pptxWork study.pptx
Work study.pptxvirshit
 
Value Engineering and Value Analysis.pptx
Value Engineering and Value Analysis.pptxValue Engineering and Value Analysis.pptx
Value Engineering and Value Analysis.pptxvirshit
 
Introduction to Industrial Engineering.pptx
Introduction to Industrial Engineering.pptxIntroduction to Industrial Engineering.pptx
Introduction to Industrial Engineering.pptxvirshit
 

More from virshit (8)

5.Production Scheduling and Sequencing.pptx
5.Production Scheduling and Sequencing.pptx5.Production Scheduling and Sequencing.pptx
5.Production Scheduling and Sequencing.pptx
 
4.Process Planning and Line Balancing.pptx
4.Process Planning and Line Balancing.pptx4.Process Planning and Line Balancing.pptx
4.Process Planning and Line Balancing.pptx
 
Agile manufacturing.pptx
Agile manufacturing.pptxAgile manufacturing.pptx
Agile manufacturing.pptx
 
Facility Design.pptx
Facility Design.pptxFacility Design.pptx
Facility Design.pptx
 
Work system design.pptx
Work system design.pptxWork system design.pptx
Work system design.pptx
 
Work study.pptx
Work study.pptxWork study.pptx
Work study.pptx
 
Value Engineering and Value Analysis.pptx
Value Engineering and Value Analysis.pptxValue Engineering and Value Analysis.pptx
Value Engineering and Value Analysis.pptx
 
Introduction to Industrial Engineering.pptx
Introduction to Industrial Engineering.pptxIntroduction to Industrial Engineering.pptx
Introduction to Industrial Engineering.pptx
 

Recently uploaded

Introduction and different types of Ethernet.pptx
Introduction and different types of Ethernet.pptxIntroduction and different types of Ethernet.pptx
Introduction and different types of Ethernet.pptxupamatechverse
 
VIP Call Girls Service Hitech City Hyderabad Call +91-8250192130
VIP Call Girls Service Hitech City Hyderabad Call +91-8250192130VIP Call Girls Service Hitech City Hyderabad Call +91-8250192130
VIP Call Girls Service Hitech City Hyderabad Call +91-8250192130Suhani Kapoor
 
Introduction to Multiple Access Protocol.pptx
Introduction to Multiple Access Protocol.pptxIntroduction to Multiple Access Protocol.pptx
Introduction to Multiple Access Protocol.pptxupamatechverse
 
Porous Ceramics seminar and technical writing
Porous Ceramics seminar and technical writingPorous Ceramics seminar and technical writing
Porous Ceramics seminar and technical writingrakeshbaidya232001
 
APPLICATIONS-AC/DC DRIVES-OPERATING CHARACTERISTICS
APPLICATIONS-AC/DC DRIVES-OPERATING CHARACTERISTICSAPPLICATIONS-AC/DC DRIVES-OPERATING CHARACTERISTICS
APPLICATIONS-AC/DC DRIVES-OPERATING CHARACTERISTICSKurinjimalarL3
 
Software Development Life Cycle By Team Orange (Dept. of Pharmacy)
Software Development Life Cycle By  Team Orange (Dept. of Pharmacy)Software Development Life Cycle By  Team Orange (Dept. of Pharmacy)
Software Development Life Cycle By Team Orange (Dept. of Pharmacy)Suman Mia
 
Call for Papers - Educational Administration: Theory and Practice, E-ISSN: 21...
Call for Papers - Educational Administration: Theory and Practice, E-ISSN: 21...Call for Papers - Educational Administration: Theory and Practice, E-ISSN: 21...
Call for Papers - Educational Administration: Theory and Practice, E-ISSN: 21...Christo Ananth
 
247267395-1-Symmetric-and-distributed-shared-memory-architectures-ppt (1).ppt
247267395-1-Symmetric-and-distributed-shared-memory-architectures-ppt (1).ppt247267395-1-Symmetric-and-distributed-shared-memory-architectures-ppt (1).ppt
247267395-1-Symmetric-and-distributed-shared-memory-architectures-ppt (1).pptssuser5c9d4b1
 
Microscopic Analysis of Ceramic Materials.pptx
Microscopic Analysis of Ceramic Materials.pptxMicroscopic Analysis of Ceramic Materials.pptx
Microscopic Analysis of Ceramic Materials.pptxpurnimasatapathy1234
 
Coefficient of Thermal Expansion and their Importance.pptx
Coefficient of Thermal Expansion and their Importance.pptxCoefficient of Thermal Expansion and their Importance.pptx
Coefficient of Thermal Expansion and their Importance.pptxAsutosh Ranjan
 
Sheet Pile Wall Design and Construction: A Practical Guide for Civil Engineer...
Sheet Pile Wall Design and Construction: A Practical Guide for Civil Engineer...Sheet Pile Wall Design and Construction: A Practical Guide for Civil Engineer...
Sheet Pile Wall Design and Construction: A Practical Guide for Civil Engineer...Dr.Costas Sachpazis
 
Top Rated Pune Call Girls Budhwar Peth ⟟ 6297143586 ⟟ Call Me For Genuine Se...
Top Rated  Pune Call Girls Budhwar Peth ⟟ 6297143586 ⟟ Call Me For Genuine Se...Top Rated  Pune Call Girls Budhwar Peth ⟟ 6297143586 ⟟ Call Me For Genuine Se...
Top Rated Pune Call Girls Budhwar Peth ⟟ 6297143586 ⟟ Call Me For Genuine Se...Call Girls in Nagpur High Profile
 
(ANJALI) Dange Chowk Call Girls Just Call 7001035870 [ Cash on Delivery ] Pun...
(ANJALI) Dange Chowk Call Girls Just Call 7001035870 [ Cash on Delivery ] Pun...(ANJALI) Dange Chowk Call Girls Just Call 7001035870 [ Cash on Delivery ] Pun...
(ANJALI) Dange Chowk Call Girls Just Call 7001035870 [ Cash on Delivery ] Pun...ranjana rawat
 
SPICE PARK APR2024 ( 6,793 SPICE Models )
SPICE PARK APR2024 ( 6,793 SPICE Models )SPICE PARK APR2024 ( 6,793 SPICE Models )
SPICE PARK APR2024 ( 6,793 SPICE Models )Tsuyoshi Horigome
 
(PRIYA) Rajgurunagar Call Girls Just Call 7001035870 [ Cash on Delivery ] Pun...
(PRIYA) Rajgurunagar Call Girls Just Call 7001035870 [ Cash on Delivery ] Pun...(PRIYA) Rajgurunagar Call Girls Just Call 7001035870 [ Cash on Delivery ] Pun...
(PRIYA) Rajgurunagar Call Girls Just Call 7001035870 [ Cash on Delivery ] Pun...ranjana rawat
 
Booking open Available Pune Call Girls Koregaon Park 6297143586 Call Hot Ind...
Booking open Available Pune Call Girls Koregaon Park  6297143586 Call Hot Ind...Booking open Available Pune Call Girls Koregaon Park  6297143586 Call Hot Ind...
Booking open Available Pune Call Girls Koregaon Park 6297143586 Call Hot Ind...Call Girls in Nagpur High Profile
 
VIP Call Girls Service Kondapur Hyderabad Call +91-8250192130
VIP Call Girls Service Kondapur Hyderabad Call +91-8250192130VIP Call Girls Service Kondapur Hyderabad Call +91-8250192130
VIP Call Girls Service Kondapur Hyderabad Call +91-8250192130Suhani Kapoor
 
HARDNESS, FRACTURE TOUGHNESS AND STRENGTH OF CERAMICS
HARDNESS, FRACTURE TOUGHNESS AND STRENGTH OF CERAMICSHARDNESS, FRACTURE TOUGHNESS AND STRENGTH OF CERAMICS
HARDNESS, FRACTURE TOUGHNESS AND STRENGTH OF CERAMICSRajkumarAkumalla
 

Recently uploaded (20)

Introduction and different types of Ethernet.pptx
Introduction and different types of Ethernet.pptxIntroduction and different types of Ethernet.pptx
Introduction and different types of Ethernet.pptx
 
VIP Call Girls Service Hitech City Hyderabad Call +91-8250192130
VIP Call Girls Service Hitech City Hyderabad Call +91-8250192130VIP Call Girls Service Hitech City Hyderabad Call +91-8250192130
VIP Call Girls Service Hitech City Hyderabad Call +91-8250192130
 
Introduction to Multiple Access Protocol.pptx
Introduction to Multiple Access Protocol.pptxIntroduction to Multiple Access Protocol.pptx
Introduction to Multiple Access Protocol.pptx
 
Porous Ceramics seminar and technical writing
Porous Ceramics seminar and technical writingPorous Ceramics seminar and technical writing
Porous Ceramics seminar and technical writing
 
APPLICATIONS-AC/DC DRIVES-OPERATING CHARACTERISTICS
APPLICATIONS-AC/DC DRIVES-OPERATING CHARACTERISTICSAPPLICATIONS-AC/DC DRIVES-OPERATING CHARACTERISTICS
APPLICATIONS-AC/DC DRIVES-OPERATING CHARACTERISTICS
 
Software Development Life Cycle By Team Orange (Dept. of Pharmacy)
Software Development Life Cycle By  Team Orange (Dept. of Pharmacy)Software Development Life Cycle By  Team Orange (Dept. of Pharmacy)
Software Development Life Cycle By Team Orange (Dept. of Pharmacy)
 
Call for Papers - Educational Administration: Theory and Practice, E-ISSN: 21...
Call for Papers - Educational Administration: Theory and Practice, E-ISSN: 21...Call for Papers - Educational Administration: Theory and Practice, E-ISSN: 21...
Call for Papers - Educational Administration: Theory and Practice, E-ISSN: 21...
 
247267395-1-Symmetric-and-distributed-shared-memory-architectures-ppt (1).ppt
247267395-1-Symmetric-and-distributed-shared-memory-architectures-ppt (1).ppt247267395-1-Symmetric-and-distributed-shared-memory-architectures-ppt (1).ppt
247267395-1-Symmetric-and-distributed-shared-memory-architectures-ppt (1).ppt
 
Microscopic Analysis of Ceramic Materials.pptx
Microscopic Analysis of Ceramic Materials.pptxMicroscopic Analysis of Ceramic Materials.pptx
Microscopic Analysis of Ceramic Materials.pptx
 
Coefficient of Thermal Expansion and their Importance.pptx
Coefficient of Thermal Expansion and their Importance.pptxCoefficient of Thermal Expansion and their Importance.pptx
Coefficient of Thermal Expansion and their Importance.pptx
 
Roadmap to Membership of RICS - Pathways and Routes
Roadmap to Membership of RICS - Pathways and RoutesRoadmap to Membership of RICS - Pathways and Routes
Roadmap to Membership of RICS - Pathways and Routes
 
Sheet Pile Wall Design and Construction: A Practical Guide for Civil Engineer...
Sheet Pile Wall Design and Construction: A Practical Guide for Civil Engineer...Sheet Pile Wall Design and Construction: A Practical Guide for Civil Engineer...
Sheet Pile Wall Design and Construction: A Practical Guide for Civil Engineer...
 
Top Rated Pune Call Girls Budhwar Peth ⟟ 6297143586 ⟟ Call Me For Genuine Se...
Top Rated  Pune Call Girls Budhwar Peth ⟟ 6297143586 ⟟ Call Me For Genuine Se...Top Rated  Pune Call Girls Budhwar Peth ⟟ 6297143586 ⟟ Call Me For Genuine Se...
Top Rated Pune Call Girls Budhwar Peth ⟟ 6297143586 ⟟ Call Me For Genuine Se...
 
(ANJALI) Dange Chowk Call Girls Just Call 7001035870 [ Cash on Delivery ] Pun...
(ANJALI) Dange Chowk Call Girls Just Call 7001035870 [ Cash on Delivery ] Pun...(ANJALI) Dange Chowk Call Girls Just Call 7001035870 [ Cash on Delivery ] Pun...
(ANJALI) Dange Chowk Call Girls Just Call 7001035870 [ Cash on Delivery ] Pun...
 
SPICE PARK APR2024 ( 6,793 SPICE Models )
SPICE PARK APR2024 ( 6,793 SPICE Models )SPICE PARK APR2024 ( 6,793 SPICE Models )
SPICE PARK APR2024 ( 6,793 SPICE Models )
 
(PRIYA) Rajgurunagar Call Girls Just Call 7001035870 [ Cash on Delivery ] Pun...
(PRIYA) Rajgurunagar Call Girls Just Call 7001035870 [ Cash on Delivery ] Pun...(PRIYA) Rajgurunagar Call Girls Just Call 7001035870 [ Cash on Delivery ] Pun...
(PRIYA) Rajgurunagar Call Girls Just Call 7001035870 [ Cash on Delivery ] Pun...
 
Booking open Available Pune Call Girls Koregaon Park 6297143586 Call Hot Ind...
Booking open Available Pune Call Girls Koregaon Park  6297143586 Call Hot Ind...Booking open Available Pune Call Girls Koregaon Park  6297143586 Call Hot Ind...
Booking open Available Pune Call Girls Koregaon Park 6297143586 Call Hot Ind...
 
VIP Call Girls Service Kondapur Hyderabad Call +91-8250192130
VIP Call Girls Service Kondapur Hyderabad Call +91-8250192130VIP Call Girls Service Kondapur Hyderabad Call +91-8250192130
VIP Call Girls Service Kondapur Hyderabad Call +91-8250192130
 
★ CALL US 9953330565 ( HOT Young Call Girls In Badarpur delhi NCR
★ CALL US 9953330565 ( HOT Young Call Girls In Badarpur delhi NCR★ CALL US 9953330565 ( HOT Young Call Girls In Badarpur delhi NCR
★ CALL US 9953330565 ( HOT Young Call Girls In Badarpur delhi NCR
 
HARDNESS, FRACTURE TOUGHNESS AND STRENGTH OF CERAMICS
HARDNESS, FRACTURE TOUGHNESS AND STRENGTH OF CERAMICSHARDNESS, FRACTURE TOUGHNESS AND STRENGTH OF CERAMICS
HARDNESS, FRACTURE TOUGHNESS AND STRENGTH OF CERAMICS
 

2.Forecasting, Aggregate planning, Capacity planning.pptx

  • 1. Production Planning & Control Prof. Shital Patel FORECASTING AGGREGATE PLANNING CAPACITY PLANNING
  • 2. Prof. Shital Patel Production Planning & Control
  • 3. Prof. Shital Patel Production Planning & Control
  • 4. Prof. Shital Patel Production Planning & Control • Forecasting is the art and science of predicting what will happen in the future • Determined by a mathematical method or on the intuition of the Experts–combination
  • 5. Prof. Shital Patel Production Planning & Control • Majority of the industrial activities depend upon the future sales. • Projected demand for the future assists in decision making with respect to investment in plant and machinery, market planning and programmers. • To schedule the production activity to ensure optimum utilization of plant’s capacity. • To prepare material planning to take up replenishment action to make the materials available at right quantity and right time. • To provide an information about the relationship between demand for different products in order to obtain a balanced production in terms of quantity required of different products as a function of time. • To provide a future trend which is very much essential for product design and development.
  • 6. Prof. Shital Patel Production Planning & Control • Backbone of PPC • What (Product type), How( Process), How much(Quantity) and of What quality, will be manufactured • Strategic decision of investment in men(Skills), machines(Capacity & Precision) and materials(type) • Plant Layout ( Sequence of Machine arrangements) • Budgets and control • Inventory control • Leading to Aggregate Planning, Capacity planning, Process Planning, Scheduling & Sequencing… • Lays foundation for Long rang and Short range planning - long term: location, capacity, technology etc. questions - short term: production planning, material management, hiring and scheduling employees, allocating transportation etc.
  • 7. Prof. Shital Patel Production Planning & Control Step 1 Determine purpose of forecast Step 2 Establish a time horizon Step 3 Select a forecasting technique Step 4 Gather and analyze data Step 5 Prepare the forecast Step 6 Monitor the forecast “The forecast”
  • 8. Prof. Shital Patel Production Planning & Control Principles- Many types of forecasting models that differ in complexity and amount of data & way they generate forecasts: 1. Forecasts are rarely perfect 2. Forecasts are more accurate for grouped data than for individual items 3. Forecast are more accurate for shorter than longer time periods Types of Forecasts  Economic forecasts -Predict a variety of economic indicators, like money supply, inflation rates, interest rates, etc.  Technological forecasts - Predict rates of technological progress and innovation.  Demand forecasts - Predict the future demand for a company’s products or services.
  • 9. Prof. Shital Patel Production Planning & Control Forecasting Qualitative Expert opinion Market research Delphi Sales Force Quantitative Time series Naïve Simple Moving Average Weighted Moving Average Exponential SmoothingLe ast square Trend Projection Seasonal Indexes Causal/ Regression/ Associative Simple Regression Multiple Regression
  • 10. Prof. Shital Patel Production Planning & Control
  • 11. Prof. Shital Patel Production Planning & Control  Used when little data exist  New products  New technology  Involves intuition, experience  e.g., forecasting sales on Internet
  • 12. Prof. Shital Patel Production Planning & Control • Consultants who specialise in the motor industry, in food retailing, in internet marketing and so on • Different types of economists such as motor industry economists, energy economists, and political economists, all of whom have opinions on future demand and expenditure patterns in the country and the global markets • Some businesses, affected by seasonal variations in sales, consult specialists on long term weather forecasts in an attempt to predict sales of weather- dependent products • Other experts to be consulted can include distributors, wholesalers, suppliers and trade organisations • Experts are useful for gaining specialised insights into likely future patterns and trends but should not be used on a ‘standalone basis’. • Panels of experts are more reliable than consulting individual
  • 13. Prof. Shital Patel Production Planning & Control • Surveys of consumers’ intentions- makes predictions by asking people directly what they intend to do in the future • Market research companies that are continually gathering vast quantities of information and make money by selling this research to businesses • The results of surveys allow businesses to predict sales patterns and plan for the future in terms of staffing and production levels • Test marketing - Consumers’ response to a product, before the full release of the product • Involve the release of a product in a limited geographical area, or to a small section of the target market • For example, many films are test marketed before they are put on general release (by being shown to invited audiences), and if the response of the test marketing process is negative then changes can be made to the films before being made available to be general market.
  • 14. Prof. Shital Patel Production Planning & Control • Developed by the RAND Corporation in the late 1950s • Based on researching the views of a panel of experts • Begins with the initial development of a questionnaire focusing on the problem or issue in question • A panel of experts is selected, and then the questionnaire is sent to each of them • Each participant answers the questionnaire independently and returns it • Responses to the questionnaire are summarised before a further questionnaire is developed • The members of the expert panel independently rate and prioritise ideas included in the second questionnaire • This enables the group of experts to arrive at a consensus forecast • Based on the principle that forecasts from a structured group of experts are more accurate than those from individuals or unstructured groups.
  • 15. Prof. Shital Patel Production Planning & Control Advantages – • Flexible enough to be used in a variety of situations and can be applied to a range of complex problems • Provides a structured way for a group of people to make decisions • Participants have time to think through their ideas leading to a better quality of response • Creates a record of the expert group’s responses and ideas which can be used when needed. Disadvantages- • Require a substantial period of time to complete as the process is time consuming to coordinate and manage • It assumes that experts are willing to come to a consensus and allow their opinions to be altered by the views of other experts • Monetary payments to the experts may lead to bias in the results of the study.
  • 16. Prof. Shital Patel Production Planning & Control • Sales teams within businesses interact closely with customers • Sales staff might notice any developing trends, and they have the experience to spot market changes and shifts in customer preferences and attitudes • This direct sales information can be collected by management requesting statistical predictions of future sales, and by encouraging the upward flow of information through their organisation.
  • 17. Prof. Shital Patel Production Planning & Control  Used when situation is ‘stable’ and historical data exist  Existing products  Current technology  Involves mathematical techniques  e.g., forecasting sales of LCD televisions
  • 18. Prof. Shital Patel Production Planning & Control  Naive approach  Moving averages  Exponential smoothing  Trend projection  Linear regression time-series models associative model
  • 19. Prof. Shital Patel Production Planning & Control  Set of evenly spaced numerical data  Obtained by observing response variable at regular time periods  Forecast based only on past values, no other variables important  Assumes that factors influencing past and present will continue influence in future
  • 20. Prof. Shital Patel Production Planning & Control Uh, give me a minute.... We sold 250 wheels last week.... Now, next week we should sell.... The forecast for any period equals the previous period’s actual value.
  • 21. Prof. Shital Patel Production Planning & Control • Simple to use • Virtually no cost • Quick and easy to prepare • Data analysis is nonexistent • Easily understandable • Cannot provide high accuracy • Can be a standard for accuracy
  • 22. Prof. Shital Patel Production Planning & Control • This method consists of computing an average of the most recent “n” data values in the time series. This average is then used as a forecast for the next period. • Moving average =  (most recent n data values) n • Moving average usually tends to eliminate the seasonal and random components.
  • 23. Prof. Shital Patel Production Planning & Control
  • 24. Prof. Shital Patel Production Planning & Control • Weighted moving average – More recent values in a series are given more weight in computing the forecast  Used when some trend might be present  Older data usually less important  Weights based on experience and intuition Weighted moving average = ∑ (weight for period n) x (demand in period n) ∑ weights
  • 25. Prof. Shital Patel Production Planning & Control Weights Applied Period 3 Last month 2 Two months ago 1 Three months ago 6 Sum of weights January 10 February 12 March 13 April 16 May 19 June 23 July 26 Actual 3-Month Weighted Month Shed Sales Moving Average [(3 x 16) + (2 x 13) + (12)]/6 = 141/3 [(3 x 19) + (2 x 16) + (13)]/6 = 17 [(3 x 23) + (2 x 19) + (16)]/6 = 201/2 10 12 13 [(3 x 13) + (2 x 12) + (10)]/6 = 121/6
  • 26. Prof. Shital Patel Production Planning & Control • It is a forecasting technique that uses a smoothed value of time series in one period to forecast the value of time series in the next period. The basic model is as follows: • Ft = α Dt-1 + (1- α)Ft-1 • Where: • Ft= the forecast of time series for period t • Dt-1 = the actual value of the time series in period t-1 • Ft-1 = the forecast of time series for period t-1 • α = the smoothing constant 0<α≤1
  • 27. Prof. Shital Patel Production Planning & Control One of the two wheeler manufacturing company experienced irregular but usually increasing demand for three products. The demand was found to be 420 bikes for June and 440 bikes for July. They use a forecasting method which takes average of past year to forecast future demand. Using the simple average method demand forecast for June is found as 320 bikes (Use a smoothing coefficient 0.7 to weight the recent demand most heavily) and find the demand forecast for August.
  • 28. Prof. Shital Patel Production Planning & Control Trend Seasonal Cyclical Random
  • 29. Prof. Shital Patel Production Planning & Control Average demand over 4 years Trend component Actual demand line Random variation Seasonal peaks Demand for product or service | | | | 1 2 3 4 Time (years)
  • 30. Prof. Shital Patel Production Planning & Control
  • 31. Prof. Shital Patel Production Planning & Control A time series technique that computes a forecast with trend by drawing a straight line through a set of data using this formula: Y = a + bX where Y = forecast for period X X = the number of time periods from X = 0 A = value of y at X = 0 (Y intercept) B = slope of the line
  • 32. Prof. Shital Patel Production Planning & Control • Identify dependent (y) and independent (x) variables • Solve for the slope of the line • Solve for the y intercept • Develop your equation for the trend line Y=a + bX X b Y a        2 2 X n X Y X n XY b
  • 33. Prof. Shital Patel Production Planning & Control • In least squares regression – The sum of squared residuals is minimised – The mean of residuals is zero – residuals are assumed to be randomly distributed around the mean according to the normal distribution
  • 34. Prof. Shital Patel Production Planning & Control At a small regional college enrollments have grown steadily over the past six years, as evidenced below. Use time series regression to forecast the student enrollments for the next three years. Students Students Year Enrolled (1000s) Year Enrolled (1000s) 1 2.5 4 3.2 2 2.8 5 3.3 3 2.9 6 3.4
  • 35. Prof. Shital Patel Production Planning & Control x y x2 xy 1 2.5 1 2.5 2 2.8 4 5.6 3 2.9 9 8.7 4 3.2 16 12.8 5 3.3 25 16.5 6 3.4 36 20.4 Sx=21 Sy=18.1 Sx2=91 Sxy=66.5
  • 36. Prof. Shital Patel Production Planning & Control Y = 2.387 + 0.180X
  • 37. Prof. Shital Patel Production Planning & Control Y7 = 2.387 + 0.180(7) = 3.65 or 3,650 students Y8 = 2.387 + 0.180(8) = 3.83 or 3,830 students Y9 = 2.387 + 0.180(9) = 4.01 or 4,010 students Note: Enrollment is expected to increase by 180 students per year.
  • 38. Prof. Shital Patel Production Planning & Control  Simple linear regression can also be used when the independent variable X represents a variable other than time.  In this case, linear regression is representative of a class of forecasting models called
  • 39. Prof. Shital Patel Production Planning & Control  Simple Linear Regression – Causal Model The manager of RPC wants to project the firm’s sales for the next 3 years. He knows that RPC’s long- range sales are tied very closely to national freight car loadings. On the next slide are 7 years of relevant historical data. Develop a simple linear regression model between RPC sales and national freight car loadings. Forecast RPC sales for the next 3 years, given that the rail industry estimates car loadings of 250, 270, and 300 Thousands.
  • 40. Prof. Shital Patel Production Planning & Control RPC Sales Car Loadings Year (Rs.Thousand) (Rs.Thousand) 1 9.5 120 2 11.0 135 3 12.0 130 4 12.5 150 5 14.0 170 6 16.0 190 7 18.0 220
  • 41. Prof. Shital Patel Production Planning & Control x y x2 xy 120 9.5 14,400 1,140 135 11.0 18,225 1,485 130 12.0 16,900 1,560 150 12.5 22,500 1,875 170 14.0 28,900 2,380 190 16.0 36,100 3,040 220 18.0 48,400 3,960 1,115 93.0 185,425 15,440
  • 42. Prof. Shital Patel Production Planning & Control Y = 0.528 + 0.0801X
  • 43. Prof. Shital Patel Production Planning & Control Y8 = 0.528 + 0.0801(250) = Rs. 20.55 thousand Y9 = 0.528 + 0.0801(270) = Rs. 22.16 thousand Y10 = 0.528 + 0.0801(300) = Rs. 24.56 thousand Note: RPC sales are expected to increase by Rs. 80,100 for each additional million national freight car loadings.
  • 44. Prof. Shital Patel Production Planning & Control • A simple regression model (one independent variable) fits a regression line in 2- dimensional space • A multiple regression model with two explanatory variables fits a regression plane in 3- dimensional space
  • 45. Prof. Shital Patel Production Planning & Control  Multiple regression analysis is used when there are two or more independent variables.  An example of a multiple regression equation is: Y = 50.0 + 0.05X1 + 0.10X2 – 0.03X3 where: Y = firm’s annual sales (Rs. thousands) X1 = industry sales (Rs. thousands) X2 = regional per capita income (Rs. thousands) X3 = regional per capita debt (Rs. thousands)
  • 46. Prof. Shital Patel Production Planning & Control
  • 47. Prof. Shital Patel Production Planning & Control
  • 48. Prof. Shital Patel Production Planning & Control
  • 49. Prof. Shital Patel Production Planning & Control Coefficient of Correlation x y x2 xy y2 120 9.5 14,400 1,140 90.25 135 11.0 18,225 1,485 121.00 130 12.0 16,900 1,560 144.00 150 12.5 22,500 1,875 156.25 170 14.0 28,900 2,380 196.00 190 16.0 36,100 3,040 256.00 220 18.0 48,400 3,960 324.00 1,115 93.0 185,425 15,440 1,287.50
  • 50. Prof. Shital Patel Production Planning & Control Coefficient of Correlation r = 0.9829 r2 = (0.9829)2 = 0.966 96.6% of the variation in RPC sales is explained by national freight car loadings.
  • 51. Prof. Shital Patel Production Planning & Control The past data regarding the sales of ABC for the last five years is given below. Using the least square method, fit a straight line. Estimate the sales for the year 2021 and 2022. Year 2016 2017 2018 2019 2020 Sales (‘00) 35 56 79 80 40
  • 52. Prof. Shital Patel Production Planning & Control Year Sales (y) Deviation(x) x2 xy 2016 35 -2 4 -70 2017 56 -1 1 -56 2018 79 0 0 0 2019 80 1 1 80 2020 40 2 4 80 N=5 ∑y=290 ∑x=0 ∑x2=10 ∑xy=34
  • 53. Prof. Shital Patel Production Planning & Control • In this case, as the number of periods is odd, we make ∑x=0, the deviations are calculated from the middle period • Now to fit straight lie y = a+bx, the a and b are calculated as • a= ∑y/n=290/5=58 • b=∑xy/∑x2 =34/10=3.4 • y= 58+3.4x • Deviation for 2021 is x=3 and for 2022 x=4 • Substituting values of x, we get • Year 2021=58+3.4 X 3= 68.2, forecast is 6820 units • Year 2022=58+3.4 X 4= 71.6, forecast is 7160 units
  • 54. Prof. Shital Patel Production Planning & Control • Least square method when the sum of deviation is not zero (∑x ≠ 0) • For y= a + bx,
  • 55. Prof. Shital Patel Production Planning & Control A company manufacturing washing machine establishes a fact that there is a relationship between sale of washing machine and population of the city. The market research carried out reveals the following information. Fit linear equation and estimate demand for 45 million population. Population ( million) 5 7 15 22 27 36 Washing machine demand (‘000) 28 40 65 80 96 130
  • 56. Prof. Shital Patel Production Planning & Control Population (x) Demand (y) x2 xy 5 28 25 140 7 40 49 280 15 65 225 975 22 80 484 1760 27 96 729 2592 36 130 1296 4680 ∑x=112 ∑y=439 ∑x2=2808 ∑xy=10427
  • 57. Prof. Shital Patel Production Planning & Control = 15.07 = 3.11 Regression equation y=15.07 +3.11x For 45 million, forecast demand y=155.02=155020
  • 58. Prof. Shital Patel Production Planning & Control  Error - difference between actual value and predicted value  Mean Absolute Deviation (MAD) – Average absolute error  Mean Squared Error (MSE) – Average of squared error  Mean Absolute Percent Error (MAPE) – Average absolute percent error
  • 59. Prof. Shital Patel Production Planning & Control MAD = Actual forecast   n MSE = Actual forecast) -1 2   n ( MAPE = Actual forecast  n / Actual ) *100  (
  • 60. Prof. Shital Patel Production Planning & Control Period Actual Forecast (A-F) |A-F| (A-F)^2 (|A-F|/Actual)*100 1 217 215 2 2 4 0.92 2 213 216 -3 3 9 1.41 3 216 215 1 1 1 0.46 4 210 214 -4 4 16 1.90 5 213 211 2 2 4 0.94 6 219 214 5 5 25 2.28 7 216 217 -1 1 1 0.46 8 212 216 -4 4 16 1.89 -2 22 76 10.26 MAD= 2.75 MSE= 10.86 MAPE= 1.28
  • 61. Prof. Shital Patel Production Planning & Control
  • 62. Prof. Shital Patel Production Planning & Control • Aggregate Planning is an intermediate planning method used to determine the necessary resource capacity a firm will need in order to meet its expected demand with minimization of costs • Medium range capacity planning that typically covers a 3 to 18 month period of time • Used in a manufacturing environment and determines overall output levels planned as well as appropriate resource input mix to be used for related groups of products • The term "aggregate" is used because planning at this level includes all resources "in the aggregate;" for example, as a product line or family • Aggregate resources could be total number of workers, hours of machine time, or tons of raw materials
  • 63. Prof. Shital Patel Production Planning & Control • It does not distinguish among sizes, colors, features, and so forth. For example, with automobile manufacturing, aggregate planning would consider the total number of cars planned for not the individual models, colors, or options • It serve as a foundation for future short-range type planning, such as production scheduling, sequencing, and loading. • Steps taken to produce an aggregate plan begin with the determination of demand and the determination of current capacity • Capacity is expressed as total number of units per time period that can be produced • Demand is expressed as total number of units needed • If the two are not in balance (equal), the firm must decide whether to increase or decrease capacity to meet demand or increase or decrease demand to meet capacity
  • 64. Prof. Shital Patel Production Planning & Control Aggregate Plan for Production Demand Forecasts, orders Master Production Schedule, and MRP systems Detailed Work Schedules External Capacity Subcontractors Inventory On Hand Raw Materials Available Work Force Marketplace and Demand Research and Technology Product Decisions Process Planning & Capacity Decisions
  • 65. Prof. Shital Patel Production Planning & Control The main objectives : • Maximize customer service. • Minimize inventory investment. • Minimize changes in workforce levels. • Minimize changes in production rates. • Maximize utilization of plant and equipment.
  • 66. Prof. Shital Patel Production Planning & Control • Plays an important part in achieving long-term objectives of the organization • Achieving financial goals by reducing overall variable cost and improving the bottom line • Maximum utilization of the available production facility • Provide customer delight by matching demand and reducing wait time for customers • Reduce investment in inventory stocking • Able to meet scheduling goals there by creating a happy and satisfied work force
  • 67. Prof. Shital Patel Production Planning & Control • To minimize total production costs (labor, overtime, hiring/lay off, inventory carrying cost) • Helps achieve balance between operation goal, financial goal and overall strategic objective of the organization • It serves as a platform to manage capacity and demand planning. • In a scenario where demand is not matching the capacity, an organization can try to balance both by pricing, promotion, order management and new demand creation. • In scenario where capacity is not matching demand, an organization can try to balance the both by 1. Laying off/hiring excess/inadequate excess/inadequate excess/inadequate workforce until demand decrease/increase. 2. Including overtime as part of scheduling there by creating additional capacity. 3. Hiring a temporary workforce for a fix period or outsourcing activity to a sub- contractor.
  • 68. Prof. Shital Patel Production Planning & Control There are two pure planning strategies available to the aggregate planner: • LEVEL STRATEGY • CHASE STRATEGY Level Strategy Chase Strategy Production equals demand Production rate is constant
  • 69. Prof. Shital Patel Production Planning & Control • Steady production rate even though customer demand is low • A first alternative would be to maintains a level workforce and a steady rate of • Higher inventory levels than are currently needed • As demand increases, the firm is able to continue a steady production rate/steady employment level, while allowing the inventory surplus to absorb the increased demand A second alternative would be to use a backlog or backorder. • A backorder is simply a promise to deliver the product at a later date when it is more readily available • The backorder is a device for moving demand from one period to another, preferably one in which demand is lower, thereby smoothing demand requirements over time.  A level strategy allows a firm to maintain a constant level of output and still meet demand maintaining employee relations  Negative results - include the cost of excess inventory, subcontracting or overtime costs, and backorder costs, which typically are the cost of expediting orders and the loss of customer goodwill.
  • 70. Prof. Shital Patel Production Planning & Control • Demand Options — change demand: – influencing demand – backordering during high demand periods – Counter seasonal product mixing
  • 71. Prof. Shital Patel Production Planning & Control • Matching demand and capacity period by period • Results in – A considerable amount of hiring, firing or laying off of employees-insecure and unhappy employees, problems with labour unions – Increased inventory carrying costs – Erratic utilization of plant and equipment The major advantage • Flexibility of plant & worker utilization • Allows inventory to be held to the lowest level possible • Considerable savings Most firms embracing the just-in-time production concept utilize a chase strategy approach to aggregate planning. • Most firms find it advantageous to utilize a combination of the level and chase strategy. A combination strategy (sometimes called a hybrid or mixed strategy) can be found to better meet organizational goals and policies and achieve lower costs than either of the pure strategies used independently.
  • 72. Prof. Shital Patel Production Planning & Control Capacity Options — change capacity: – changing inventory levels – varying work force size by hiring or layoffs – varying production capacity through overtime or idle time – subcontracting – using part-time workers
  • 73. Prof. Shital Patel Production Planning & Control Option Advantage Disadvantage Some Comments Changing Inventory level Changes in human resources are gradual, not abrupt production changes Inventory holding costs; Shortages may results in lost sales Applies mainly to production, not service, operations Varying workforce size by hiring or layoffs Avoids use of other alternatives Hiring, layoff and training costs Used where size of labour pool is large
  • 74. Prof. Shital Patel Production Planning & Control Option Advantage Disadvantage Some Comments Varying production rates through overtime or idle time Matches seasonal Fluctuations hiring/training costs Overtime premiums, tired workers, may not meet demand Allows flexibility within the aggregate plan Subcontracting Permits flexibility and smoothing of the firm's output Loss of quality control; reduced profits; loss of future business Applies mainly in production settings
  • 75. Prof. Shital Patel Production Planning & Control Option Advantage Disadvantage Some Comments Using part-time workers Less costly and more flexible than full-time workers High turnover/ training costs; quality suffers; scheduling difficult Good for unskilled jobs in areas with large temporary labor pools Influencing demand Tries to use excess capacity Discounts draw new customers Uncertainty in demand. Hard to match demand to supply exactly Creates marketing ideas. Overbooking used in some businesses
  • 76. Prof. Shital Patel Production Planning & Control Option Advantage Disadvantage Some Comments Back ordering High demand period May avoid overtime. Keeps Capacity constant Customer must be willing to wait, but goodwill is lost Many companies backorder Counter seasonal And service mixing Fully utilizes Resources ; allows stable workforce May require skills or equipment outside a firm’s area of expertise Risky finding Products or services with opposite demand pattern
  • 77. Prof. Shital Patel Production Planning & Control A company manufactures the consumer durable products and the company intends to develop an aggregate plan for six months starting from January through June. The following information is available. Demand for working days. Month Jan Feb March April may June Demand 500 600 650 800 900 800 Working days 22 19 21 21 22 20 Cost Details- 6. Labour hours required- Rs.4/unit 1. Material- Rs.100/unit 7. Lay off Costs- Rs.100/worker 2. Inventory carrying cost- Rs.10/unit/month 8. Regular time Costs ( For first 8hrs)- Rs.12.50/hour 3. Cost of stock outs- Rs.20/unit/month 9. Over time cost- Rs.18.75/hour 4. Cost of sub contracting- Rs.200/unit 10. Beginning inventory- 200 units 5. Hiring and Training cost- Rs.50/worker 11. Safety stock required- Nill
  • 78. Prof. Shital Patel Production Planning & Control Work out the cost of the following strategies- 1. Produce exactly to meet demand- vary the work force 2. Constant work force- vary inventory and allow shortages 3. Constant work force and use sub contracting Solution:- Strategy-1 Produce exactly to meet demand- vary the work force Assumption- Opening work force equals the first month’s requirements Aggregate Production Planning requirements Jan Feb March April May June Total Beginning Inventory 200 0 0 0 0 0 Forecasted Demand 500 600 650 800 900 800 Production requirement (demand + safety stock- beginning inventory) 300 600 650 800 900 800 Ending Inventory (beginning inventory + production requirement – demand forecast) 0 0 0 0 0 0
  • 79. Prof. Shital Patel Production Planning & Control Strategy – Exact Production, Vary work force Jan Feb March April May June Total Production requirement 300 460 650 800 900 800 Production Hrs. reqd. (Prod. Req x 4hrs/unit) 1200 2400 2600 3200 3600 3200 Working days per month 22 19 21 21 22 20 Hours/month/worker ( working days x 8 hrs/day) 176 152 168 168 176 160 No. of workers reqd.(Prod. Hrs reqd.÷ hrs/month/wrkr) 7 16 15 19 20 20 Net wrkr hired (assume opening wrkr =1st month of 7) 0 9 0 4 1 0 Hiring cost (wrkrs hired x Rs. 50) 0 450 0 200 50 0 700 Workers laid off 0 0 1 0 0 0 Lay off cost ( wrkrs laid off x Rs. 100) 0 0 100 0 0 0 100 Regular production cost( prod. Hrs.reqd. x 12.50 Rs./hr) 15000 30000 32500 40000 45000 40000 202500 Total 203300
  • 80. Prof. Shital Patel Production Planning & Control Strategy II – Constant work force, Vary Inventory and stock out Jan Feb March April May June Total Beginning inventory 200 140 -80 -310 -690 -1150 Working days per month 22 19 21 21 22 20 Produ.Hrs.availabl(working days/mthx8hrs/day x10wrkr) 1760 1520 1680 1680 1760 1600 Actual production(Prod. Hrs. available÷4hrs/unit) 440 380 420 420 440 400 Forecast demand 500 600 650 800 900 800 Ending inventory ( beginning inventory + actual) 140 -80 -310 -690 -1150 -1550 Shortage cost( Unit short x Rs. 20/unit) 0 1600 6200 13800 23000 31000 75600 Units Excess ( ending inventory – safety stock) 140 0 0 0 0 0 Inventory cost ( Unit excess x 10 ) 1400 0 0 0 0 0 0 Regular production cost ( prod.hrs.Reqd. x 12.50 Rs./hrs) 22000 19000 21000 21000 22000 20000 125000 Total 202000
  • 81. Prof. Shital Patel Production Planning & Control Strategy – Exact Production, Vary work force Jan Feb March April May June Total Production requirement 300 460 650 800 900 800 Working days per month 22 19 21 21 22 20 Prod. hrs. availabl(working days x 8 hrs/day x 10 wrkrs) 1760 1520 1680 1680 1760 1600 Actual production(Prod. Hrs. available÷4hrs/unit) 440 380 420 420 440 400 Unit subcontracted ( prod. Requirement- actual prod.) 0 220 230 380 460 400 Subcontracting cost( Unit subcontracted x Rs. 100) 0 8000 23000 38000 46000 4000 155000 Regular production cost( prod. Hrs.reqd. x 12.50 Rs./hr) 22000 19000 21000 21000 22000 20000 125000 Total 280000
  • 82. Prof. Shital Patel Production Planning & Control Strategy – Exact Production, Vary work force PLAN Hiring Lay off Subcontract RT production Shortage Excess Inventory Total Cost PLAN-I Exact Production, Vary Work Force 700 100 - 202500 - - 2033000 PLAN-II Constant Work Force, Vary Inventory and Shortages - - - 125000 75600 1400 202000 PLAN – III Constant Work Force Subcontract - - 155000 125000 - - 280000 Assume a constant work force of 10 600-140 = 460 units of beginning inventory in February.
  • 83. Prof. Shital Patel Production Planning & Control
  • 84. Prof. Shital Patel Production Planning & Control • It is easy and simple to measure the capacity of the unit manufacturing homogenous tangible products which can be counted and can be expressed as number of units of output per period. • For example, the capacity of a automobile unit can be expressed as number of vehicles produced per month. • However it is difficult to express the capacities when the company manufactures multiple products and some of the products requiring common facilities and others specialized facilities. • In such cases the capacity is expressed as man hours, machine hours or sometimes in terms of applicable resources. • For example, a job shop can measure its capacity in machine hours and man hours.
  • 85. Prof. Shital Patel Production Planning & Control • Design capacity: Designed capacity of a facility is the planned or engineered rate of output of goods or services under normal or full scale operating conditions. For example, the designed capacity of the cement plant is 100 TPD (Tonnes per day). Capacity of the sugar factory is 150 tonnes of sugarcane crushing per day.
  • 86. Prof. Shital Patel Production Planning & Control • System capacity: System capacity is the maximum output of the specific product or product mix the system of workers and machines is capable of producing as an integrated whole • System capacity is less than design capacity or at the most equal, because of the limitation of product mix, quality specification, breakdowns and some long range uncontrollable factors • The actual is even less because of many factors affecting the output such as actual demand, downtime due to machine/equipment failure, unauthorized absenteeism, inefficiency of labor • The system efficiency is expressed as ratio of actual measured output to the system capacity. • System Efficiency (SE)=Actual output/System capacity
  • 87. Prof. Shital Patel Production Planning & Control
  • 88. Prof. Shital Patel Production Planning & Control • Licensed capacity: Capacity licensed by the various regulatory agencies or government authorities. This is the limitation on the output exercised by the government. • Installed capacity: The capacity provided at the time of installation of the plant is called installed capacity. • Rated capacity: Capacity based on the highest production rate established by actual trials is referred to as rated capacity.
  • 89. Prof. Shital Patel Production Planning & Control Effective capacity planning is dependent upon factors like 1. Forecast of Demand, 2. Production facility (layout, design, and location), 3. Product line or matrix, 4. Production technology, 5. Plant & Labour efficiency, 6. Human capital (job design, compensation), 7. Multiple shift operations, 8. Subcontracting, 9. Operational structure (scheduling, quality assurance) and 10. External structure ( Management policy, safety regulations)
  • 90. Prof. Shital Patel Production Planning & Control • Capacity planning is concerned with defining the long-term and the short-term capacity needs of an organization and determining how those needs will be satisfied • Capacity planning decisions are taken based upon the consumer demand and this is merged with the human, material and financial resources of the organization. • Capacity requirements can be evaluated from two perspectives long-term capacity strategies and short-term capacity strategies.
  • 91. Prof. Shital Patel Production Planning & Control • Long-term capacity requirements are more difficult to determine because the future demand and technology are uncertain • Forecasting for five or ten years into the future is more risky and difficult • Even sometimes company’s today’s products may not be existing in the future • Long range capacity requirements are dependent on marketing plans, product development and life- cycle of the product • Long-term capacity planning is concerned with accommodating major changes that affect overall level of the output in long-term • Marketing environmental assessment and implementing the long-term capacity plans in a systematic manner are the major responsibilities of management
  • 92. Prof. Shital Patel Production Planning & Control • Following parameters will affect long range capacity decisions – Multiple products – Phasing in capacity – Phasing out capacity Multiple products – Company’s produce more than one product using the same facilities in order to increase the profit. – The manufacturing of multiple products will reduce the risk of failure. – Having more than one product helps the capacity planners to do a better job. – Because products are in different stages of their life-cycles, it is easy to schedule them to get maximum capacity utilization.
  • 93. Prof. Shital Patel Production Planning & Control Phasing in capacity:  In high technology industries, and in industries where technology developments are very fast, the rate of obsolescence is high.  The products should be brought into the market quickly.  The time to construct the facilities will be long and there is no much time as the products should be introduced into the market quickly.  Here the solution is phase in capacity on modular basis.  Some commitment is made for building funds and men towards facilities over a period of 3–5 years.  This is an effective way of capitalizing on technological breakthrough.
  • 94. Prof. Shital Patel Production Planning & Control Phasing out capacity :  The outdated manufacturing facilities cause excessive plant closures and down time.  The impact of closures is not limited to only fixed costs of plant and machinery.  Thus, the phasing out here is done with humanistic way without affecting the community.  The phasing out options makes alternative arrangements for men like shifting them to other jobs or to other locations, compensating the employees, etc.
  • 95. Prof. Shital Patel Production Planning & Control • Managers often use forecasts of product demand to estimate the short-term workload the facility must handle. • Also looking ahead up to 12 months, anticipate output requirements for different products, and services. • Managers then compare requirements with existing capacity and then take decisions as to when the capacity adjustments are needed. • For short-term periods of up to one year, fundamental capacity is fixed and major facilities will not be changed. • Many short-term adjustments for increasing or decreasing capacity are possible and its requirement depend upon the conversion process like whether it is capital intensive or labor intensive or whether product can be stored as inventory. • Capital intensive processes depend on physical facilities, plant and equipment. • Short-term capacity can be modified by operating these facilities more or less intensively than normal. • In labor intensive processes short-term capacity can be changed by laying off or hiring people or by giving overtime to workers. • The strategies for changing capacity also depend upon how long the product can be stored as inventory.
  • 96. Prof. Shital Patel Production Planning & Control • The short-term capacity strategies are: – Inventories: Stock of finished goods during slack periods to meet the demand during peak period. – Backlog: During peak periods, the willing customers are requested to wait and their orders are fulfilled after a peak demand period. – Employment level (hiring or firing): Hire additional employees during peak demand period and layoff employees as demand decreases. – Employee training: Develop multi-skilled employees through training so that they can be rotated among different jobs. The multi-skilling helps as an alternative to hiring employees. – Subcontracting: During peak periods, hire the capacity of other firms temporarily to make the component parts or products. – Process design: Change job contents by redesigning the job.
  • 97. Prof. Shital Patel Production Planning & Control • The main goal in rough-cut capacity planning is to identify where overloading or under-loading of production capacity occurs and revise the MPS as required. • Overloading means that too much production of products has been planned in the facility and insufficient capacity exists to produce planned quantities of products required in MPS. • Under-loading means that not enough production of products has been planned to fully load the facility.
  • 98. Prof. Shital Patel Production Planning & Control
  • 99. Prof. Shital Patel Production Planning & Control • Rough cut capacity planning (RCCP) is the process of verifying if organization have sufficient capacity available to meet the requirements of master production schedule across a specific period. • RCCP is a long-term technique that marketing and production departments will use to stabilize the capacity available and what is required, so organization can make changes to production schedule or available capacity. • Traditionally, many manufacturers would adopt Master Resource Planning (MRP-II) software to pull off their rough cut capacity planning, as it’s a Production Management Software that gives the tools for: • — Production planning and scheduling; • — Raw material and finished goods inventory management; and • — Calculating manufacturing costs.
  • 100. Prof. Shital Patel Production Planning & Control • When organization working out rough cut capacity planning, it can be done at two levels: • Routing-Based RCCP • Routing-based rough cut capacity planning shows resource availability. For this, organization is going to look into the required and available capacity in hours per week per resource. • Rate-Based RCCP • This is where organization measure rough cut capacity by production lines. For this, organization will need to figure out required and available capacity per week per production line. • So, to quickly summarize, rough cut capacity planning will look into how much need to produce, how much are organization able to produce, and how can find a balance between the two.
  • 101. Prof. Shital Patel Production Planning & Control Benefits- It’s worth reiterating that rough cut capacity planning allows to understand how much supply are going to need to meet demand, but also give a schedule that is flexible (as things happen on the shop floor which disrupts production). But, other benefits of rough cut capacity planning includes: • Improved Project Management • Understanding all operations and outstanding job operations means , organization can improve project management. • For example, one can see which operations should start by a specific date, and which jobs can start later because they have a short turnaround. • Essentially, organization team will be able to easily prioritize operations by their start date.
  • 102. Prof. Shital Patel Production Planning & Control • Better Resource Management • Rough cut capacity planning allows to understand the total number of hours of work for each week by each manufacturing process. • For example, knowing how much work is passing through a workstation can help to determine if too much or not enough workloads are being processed, which will allow to adjust the capacity by: • — Changing the number of shifts; • — Changing the number of workstations in operation; or • — Passing operations onto a contract manufacturer.
  • 103. Prof. Shital Patel Production Planning & Control • Improved Manufacturing Lead Time • The transparency offered by rough cut capacity planning allows manufacturers to easily identify areas along their production lines that are being overworked or are prone to other issues such as a bottleneck in production. • With this overview, it’s easy to see an area of concern and make important business decisions immediately to address the problem, which is going to: • — Reduce your manufacturing lead time; • — Reduce costs; and • — Improve customer satisfaction by finishing projects on-time. • The benefits of rough cut capacity planning are numerous. But, to pull off RCCP, organization needs to develop proper planning and forecasting
  • 104. Prof. Shital Patel Production Planning & Control The following data gives the sales of the company for the various years. Fit the straight line and forecast the sales for the year 2018 and 2019. [Tabulate the calculations] ( Dec.17) Year 2009 2010 2011 2012 2013 2014 2015 2016 2017 Sales (‘000) 13 20 20 28 30 32 33 38 43
  • 105. Prof. Shital Patel Production Planning & Control Year Sales (y) Deviation (x) x2 xy 1 13 -4 16 -52 2 20 -3 9 -60 3 20 -2 4 -40 4 28 -1 1 -28 5 30 0 0 0 6 32 1 1 32 7 33 2 4 66 8 38 3 9 114 9 43 4 16 172 ∑y=257 ∑x = 0 ∑x2 = 60 ∑xy = 204
  • 106. Prof. Shital Patel Production Planning & Control • a= 28.56 • b=3.4 • Y= 28.56 + 3.4x • Forecast for 2018, y18= 45560 • Forecast for 2019, y19= 49000