Download as PDF, PPTX

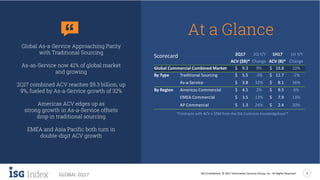
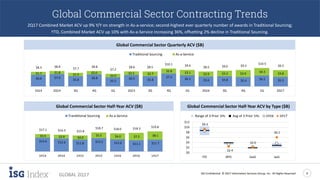
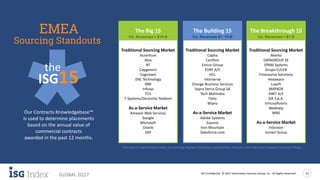


The ISG Index report for Q2 2017 reveals that the global commercial market saw a combined ACV of $9.3 billion, marking a 9% increase year-over-year, driven largely by a 32% growth in as-a-service contracts. Traditional sourcing, however, faced a decline of 3% during the same period. The report highlights significant growth within the Americas and Asia Pacific regions, while the EMEA shows a 13% increase overall, indicating varied trends across different sectors.


