Download to read offline


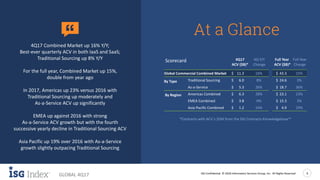
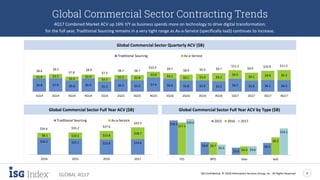
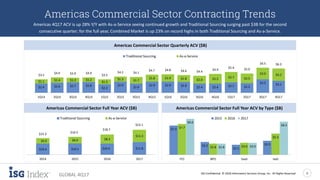
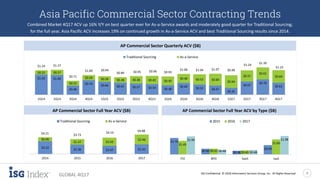
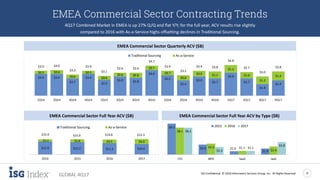
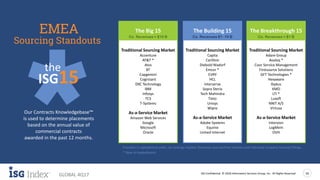
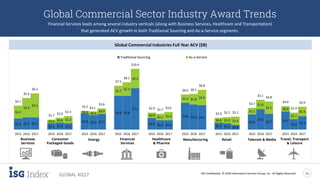


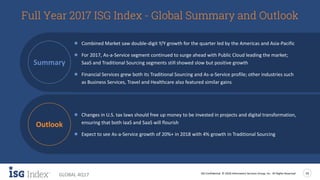


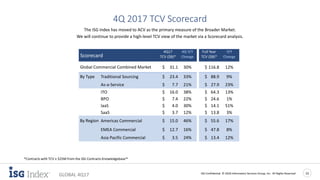

The document provides an overview of the global commercial market trends in the combined traditional sourcing and as-a-service industries for Q4 2017, highlighting a 16% year-over-year increase in market value, driven largely by significant growth in as-a-service offerings. It details specific trends by region, noting strong performance in the Americas while EMEA experienced a decline in traditional sourcing amid as-a-service growth. Overall, the analysis indicates a robust market transformation as businesses prioritize digital transformation spending.


