Download to read offline
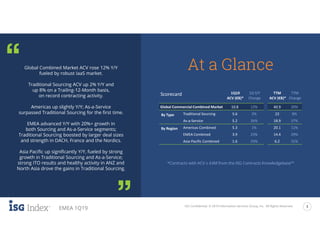
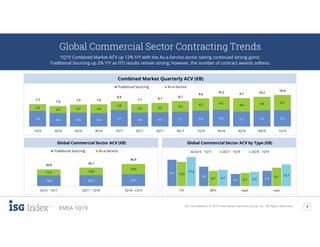
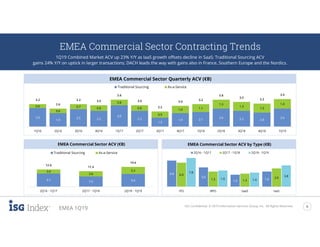
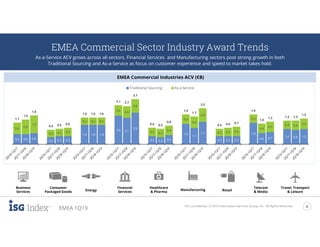
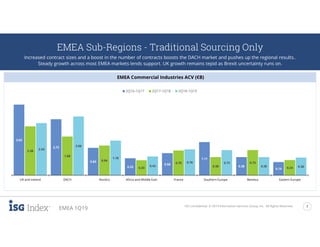
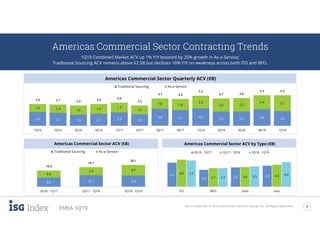
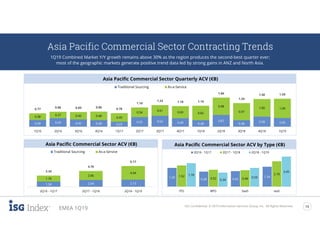
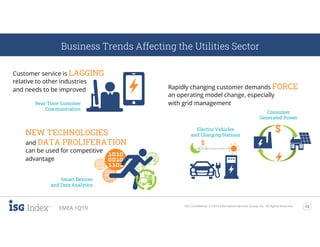
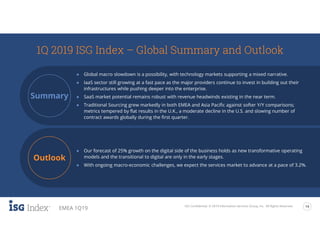

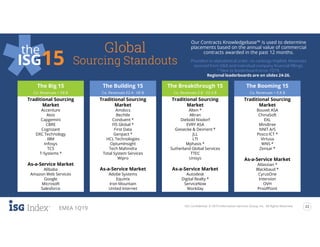

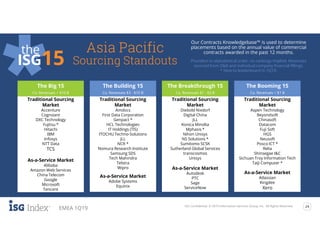
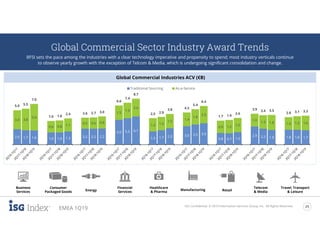

The document discusses the state of the global sourcing and as-a-service industry for the first quarter of 2019, highlighting a 12% year-over-year increase in combined market ACV, driven by strong growth in the IaaS market. The EMEA region experienced significant advancements with over 20% growth in both sourcing and as-a-service segments, while the Asia Pacific region also saw marked increases in traditional sourcing and as-a-service sectors. The report further analyzes various regional performances and trends, emphasizing the impact of larger contract sizes and changing customer demands across sectors.


