Download to read offline


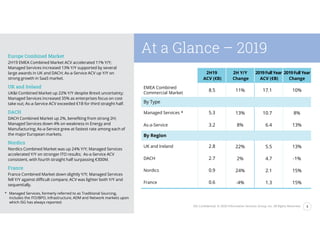
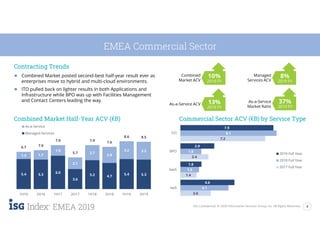
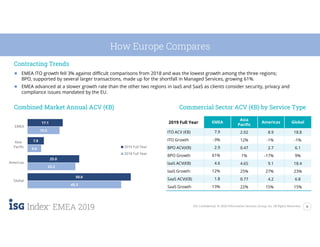
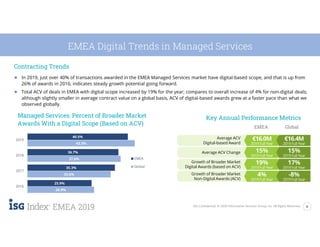
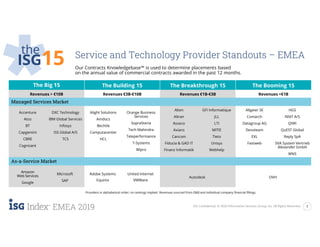
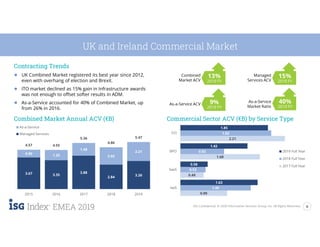
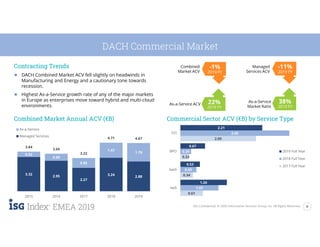
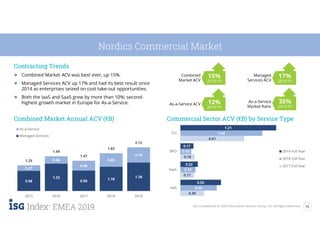
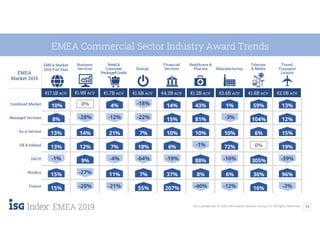
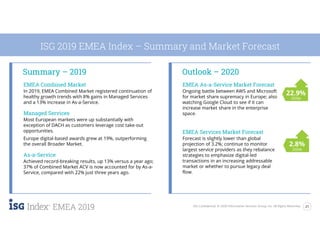


This document provides a summary of the managed services and as-a-service market insights for Europe in 2019. Some key points: - The combined EMEA market grew 10% in 2019 to €17.1B, with managed services up 8% and as-a-service up 13%. - The UK market grew the most at 13% to €5.5B. Germany declined slightly but as-a-service grew the fastest there. Scandinavia grew 15% to €2.1B. - Digital transformation projects made up over 40% of managed services deals in EMEA, up from 26% in 2016, indicating continued growth potential. - Large providers like Acc


