Download as PDF, PPTX


![page A L P S V E N T U R E P A R T N E R S 9
Industry Outlook (1/2)
[1] Source: Advertising Agencies in US published by IBISWorld, Feb 2019
info@alpsvp.com
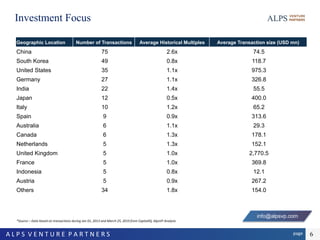
US Auto Parts Manufacturing Industry1
The Auto Parts Manufacturing industry has grown over the five years to 2019 as automakers, the industry’s largest
customers, have benefited from rising sales. Industry operators manufacture various items, including exhaust systems,
airbags and HVAC systems. Higher consumer confidence and increased disposable income have led to increased car
sales. Furthermore, stronger demand for new cars triggered increased production from vehicle manufacturers, which
supported revenue growth for auto parts manufacturing plants. However, recent declines in vehicle production have
limited overall industry revenue throughout the period. As a result, industry revenue is expected to increase at an
annualized rate of 0.4% to $73.3 billion over the five years to 2019, despite a 2.6% decline in 2019 alone.
22.2%
21.5%
18.1%
15.7%
8.5%
7.8%
6.2%
Airbag systems Exhaust systems HVAC systems
Other auto parts Filters and fuel tanks New wheels
Auto body parts
Low interest rates and unemployment levels resulted in
strengthened consumer confidence during the period.
Equipped with more disposable income and improved
confidence in the economy, consumers ramped up
spending during the current period. New car sales surged
as individuals acted on low interest rates. Consequently,
automakers increased orders of industry products to meet
the correspondingly heightened production demand.
However, during the latter half of the period, declines in
exports and automobile production have limited overall
revenue growth. Moreover, while operators have
expanded per establishment capacity and efficiency, they
have struggled to limit the effects of volatile input prices.
As a result, profit margins have suffered over the past five
years.](https://image.slidesharecdn.com/autopartsmatearsheet-190421224059/85/Auto-Parts-2019-M-A-Summary-9-320.jpg)
![page A L P S V E N T U R E P A R T N E R S 10
Industry Outlook (2/2)
info@alpsvp.com
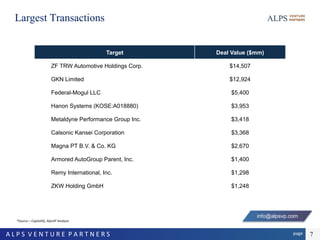
US Auto Parts Manufacturing Industry1
The recent decline in auto demand is expected to persist over the five years to 2024. In addition, new car sales are
expected to stagnate during the outlook period. This stagnation will be driven by rising interest rates and waning
consumer confidence; financing big- ticket purchases will be more expensive for consumers and, as a result, the growth
of new car sales and vehicle production will be tempered. However, these negative trends will be mitigated by several
developments. Over the next five years, the value of the US dollar is expected to further decline, which is anticipated to
boost the value of exports and industry revenue. In addition, US companies expanded their domestic capacity over the
five years to 2019, which is anticipated to promote innovation and production during the outlook period. Over the five
years to 2024, industry revenue is projected to increase at an annualized rate of 0.7% to $75.8 billion.
74.0 73.2 72.9 75.3 73.3 73.3 73.8 74.2 74.7 75.8
3.1%
-1.1%
-0.4%
3.2%
-2.6%
0.1%
0.7% 0.5% 0.6%
1.6%
-3.0%
-2.0%
-1.0%
0.0%
1.0%
2.0%
3.0%
4.0%
71
72
72
73
73
74
74
75
75
76
76
77
2015 2016 2017 2018 2019 2020 2021 2022 2023 2024
AutoPartsinUSRevenue($B)
Market Size ($B) Growth (%age)
[1] Source: Advertising Agencies in US published by IBISWorld, Feb 2019](https://image.slidesharecdn.com/autopartsmatearsheet-190421224059/85/Auto-Parts-2019-M-A-Summary-10-320.jpg)


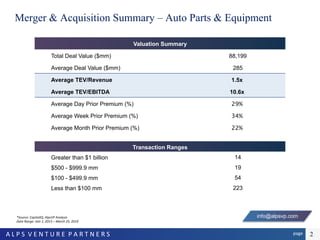
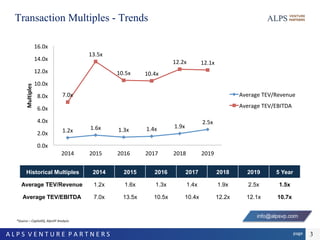
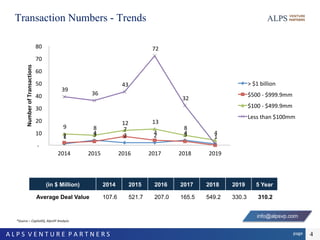
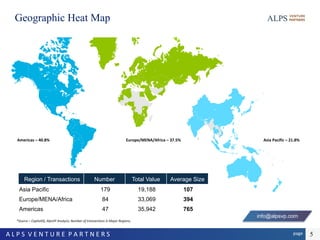
The document provides a comprehensive analysis of mergers and acquisitions in the auto parts and equipment sector from January 2013 to March 2019, highlighting key financial metrics such as total deal value of $88,199 million and transaction multiples. It offers insights into industry trends, geographic variations, and projections for the future growth of the auto parts manufacturing industry, with expected revenue growth of 0.7% to $75.8 billion by 2024 despite recent declines in vehicle production. Additionally, Alps Venture Partners outlines their corporate finance services and expertise in business valuation across various sectors.


![[HUBFORUM] MIRAKL - MARKETPLACE : ELLES CHANGENT LE MONDE](https://cdn.slidesharecdn.com/ss_thumbnails/miraklintrohubforumfinal-151008092838-lva1-app6892-thumbnail.jpg?width=640&height=640&fit=bounds)


![Marinus Van Gestel - eRetail Day México Online [Live] Experience](https://cdn.slidesharecdn.com/ss_thumbnails/marinusvangestel-210304163627-thumbnail.jpg?width=640&height=640&fit=bounds)


