SlideShare a Scribd company logo
547
▲ Figure 26.1 What kind of organism is this?
Investigating the Tree of Life
Look closely at the organism in Figure 26.1. Although it resembles a snake, this
animal is actually a legless lizard known as the eastern glass lizard (Ophisaurus
ventralis). Why isn’t this glass lizard considered a snake? More generally, how do
biologists distinguish and categorize the millions of species on Earth?
An understanding of evolutionary relationships suggests one way to address
these questions: We can decide in which category to place a species by comparing
its traits with those of potential close relatives. For example, the eastern glass lizard
does not have a highly mobile jaw, a large number of vertebrae, or a short tail lo-
cated behind the anus, three traits shared by all snakes. These and other character-
istics suggest that despite a superficial resemblance, the glass lizard is not a snake.
Snakes and lizards are part of the continuum of life extending from the earli-
est organisms to the great variety of species alive today. In this unit, we will survey
this diversity and describe hypotheses regarding how it evolved. As we do so, our
emphasis will shift from the process of evolution (the evolutionary mechanisms de-
scribed in Unit Four) to its pattern (observations of evolution’s products over time).
To set the stage for surveying life’s diversity, in this chapter we consider how
biologists trace phylogeny, the evolutionary history of a species or group of spe-
cies. A phylogeny of lizards and snakes, for example, indicates that both the east-
ern glass lizard and snakes evolved from lizards with legs—but they evolved from
K E Y C O N C E P T S
26.1 Phylogenies show evolutionary
relationships
26.2 Phylogenies are inferred from
morphological and molecular
data
26.3 Shared characters are used to
construct phylogenetic trees
26.4 An organism’s evolutionary
history is documented in its
genome
26.5 Molecular clocks help track
evolutionary time
26.6 Our understanding of the tree
of life continues to change
based on new data
26
Phylogeny and the Tree of Life
548 UNIT FIVE The Evolutionary History of Biological Diversity
different lineages of legged lizards (Figure 26.2). Thus, it
appears that their legless conditions evolved independently.
As we’ll see, biologists reconstruct and interpret phylogenies
like that in Figure 26.2 using systematics, a discipline focused
on classifying organisms and determining their evolutionary
relationships.
C O N C E P T 26.1
Phylogenies show evolutionary
relationships
Organisms share many characteristics because of common
ancestry (see Chapter 22). As a result, we can learn a great
deal about a species if we know its evolutionary history. For
example, an organism is likely to share many of its genes,
metabolic pathways, and structural proteins with its close
relatives. We’ll consider practical applications of such infor-
mation later in this section, but first we’ll examine how or-
ganisms are named and classified, the scientific discipline of
taxonomy. We’ll also look at how we can interpret and use
diagrams that represent evolutionary history.
Binomial Nomenclature
Common names for organisms—such as monkey, finch, and
lilac—convey meaning in casual usage, but they can also
cause confusion. Each of these names, for example, refers
to more than one species. Moreover, some common names
do not accurately reflect the kind of organism they signify.
Consider these three “fishes”: jellyfish (a cnidarian), crayfish
(a small lobsterlike crustacean), and silverfish (an insect).
And of course, a given organism has different names in dif-
ferent languages.
To avoid ambiguity when communicating about their
research, biologists refer to organisms by Latin scien-
tific names. The two-part format of the scientific name,
commonly called a binomial, was instituted in the 18th
century by Carolus Linnaeus (see Chapter 22). The first
part of a binomial is the name of the genus (plural, genera)
to which the species belongs. The second part, called the
specific epithet, is unique for each species within the genus.
An example of a binomial is Panthera pardus, the scientific
name for the large cat commonly called the leopard. Notice
that the first letter of the genus is capitalized and the entire
binomial is italicized. (Newly created scientific names are
also “latinized”: You can name an insect you discover after
a friend, but you must add a Latin ending.) Many of the
more than 11,000 binomials assigned by Linnaeus are still
used today, including the optimistic name he gave our own
species—Homo sapiens, meaning “wise man.”
Hierarchical Classification
In addition to naming species, Linnaeus also grouped them
into a hierarchy of increasingly inclusive categories. The first
grouping is built into the binomial: Species that appear to be
closely related are grouped into the same genus. For exam-
ple, the leopard (Panthera pardus) belongs to a genus that
also includes the African lion (Panthera leo), the tiger (Pan-
thera tigris), and the jaguar (Panthera onca). Beyond genera,
taxonomists employ progressively more comprehensive
categories of classification. The taxonomic system named
after Linnaeus, the Linnaean system, places related genera
in the same family, families into orders, orders into classes,
classes into phyla (singular, phylum), phyla into kingdoms,
and, more recently, kingdoms into domains (Figure 26.3).
The resulting biological classification of a particular organ-
ism is somewhat like a postal address identifying a person in
a particular apartment, in a building with many apartments,
on a street with many apartment buildings, in a city with
many streets, and so on.
The named taxonomic unit at any level of the hierarchy
is called a taxon (plural, taxa). In the leopard example, Pan-
thera is a taxon at the genus level, and Mammalia is a taxon
at the class level that includes all the many orders of mam-
mals. Note that in the Linnaean system, taxa broader than
the genus are not italicized, though they are capitalized.
Classifying species is a way to structure our human view
of the world. We lump together various species of trees to
which we give the common name of pines and distinguish
them from other trees that we call firs. Taxonomists have
decided that pines and firs are different enough to be placed
in separate genera, yet similar enough to be grouped into the
same family, Pinaceae. As with pines and firs, higher levels
of classification are usually defined by particular characters
chosen by taxonomists. However, characters that are useful
for classifying one group of organisms may not be appropri-
ate for other organisms. For this reason, the larger catego-
ries often are not comparable between lineages; that is, an
Geckos
Snakes
Iguanas
Monitor lizard
Eastern glass lizard
ANCESTRAL
LIZARD
(with limbs)
No limbs
No limbs
▲ Figure 26.2
Convergent evolution
of limbless bodies.
A phylogeny based on DNA
sequence data reveals that a
legless body form evolved independently from legged ancestors
in the lineages leading to the eastern glass lizard and to snakes.
C HAPTER 26 Phylogeny and the Tree of Life 549
order of snails does not exhibit the same degree of morpho-
logical or genetic diversity as an order of mammals. Fur-
thermore, as we’ll see, the placement of species into orders,
classes, and so on, does not necessarily reflect evolutionary
history.
Linking Classification and Phylogeny
The evolutionary history of a group of organisms can be
represented in a branching diagram called a phylogenetic
tree. As in Figure 26.4, the branching pattern often matches
how taxonomists have classified groups of organisms nested
within more inclusive groups. Sometimes, however, taxono-
mists have placed a species within a genus (or other group)
to which it is not most closely related. One reason for such
a mistake might be that over the course of evolution, a spe-
cies has lost a key feature shared by its close relatives. If
DNA or other new evidence indicates that an organism has
been misclassified, the organism may be reclassified to ac-
curately reflect its evolutionary history. Another issue is that
while the Linnaean system may distinguish groups, such as
amphibians, mammals, reptiles, and other classes of verte-
brates, it tells us nothing about these groups’ evolutionary
relationships to one another.
Such difficulties in aligning Linnaean classification with
phylogeny have led some systematists to propose that clas-
sification be based entirely on evolutionary relationships.
In such systems, names are only assigned to groups that
include a common ancestor and all of its descendants. As a
consequence of this approach, some commonly recognized
groups would become part of other groups previously at the
same level of the Linnaean system. For example, because
birds evolved from a group of reptiles, Aves (the Linnaean
class to which birds are assigned) would be considered a
subgroup of Reptilia (also a class in the Linnaean system).
Regardless of how groups are named, a phylogenetic
tree represents a hypothesis about evolutionary relation-
ships. These relationships often are depicted as a series of
dichotomies, or two-way branch points. Each branch point
Domain:
Eukarya
Domain:
Bacteria
Domain:
Archaea
Kingdom:
Animalia
Phylum:
Chordata
Class:
Mammalia
Order:
Carnivora
Family:
Felidae
Genus:
Panthera
Species:
Panthera pardus
▲ Figure 26.3 Linnaean classification. At each level, or “rank,”
species are placed in groups within more inclusive groups.
SpeciesGenusFamilyOrder
Panthera
pardus
(leopard)
Taxidea
taxus
(American
badger)
Lutra lutra
(European
otter)
Canis
latrans
(coyote)
Canis
lupus
(gray wolf)
1
2
Carnivora
FelidaeMustelidaeCanidae
PantheraTaxideaLutraCanis
▲ Figure 26.4 The connection between classification and
phylogeny. Hierarchical classification can reflect the branching pat-
terns of phylogenetic trees. This tree traces possible evolutionary
relationships between some of the taxa within order Carnivora, itself
a branch of class Mammalia. The branch point 1 represents the most
recent common ancestor of all members of the weasel (Mustelidae)
and dog (Canidae) families. The branch point 2 represents the most
recent common ancestor of coyotes and gray wolves.
? What does this phylogenetic tree indicate about the evolutionary re-
lationships between the leopard, badger, and wolf?
550 UNIT FIVE The Evolutionary History of Biological Diversity
represents the divergence of two evolutionary lineages from
a common ancestor. In Figure 26.5, for example, branch
point 3 represents the common ancestor of taxa A, B,
and C. The position of branch point 4 to the right of 3
indicates that taxa B and C diverged after their shared lin-
eage split from the lineage leading to taxon A. Note also that
tree branches can be rotated around a branch point without
changing their evolutionary relationships.
In Figure 26.5, taxa B and C are sister taxa, groups of or-
ganisms that share an immediate common ancestor (branch
point 4 ) and hence are each other’s closest relatives. In ad-
dition, this tree, like most of the phylogenetic trees in this
book, is rooted, which means that a branch point within the
tree (often drawn farthest to the left) represents the most
recent common ancestor of all taxa in the tree. The term
basal taxon refers to a lineage that diverges early in the his-
tory of a group and hence, like taxon G in Figure 26.5, lies
on a branch that originates near the common ancestor of
the group. Finally, the lineage leading to taxa D–F includes
a polytomy, a branch point from which more than two
descendant groups emerge. A polytomy signifies that evolu-
tionary relationships among the taxa are not yet clear.
What We Can and Cannot Learn from
Phylogenetic Trees
Let’s summarize three key points about phylogenetic trees.
First, they are intended to show patterns of descent, not
phenotypic similarity. Although closely related organisms
often resemble one another due to their common ances-
try, they may not if their lineages have evolved at different
rates or faced very different environmental conditions. For
example, even though crocodiles are more closely related to
birds than to lizards (see Figure 22.17), they look more like
lizards because morphology has changed dramatically in the
bird lineage.
Second, the sequence of branching in a tree does not nec-
essarily indicate the actual (absolute) ages of the particular
species. For example, the tree in Figure 26.4 does not indi-
cate that the wolf evolved more recently than the European
otter; rather, the tree shows only that the most recent com-
mon ancestor of the wolf and otter (branch point 1 ) lived
before the most recent common ancestor of the wolf and
coyote ( 2 ). To indicate when wolves and otters evolved,
the tree would need to include additional divergences in
each evolutionary lineage, as well as the dates when those
splits occurred. Generally, unless given specific informa-
tion about what the branch lengths in a phylogenetic tree
mean—for example, that they are proportional to time—we
should interpret the diagram solely in terms of patterns of
descent. No assumptions should be made about when par-
ticular species evolved or how much change occurred in
each lineage.
Third, we should not assume that a taxon on a phylo-
genetic tree evolved from the taxon next to it. Figure 26.4
does not indicate that wolves evolved from coyotes or vice
versa. We can infer only that the lineage leading to wolves
and the lineage leading to coyotes both evolved from the
common ancestor 2 . That ancestor, which is now extinct,
was neither a wolf nor a coyote. However, its descendants
include the two extant (living) species shown here, wolves
and coyotes.
Applying Phylogenies
Understanding phylogeny can have practical applications.
Consider maize (corn), which originated in the Americas
and is now an important food crop worldwide. From a
phylogeny of maize based on DNA data, researchers have
been able to identify two species of wild grasses that may
be maize’s closest living relatives. These two close relatives
may be useful as “reservoirs” of beneficial alleles that can be
transferred to cultivated maize by cross-breeding or genetic
engineering (see Chapter 20).
A different use of phylogenetic trees is to infer species
identities by analyzing the relatedness of DNA sequences
from different organisms. Researchers have used this ap-
proach to investigate whether “whale meat” had been
harvested illegally from whale species protected under inter-
national law rather than from species that can be harvested
legally (Figure 26.6).
How do researchers construct trees like those we’ve
considered here? In the next section, we’ll begin to answer
that question by examining the data used to determine
phylogenies.
Taxon A
ANCESTRAL
LINEAGE
Taxon B
Sister
taxa
Basal
taxon
Taxon C
Taxon D
Taxon E
Taxon F
Taxon G
This branch point forms a
polytomy: an unresolved
pattern of divergence.
Branch point:
where lineages diverge
This branch point
represents the common
ancestor of taxa A–G.
3
5
4
2
1
▲ Figure 26.5 How to read a phylogenetic tree.
D R AW I T Redraw this tree, rotating the branches around branch
points 2 and 4 . Does your new version tell a different story about the
evolutionary relationships between the taxa? Explain.
C HAPTER 26 Phylogeny and the Tree of Life 551
3. W H AT I F ? Suppose new evidence indicates that
taxon E in Figure 26.5 is the sister taxon of a group con-
sisting of taxa D and F. Redraw the tree accordingly.
For suggested answers, see Appendix A.
Minke
(Southern Hemisphere)
Minke
(North Atlantic)
Humpback
Blue
Fin
Unknown #9
Unknown #1b
Unknowns #10,
11, 12, 13
Unknowns #1a,
2, 3, 4, 5, 6, 7, 8
© 1994 AAAS
Inquiry
What is the species identity of food being sold
as whale meat?
▼ Figure 26.6
Experiment C. S. Baker and S. R. Palumbi purchased 13 samples
of “whale meat” from Japanese fish markets. They sequenced part
of the mitochondrial DNA (mtDNA) from each sample and compared
their results with the comparable mtDNA sequence from known
whale species. To infer the species identity of each sample, the team
constructed a gene tree, a phylogenetic tree that shows patterns of
relatedness among DNA sequences rather than among taxa.
Results Of the species in the resulting gene tree, only Minke whales
caught in the Southern
Hemisphere can
be sold legally
in Japan.
Conclusion This analysis indicated that mtDNA sequences of six of
the unknown samples (in red) were most closely related to mtDNA
sequences of whales that are not legal to harvest.
Source: C. S. Baker and S. R. Palumbi, Which whales are hunted? A molecular genetic
approach to monitoring whaling, Science 265:1538–1539 (1994). Reprinted with
permission from AAAS.
W H AT I F ? What different results would have indicated that the whale
meat had not been harvested illegally?
C O N C E P T C H E C K 2 6 . 1
1. Which levels of the classification in Figure 26.3 do hu-
mans share with leopards?
2. Which of the trees shown here depicts an evolutionary
history different from the other two? Explain.
A
(a)
B
C
D
B
(b)
D
C
A
D
(c)
C
B
A
C O N C E P T 26.2
Phylogenies are inferred from
morphological and molecular data
To infer phylogeny, systematists must gather as much infor-
mation as possible about the morphology, genes, and bio-
chemistry of the relevant organisms. It is important to focus
on features that result from common ancestry, because only
such features reflect evolutionary relationships.
Morphological and Molecular Homologies
Recall that phenotypic and genetic similarities due to shared
ancestry are called homologies. For example, the similarity
in the number and arrangement of bones in the forelimbs of
mammals is due to their descent from a common ancestor
with the same bone structure; this is an example of a mor-
phological homology (see Figure 22.15). In the same way,
genes or other DNA sequences are homologous if they are
descended from sequences carried by a common ancestor.
In general, organisms that share very similar morpholo-
gies or similar DNA sequences are likely to be more closely
related than organisms with vastly different structures or
sequences. In some cases, however, the morphological diver-
gence between related species can be great and their genetic
divergence small (or vice versa). Consider the Hawaiian silver-
sword plants: some of these species are tall, twiggy trees, while
others are dense, ground-hugging shrubs (see Figure 25.22).
But despite these striking phenotypic differences, the silver-
swords’ genes are very similar. Based on these small molecular
divergences, scientists estimate that the silversword group
began to diverge 5 million years ago. We’ll discuss how sci-
entists use molecular data to estimate such divergence times
later in this chapter.
Sorting Homology from Analogy
A potential source of confusion
in constructing a phylogeny is
similarity between organisms
that is due to convergent
evolution—called analogy—
rather than to shared ancestry
(homology). Convergent evo-
lution occurs when similar
environmental pressures and
natural selection produce simi-
lar (analogous) adaptations in
organisms from different evo-
lutionary lineages. For
example, the two mole-like
animals shown in Figure 26.7
Australian marsupial “mole”
North American eutherian mole
▲ Figure 26.7 Convergent
evolution in burrowers. A long
body, large front paws, small eyes,
and a pad of thick skin that pro-
tects the nose all evolved indepen-
dently in these species.
552 UNIT FIVE The Evolutionary History of Biological Diversity
look very similar. However, their internal anatomy, physiol-
ogy, and reproductive systems are very dissimilar. Indeed,
genetic and fossil evidence indicate that the common ances-
tor of these moles lived 140 million years ago. This common
ancestor and most of its descendents were not mole-like, but
analogous characteristics evolved independently in these two
mole lineages as they became adapted to similar lifestyles.
Distinguishing between homology and analogy is criti-
cal in reconstructing phylogenies. To see why, consider bats
and birds, both of which have adaptations that enable flight.
This superficial resemblance might imply that bats are more
closely related to birds than they are to cats, which cannot
fly. But a closer examination reveals that a bat’s wing is more
similar to the forelimbs of cats and other mammals than to
a bird’s wing. Bats and birds descended from a common tet-
rapod ancestor that lived about 320 million years ago. This
common ancestor could not fly. Thus, although the underly-
ing skeletal systems of bats and birds are homologous, their
wings are not. Flight is enabled in different ways—stretched
membranes in the bat wing versus feathers in the bird wing.
Fossil evidence also documents that bat wings and bird wings
arose independently from the forelimbs of different tetrapod
ancestors. Thus, with respect to flight, a bat’s wing is analo-
gous, not homologous, to a bird’s wing. Analogous structures
that arose independently are also called homoplasies (from
the Greek, meaning “to mold in the same way”).
Besides corroborative similarities and fossil evidence, an-
other clue to distinguishing between homology and analogy is
the complexity of the characters being compared. The more
elements that are similar in two complex structures, the more
likely it is that they evolved from a common ancestor. For in-
stance, the skulls of an adult human and an adult chimpanzee
both consist of many bones fused together. The compositions
of the skulls match almost perfectly, bone for bone. It is highly
improbable that such complex structures, matching in so
many details, have separate origins. More likely, the genes in-
volved in the development of both skulls were inherited from
a common ancestor. The same argument applies to compari-
sons at the gene level. Genes are sequences of thousands of
nucleotides, each of which represents an inherited character
in the form of one of the four DNA bases: A (adenine),
G (guanine), C (cytosine), or T (thymine). If genes in two or-
ganisms share many portions of their nucleotide sequences, it
is likely that the genes are homologous.
Evaluating Molecular Homologies
Comparing DNA molecules often poses technical chal-
lenges for researchers. The first step after sequencing the
molecules is to align comparable sequences from the spe-
cies being studied. If the species are very closely related, the
sequences probably differ at only one or a few sites. In con-
trast, comparable nucleic acid sequences in distantly related
species usually have different bases at many sites and may
have different lengths. This is because insertions and dele-
tions accumulate over long periods of time.
Suppose, for example, that certain noncoding DNA
sequences near a particular gene are very similar in two
species, except that the first base of the sequence has been
deleted in one of the species. The effect is that the remain-
ing sequence shifts back one notch. A comparison of the
two sequences that does not take this deletion into account
would overlook what in fact is a very good match. To ad-
dress such problems, researchers have developed computer
programs that estimate the best way to align comparable
DNA segments of differing lengths (Figure 26.8).
Such molecular comparisons reveal that many base substi-
tutions and other differences have accumulated in the com-
parable genes of an Australian mole and a North American
mole. The many differences indicate that their lineages have
diverged greatly since their common ancestor; thus, we say
that the living species are not closely related. In contrast, the
high degree of gene sequence similarity among the silver-
sword plants indicates that they are all very closely related, in
spite of their considerable morphological differences.
Just as with morphological characters, it is necessary to
distinguish homology from analogy in evaluating molecular
similarities for evolutionary studies. Two sequences that
C C A T C A G A G T C C
1
2
C
Deletion
Insertion
C A T C A G A G T C C
C C A T
G T A
C A G A G T C C
1
2
C C A T C A A G T C C
C C A T G T A C A G A G T C C
1
2
C C A T C A A G T C C
C C A T G T A C A G A G T C C
1
2
These homologous DNA
sequences are identical as
species 1 and species 2
begin to diverge from their
common ancestor.
1
Deletion and insertion
mutations shift what had
been matching sequences
in the two species.
2
Of the regions of the
species 2 sequence that
match the species 1
sequence, those shaded
orange no longer align
because of these mutations.
3
The matching regions
realign after a computer
program adds gaps in
sequence 1.
4
▲ Figure 26.8 Aligning segments of DNA. Systematists search
for similar sequences along DNA segments from two species (only
one DNA strand is shown for each species). In this example, 11 of the
original 12 bases have not changed since the species diverged. Hence,
those portions of the sequences still align once the length is adjusted.
C HAPTER 26 Phylogeny and the Tree of Life 553
C O N C E P T C H E C K 2 6 . 2
1. Decide whether each of the following pairs of structures
more likely represents analogy or homology, and explain
your reasoning: (a) a porcupine’s quills and a cactus’s
spines; (b) a cat’s paw and a human’s hand; (c) an owl’s
wing and a hornet’s wing.
2. W H AT I F ? Suppose that two species,A and B, have
similar appearances but very divergent gene sequences,
while species B and C have very different appearances
but similar gene sequences.Which pair of species is more
likely to be closely related: A and B or B and C? Explain.
For suggested answers, see Appendix A.
C O N C E P T 26.3
Shared characters are used to construct
phylogenetic trees
As we’ve discussed, a key step in reconstructing phylogenies
is to distinguish homologous features from analogous ones
(since only homology reflects evolutionary history). We
must also choose a method of inferring phylogeny from
these homologous characters. A widely used set of methods
is known as cladistics.
Cladistics
In the approach to systematics called cladistics, common
ancestry is the primary criterion used to classify organisms.
Using this methodology, biologists attempt to place species
into groups called clades, each of which includes an ances-
tral species and all of its descendants (Figure 26.10a).
Clades, like taxonomic categories of the Linnaean system,
are nested within larger clades. In Figure 26.4, for example,
the cat group (Felidae) represents a clade within a larger
clade (Carnivora) that also includes the dog group
(Canidae).
However, a taxon is equivalent to a clade only if it is
monophyletic (from the Greek, meaning “single tribe”),
signifying that it consists of an ancestral species and all of
its descendants (see Figure 26.10a). Contrast this with a
paraphyletic (“beside the tribe”) group, which consists of
an ancestral species and some, but not all, of its descendants
(Figure 26.10b), or a polyphyletic (“many tribes”) group,
which includes distantly related species but does not include
their most recent common ancestor (Figure 26.10c).
▼ Figure 26.10 Monophyletic, paraphyletic, and polyphyletic groups.
1 2
3
1
2
3
(a) Monophyletic group (clade) (b) Paraphyletic group (c) Polyphyletic group
Group I, consisting of three species (A, B, C)
and their common ancestor , is a monophyletic
group (clade), meaning that it consists of an
ancestral species and all of its descendants.
Group III, consisting of four species (A, B, C,
D), is polyphyletic, meaning that the common
ancestor of its members is not part of the
group.
A
C
Group I
D
E
F
G
B
A
C
Group II
D
E
F
G
B
A
C
D
E
F
G
B
Group III
Group II is paraphyletic, meaning that it
consists of an ancestral species and some
of its descendants (species D, E, F) but not all
of them (missing species G).
resemble each other at many points along their length most
likely are homologous (see Figure 26.8). But in organisms
that do not appear to be closely related, the bases that their
otherwise very different sequences happen to share may sim-
ply be coincidental matches, called molecular homoplasies.
For example, if the two DNA sequences in Figure 26.9 were
from distantly related organisms, the fact that they share 23%
of their bases would be coincidental. Statistical tools have
been developed to determine whether DNA sequences that
share more than 25% of their bases do so because they are
homologous.
A C G G A T A G T C C A C T A G G C A C T A
T C A C C G A C A G G T C T T T G A C T A G
▲ Figure 26.9 A molecular homoplasy.
554 UNIT FIVE The Evolutionary History of Biological Diversity
Note that in a paraphyletic group, the most recent com-
mon ancestor of all members of the group is part of the
group, whereas in a polyphyletic group the most recent
common ancestor is not part of the group. For example, a
group consisting of even-toed ungulates (hippopotamuses,
deer, and their relatives) and their common ancestor is
paraphyletic because it includes the common ancestor but
excludes cetaceans (whales, dolphins, and porpoises), which
descended from that ancestor (Figure 26.11). In contrast,
a group consisting of seals and cetaceans (based on their
similar body forms) would be polyphyletic because it does
not include the common ancestor of seals and cetaceans.
Biologists avoid defining such polyphyletic groups; if new
evidence indicates that an existing group is polyphyletic,
organisms in that group are reclassified.
Shared Ancestral and Shared Derived Characters
As a result of descent with modification, organisms have
characteristics they share with their ancestors, and they also
have characteristics that differ from those of their ancestors.
For example, all mammals have backbones, but a backbone
does not distinguish mammals from other vertebrates be-
cause all vertebrates have backbones. The backbone pre-
dates the branching of mammals from other vertebrates.
Thus for mammals, the backbone is a shared ancestral
character, a character that originated in an ancestor of the
taxon. In contrast, hair is a character shared by all mammals
but not found in their ancestors. Thus, in mammals, hair
is considered a shared derived character, an evolutionary
novelty unique to a clade.
Other even-toed
ungulates
Hippopotamuses
Cetaceans
Bears
Other
carnivores
Seals
Common
ancestor of
even-toed
ungulates
This group is paraphyletic because it does
not include all the descendants of the
common ancestor (it excludes cetaceans).
This group is polyphyletic because it
does not include the most recent
common ancestor of its members.
▲ Figure 26.11 Examples of a paraphyletic and a polyphyletic
group.
? Circle the branch point that represents the most recent common
ancestor of cetaceans and seals. Explain why that ancestor would not be
part of a cetacean–seal group defined by their similar body forms.
0Hair
TAXA
Amnion
CHARACTERS
Lancelet
(outgroup)
Lamprey
Bass
Frog
Turtle
Leopard
Four walking legs
Hinged jaws
0 0 0 0 1
0 0 0 0 1 1
0 0 0 1 1 1
0 0 1 1 1 1
Vertebral column
(backbone)
0 1 1 1 1 1
(a) (b)Character table. A 0 indicates that a character is absent; a 1
indicates that a character is present.
Lancelet
(outgroup)
Lamprey
Bass
Frog
Turtle
Leopard
Phylogenetic tree. Analyzing the distribution of these derived
characters can provide insight into vertebrate phylogeny.
Vertebral
column
Hinged jaws
Four walking legs
Amnion
Hair
▲ Figure 26.12 Constructing a phylogenetic tree. The characters used here include the
amnion, a membrane that encloses the embryo inside a fluid-filled sac (see Figure 34.25).
D R AW I T In (b), circle the most inclusive clade for which a hinged jaw is a shared ancestral character.
C HAPTER 26 Phylogeny and the Tree of Life 555
Note that it is a relative matter whether a character is
considered ancestral or derived. A backbone can also qualify
as a shared derived character, but only at a deeper branch
point that distinguishes all vertebrates from other animals.
Inferring Phylogenies Using Derived Characters
Shared derived characters are unique to particular clades.
Because all features of organisms arose at some point in the
history of life, it should be possible to determine the clade in
which each shared derived character first appeared and to
use that information to infer evolutionary relationships.
To see how this analysis is done, consider the set of char-
acters shown in Figure 26.12a for each of five vertebrates—
a leopard, turtle, frog, bass, and lamprey (a jawless aquatic
vertebrate). As a basis of comparison, we need to select
an outgroup. An outgroup is a species or group of species
from an evolutionary lineage that is known to have diverged
before the lineage that includes the species we are studying
(the ingroup). A suitable outgroup can be determined based
on evidence from morphology, paleontology, embryonic
development, and gene sequences. An appropriate outgroup
for our example is the lancelet, a small animal that lives in
mudflats and (like vertebrates) is a member of the more in-
clusive group called the chordates. Unlike the vertebrates,
however, the lancelet does not have a backbone.
By comparing members of the ingroup with each other and
with the outgroup, we can determine which characters were
derived at the various branch points of vertebrate evolution.
For example, all of the vertebrates in the ingroup have back-
bones: This character was present in the ancestral vertebrate,
but not in the outgroup. Now note that hinged jaws are a
character absent in lampreys but present in other members of
the ingroup; this character helps us to identify an early branch
point in the vertebrate clade. Proceeding in this way, we can
translate the data in our table of characters into a phylogenetic
tree that groups all the ingroup taxa into a hierarchy based on
their shared derived characters (Figure 26.12b).
Phylogenetic Trees with Proportional
Branch Lengths
In the phylogenetic trees we have presented so far, the
lengths of the tree’s branches do not indicate the degree of
evolutionary change in each lineage. Furthermore, the chro-
nology represented by the branching pattern of the tree is
relative (earlier versus later) rather than absolute (how many
millions of years ago). But in some tree diagrams, branch
lengths are proportional to amount of evolutionary change
or to the times at which particular events occurred.
In Figure 26.13, for example, the branch length of the
phylogenetic tree reflects the number of changes that have
taken place in a particular DNA sequence in that lineage.
Note that the total length of the horizontal lines from the
base of the tree to the mouse is less than that of the line lead-
ing to the outgroup species, the fruit fly Drosophila. This im-
plies that in the time since the mouse and fly diverged from
a common ancestor, more genetic changes have occurred in
the Drosophila lineage than in the mouse lineage.
Even though the branches of a phylogenetic tree may
have different lengths, among organisms alive today, all
the different lineages that descend from a common ances-
tor have survived for the same number of years. To take
an extreme example, humans and bacteria had a common
ancestor that lived over 3 billion years ago. Fossils and ge-
netic evidence indicate that this ancestor was a single-celled
prokaryote. Even though bacteria have apparently changed
Drosophila
Lancelet
Zebrafish
Frog
Chicken
Human
Mouse
▲ Figure 26.13 Branch lengths can represent
genetic change. This tree was constructed by comparing
sequences of homologs of a gene that plays a role in development;
Drosophila was used as an outgroup. The branch lengths are proportional to
the amount of genetic change in each lineage; varying branch lengths indicate
that the gene has evolved at different rates in different lineages.
I N T E R P R E T T H E DATA In which vertebrate lineage has the studied gene evolved most rapidly? Explain.
556 UNIT FIVE The Evolutionary History of Biological Diversity
According to the principle of maximum parsimony,
we should first investigate the simplest explanation that is
consistent with the facts. (The parsimony principle is also
called “Occam’s razor” after William of Occam, a 14th-
century English philosopher who advocated this minimalist
problem-solving approach of “shaving away” unnecessary
complications.) In the case of trees based on morphology,
the most parsimonious tree requires the fewest evolutionary
events, as measured by the origin of shared derived morpho-
logical characters. For phylogenies based on DNA, the most
parsimonious tree requires the fewest base changes.
A maximum likelihood approach identifies the tree most
likely to have produced a given set of DNA data, based on
certain probability rules about how DNA sequences change
over time. For example, the underlying probability rules
could be based on the assumption that all nucleotide substi-
tutions are equally likely. However, if evidence suggests that
this assumption is not correct, more complex rules could be
devised to account for different rates of change among dif-
ferent nucleotides or at different positions in a gene.
Scientists have developed many computer programs to
search for trees that are parsimonious and likely. When a
large amount of accurate data is available, the methods used
in these programs usually yield similar trees. As an example
of one method, Figure 26.15 walks you through the process
of identifying the most parsimonious molecular tree for a
little in their morphology since that common ancestor,
there have nonetheless been 3 billion years of evolution
in the bacterial lineage, just as there have been 3 billion
years of evolution in the lineage that ultimately gave rise to
humans.
These equal spans of chronological time can be repre-
sented in a phylogenetic tree whose branch lengths are pro-
portional to time (Figure 26.14). Such a tree draws on fossil
data to place branch points in the context of geologic time.
Additionally, it is possible to combine these two types of
trees by labeling branch points with information about rates
of genetic change or dates of divergence.
Maximum Parsimony and Maximum
Likelihood
As the database of DNA sequences that enables us to study
more species grows, the difficulty of building the phyloge-
netic tree that best describes their evolutionary history also
grows. What if you are analyzing data for 50 species? There
are 3 * 1076
different ways to arrange 50 species into a tree!
And which tree in this huge forest reflects the true phy-
logeny? Systematists can never be sure of finding the most
accurate tree in such a large data set, but they can narrow
the possibilities by applying the principles of maximum par-
simony and maximum likelihood.
542 251
Millions of years ago
PALEOZOIC MESOZOIC CENOZOIC
65.5 Present
Drosophila
Lancelet
Zebrafish
Frog
Chicken
Human
Mouse
▲ Figure 26.14 Branch lengths can indicate time. This tree is based on the same molecular
data as the tree in Figure 26.13, but here the branch points are mapped to dates based on fossil
evidence. Thus, the branch lengths are proportional to time. Each lineage has the same total length
from the base of the tree to the branch tip, indicating that all the lineages have diverged from the
common ancestor for equal amounts of time.
C HAPTER 26 Phylogeny and the Tree of Life 557
Research Method▼ Figure 26.15
Application In considering possible phylogenies for a group of species, sys-
tematists compare molecular data for the species. An efficient way to begin
is by identifying the most parsimonious hypothesis—the one that requires the
fewest evolutionary events (molecular changes) to have occurred.
Applying Parsimony to a Problem in Molecular Systematics
1/C
1/C
1/C 1/C
1/C
3/A
2/T
4/C
3/A 4/C
2/T
3/A
4/C
2/T 4/C
3/A
4/C
2/T
2/T 3/A
7 events6 events 7 events
Species I
Three phylogenetic hypotheses:
Site
1 2 3 4
CSpecies I T A T
CSpecies II T T C
ASpecies III
Ancestral sequence
G A C
A G T T
I
II
III
I
III
II
III
II
I
I
II
III
I
III
II
III
II
I
I
II
III
I
III
II I
III
II
I
II
III
I
III
II
III
II
I
Species II Species III
Technique Follow the numbered steps as we apply the principle
of parsimony to a hypothetical phylogenetic problem involving three
closely related bird species.
1 First, draw the three possible phylogenies for the species. (Al-
though only 3 trees are possible when ordering 3 species, the
number of possible trees increases rapidly with the number of spe-
cies: There are 15 trees for 4 species and 34,459,425 trees for 10
species.)
2 Tabulate the molecular data for the species. In this simplified ex-
ample, the data represent a DNA sequence consisting of just four
nucleotide bases. Data from several outgroup species (not shown)
were used to infer the ancestral DNA sequence.
3 Now focus on site 1 in the DNA sequence. In the tree on the left,
a single base-change event, represented by the purple hatchmark
on the branch leading to species I and II (and labeled 1/C, indicat-
ing a change at site 1 to nucleotide C), is sufficient to account for
the site 1 data. In the other two trees, two base-change events are
necessary.
4 Continuing the comparison of bases at sites 2, 3, and 4 reveals
that each of the three trees requires a total of five additional base-
change events (purple hatchmarks).
Results To identify the most parsimonious tree, we total all of the
base-change events noted in steps 3 and 4. We conclude that the first
tree is the most parsimonious of the three possible phylogenies. (In a
real example, many more sites would be analyzed. Hence, the trees
would often differ by more than one base-change event.)
558 UNIT FIVE The Evolutionary History of Biological Diversity
crocodiles cover their eggs with their neck. Reasoning that
any feature shared by birds and crocodiles is likely to have
been present in their common ancestor (denoted by the blue
dot in Figure 26.16) and all of its descendants, biologists
predicted that dinosaurs had four-chambered hearts, sang,
built nests, and exhibited brooding.
Internal organs, such as the heart, rarely fossilize, and
it is, of course, difficult to test whether dinosaurs sang to
defend territories and attract mates. However, fossilized
dinosaur eggs and nests have provided evidence support-
ing the prediction of brooding in dinosaurs. First, a fossil
embryo of an Oviraptor dinosaur was found, still inside its
egg. This egg was identical to those found in another fos-
sil, one that showed an Oviraptor crouching over a group
of eggs in a posture similar to that seen in brooding birds
today (Figure 26.17). Researchers suggested that the Ovi-
raptor dinosaur preserved in this second fossil died while
incubating or protecting its eggs. The broader conclusion
that emerged from this work—that dinosaurs built nests
and exhibited brooding—has since been strengthened by
additional fossil discoveries that show that other species
of dinosaurs built nests and sat on their eggs. Finally, by
supporting predictions based on the phylogenetic hypoth-
esis shown in Figure 26.16, fossil discoveries of nests
and brooding in dinosaurs
provide independent data
that suggest that the
hypothesis is correct.
three-species problem. Computer programs use the prin-
ciple of parsimony to estimate phylogenies in a similar way:
They examine large numbers of possible trees and identify
those that require the fewest evolutionary changes.
Phylogenetic Trees as Hypotheses
This is a good place to reiterate that any phylogenetic tree
represents a hypothesis about how the organisms in the tree
are related to one another. The best hypothesis is the one
that best fits all the available data. A phylogenetic hypothesis
may be modified when new evidence compels systematists
to revise their trees. Indeed, while many older phylogenetic
hypotheses have been supported by new morphological and
molecular data, others have been changed or rejected.
Thinking of phylogenies as hypotheses also allows us to
use them in a powerful way: We can make and test predic-
tions based on the assumption that a particular phylogeny—
our hypothesis—is correct. For example, in an approach
known as phylogenetic bracketing, we can predict (by parsi-
mony) that features shared by two groups of closely related
organisms are present in their common ancestor and all of
its descendants unless independent data indicate otherwise.
(Note that “prediction” can refer to unknown past events as
well as to evolutionary changes yet to occur.)
This approach has been used to make novel predictions
about dinosaurs. For example, there is evidence that birds
descended from the theropods, a group of bipedal sauris-
chian dinosaurs. As seen in Figure 26.16, the closest living
relatives of birds are crocodiles. Birds and crocodiles share
numerous features: They have four-chambered hearts, they
“sing” to defend territories and attract mates (although a
crocodile’s “song” is more like a bellow), and they build
nests. Both birds and crocodiles also care for their eggs
by brooding, a behavior in which a parent warms the eggs
with its body. Birds brood by sitting on their eggs, whereas
Lizards
and snakes
Crocodilians
Ornithischian
dinosaurs
Saurischian
dinosaurs
Common
ancestor of
crocodilians,
dinosaurs,
and birds
Birds
▲ Figure 26.16 A phylogenetic tree of birds and their close
relatives.
? What is the most basal taxon represented in this tree?
Front
limb
Hind limb
(a)
Eggs
Fossil remains of
Oviraptor and eggs.
The orientation of the
bones, which surround
and cover the eggs,
suggests that the
dinosaur died while
incubating or protect-
ing its eggs.
(b) Artist’s reconstruction of the
dinosaur’s posture based on
the fossil findings.
▲ Figure 26.17 Fossil support for a phylogenetic prediction:
Dinosaurs built nests and brooded their eggs.
C HAPTER 26 Phylogeny and the Tree of Life 559
C O N C E P T C H E C K 2 6 . 3
1. To distinguish a particular clade of mammals within the
larger clade that corresponds to class Mammalia, would
hair be a useful character? Why or why not?
2. The most parsimonious tree of evolutionary relationships
can be inaccurate. How can this occur?
3. W H AT I F ? Draw a phylogenetic tree that includes the
relationships from Figure 25.7 and Figure 26.16.Tradition-
ally, all the taxa shown besides birds and mammals were
classified as reptiles. Would a cladistic approach support
that classification? Explain.
For suggested answers, see Appendix A.
C O N C E P T 26.4
An organism’s evolutionary history is
documented in its genome
As you have seen in this chapter, molecular systematics—
using comparisons of nucleic acids or other molecules to
deduce relatedness—can reveal phylogenetic relationships
that cannot be determined by nonmolecular methods such
as comparative anatomy. For example, molecular systemat-
ics helps us uncover evolutionary relationships between
groups that have little common ground for morphologi-
cal comparison, such as animals and fungi. And molecular
methods allow us to reconstruct phylogenies among groups
of present-day organisms for which the fossil record is poor
or lacking entirely.
Different genes can evolve at different rates, even in the
same evolutionary lineage. As a result, molecular trees can
represent short or long periods of time, depending on which
Ancestral gene Ancestral gene
Species CAncestral species
Speciation with
divergence of gene
Gene duplication and divergence
Paralogous genesOrthologous genes
Species A Species C after many generationsSpecies B
(a) Formation of orthologous genes: a product of speciation (b) Formation of paralogous genes: within a species
▼ Figure 26.18 Two types of homologous genes. Colored bands mark regions of the genes
where differences in base sequences have accumulated.
genes are used. For example, the DNA that codes for ribo-
somal RNA (rRNA) changes relatively slowly. Therefore,
comparisons of DNA sequences in these genes are useful for
investigating relationships between taxa that diverged hun-
dreds of millions of years ago. Studies of rRNA sequences
indicate, for instance, that fungi are more closely related
to animals than to plants. In contrast, mitochondrial DNA
(mtDNA) evolves relatively rapidly and can be used to ex-
plore recent evolutionary events. One research team has
traced the relationships among Native American groups
through their mtDNA sequences. The molecular find-
ings corroborate other evidence that the Pima of Arizona,
the Maya of Mexico, and the Yanomami of Venezuela are
closely related, probably descending from the first of three
waves of immigrants that crossed the Bering Land Bridge
from Asia to the Americas about 15,000 years ago.
Gene Duplications and Gene Families
What do molecular data reveal about the evolutionary his-
tory of genome change? Consider gene duplication, which
plays a particularly important role in evolution because it in-
creases the number of genes in the genome, providing more
opportunities for further evolutionary changes. Molecular
techniques now allow us to trace the phylogenies of gene
duplications. These molecular phylogenies must account
for repeated duplications that have resulted in gene families,
groups of related genes within an organism’s genome (see
Figure 21.11).
Accounting for such duplications leads us to distinguish
two types of homologous genes (Figure 26.18): orthologous
genes and paralogous genes. In orthologous genes (from
the Greek orthos, exact), the homology is the result of a
560 UNIT FIVE The Evolutionary History of Biological Diversity
speciation event and hence occurs between genes found in
different species (see Figure 26.18a). For example, the genes
that code for cytochrome c (a protein that functions in elec-
tron transport chains) in humans and dogs are orthologous.
In paralogous genes (from the Greek para, in parallel), the
homology results from gene duplication; hence, multiple
copies of these genes have diverged from one another within
a species (see Figure 26.18b). In Chapter 23, you encoun-
tered the example of olfactory receptor genes, which have
undergone many gene duplications in vertebrates; humans
have 350 of these paralogous genes, while mice have 1,000.
Note that orthologous genes can only diverge after spe-
ciation has taken place, that is, after the genes are found
in separate gene pools. For example, although the cyto-
chrome c genes in humans and dogs serve the same func-
tion, the gene’s sequence in humans has diverged from that
in dogs in the time since these species last shared a com-
mon ancestor. Paralogous genes, on the other hand, can
diverge within a species because they are present in more
than one copy in the genome. The paralogous genes that
make up the olfactory receptor gene family in humans have
diverged from each other during our long evolutionary his-
tory. They now specify proteins that confer sensitivity to a
wide variety of molecules, ranging from food odors to sex
pheromones.
Genome Evolution
Now that we can compare the entire genomes of different
organisms, including our own, two patterns have emerged.
First, lineages that diverged long ago often share many
orthologous genes. For example, though the human and
mouse lineages diverged about 65 million years ago, 99% of
the genes of humans and mice are orthologous. And 50% of
human genes are orthologous with those of yeast, despite
1 billion years of divergent evolution. Such commonalities
explain why disparate organisms nevertheless share many
biochemical and developmental pathways. As a result of
these shared pathways, the functioning of genes linked to
diseases in humans can often be investigated by studying
yeast and other organisms distantly related to humans.
Second, the number of genes a species has doesn’t seem
to increase through duplication at the same rate as per-
ceived phenotypic complexity. Humans have only about
four times as many genes as yeast, a single-celled eukaryote,
even though—unlike yeast—we have a large, complex brain
and a body with more than 200 different types of tissues.
Evidence is emerging that many human genes are more ver-
satile than those of yeast: A single human gene can encode
multiple proteins that perform different tasks in various
body tissues. Unraveling the mechanisms that cause this
genomic versatility and phenotypic variation is an exciting
challenge.
C O N C E P T C H E C K 2 6 . 4
1. Explain how comparing proteins of two species can yield
data about the species’ evolutionary relationship.
2. W H AT I F ? Suppose gene A is orthologous in species
1 and species 2, and gene B is paralogous to gene A
in species 1. Suggest a sequence of two evolutionary
events that could result in the following: Gene A differs
considerably between species, yet gene A and gene B
show little divergence from each other.
3. M A K E C O N N E C T I O N S Review Figure 18.13; then sug-
gest how a particular gene could have different func-
tions in different tissues within an organism.
For suggested answers, see Appendix A.
C O N C E P T 26.5
Molecular clocks help track
evolutionary time
One goal of evolutionary biology is to understand the rela-
tionships among all organisms, including those for which
there is no fossil record. However, if we attempt to deter-
mine the timing of phylogenies that extend beyond the fos-
sil record, we must rely on an important assumption about
how change occurs at the molecular level.
Molecular Clocks
We stated earlier that researchers have estimated that the
common ancestor of Hawaiian silversword plants lived
about 5 million years ago. How did they make this esti-
mate? They relied on the concept of a molecular clock,
an approach for measuring the absolute time of evolution-
ary change based on the observation that some genes and
other regions of genomes appear to evolve at constant rates.
An assumption underlying the molecular clock is that the
number of nucleotide substitutions in orthologous genes
is proportional to the time that has elapsed since the genes
branched from their common ancestor (divergence time).
In the case of paralogous genes, the number of substitu-
tions is proportional to the time since the ancestral gene
was duplicated.
We can calibrate the molecular clock of a gene that
has a reliable average rate of evolution by graphing the
number of genetic differences—for example, nucleotide,
codon, or amino acid differences—against the dates of
evolutionary branch points that are known from the fossil
record (Figure 26.19). The average rates of genetic change
inferred from such graphs can then be used to estimate the
dates of events that cannot be discerned from the fossil re-
cord, such as the origin of the silverswords discussed earlier.
Of course, no gene marks time with complete precision.
In fact, some portions of the genome appear to have evolved
C HAPTER 26 Phylogeny and the Tree of Life 561
others. Indeed, evidence suggests that almost half the ami-
no acid differences in proteins of two Drosophila species,
D. simulans and D. yakuba, are not neutral but have resulted
from natural selection. But because the direction of natural
selection may change repeatedly over long periods of time
(and hence may average out), some genes experiencing se-
lection can nevertheless serve as approximate markers of
elapsed time.
Another question arises when researchers attempt to ex-
tend molecular clocks beyond the time span documented by
the fossil record. Although some fossils are more than 3 bil-
lion years old, these are very rare. An abundant fossil record
extends back only about 550 million years, but molecular
clocks have been used to date evolutionary divergences that
occurred a billion or more years ago. These estimates as-
sume that the clocks have been constant for all that time.
Such estimates are highly uncertain.
In some cases, problems may be avoided by calibrat-
ing molecular clocks with data on the rates at which genes
have evolved in different taxa. In other cases, problems may
be avoided by using many genes rather than the common
approach of using just one or a few genes. By using many
genes, fluctuations in evolutionary rate due to natural selec-
tion or other factors that vary over time may average out.
For example, one group of researchers constructed molecu-
lar clocks of vertebrate evolution from published sequence
data for 658 nuclear genes. Despite the broad period of time
covered (nearly 600 million years) and the fact that natural
selection probably affected some of these genes, their esti-
mates of divergence times agreed closely with fossil-based
estimates. As this example suggests, if used with care, mol-
ecular clocks can aid our understanding of evolutionary
relationships.
Applying a Molecular Clock: Dating the
Origin of HIV
Researchers have used a molecular clock to date the origin
of HIV infection in humans. Phylogenetic analysis shows
that HIV, the virus that causes AIDS, is descended from vi-
ruses that infect chimpanzees and other primates. (Most of
these viruses do not cause AIDS-like diseases in their native
hosts.) When did HIV jump to humans? There is no simple
answer, because the virus has spread to humans more than
once. The multiple origins of HIV are reflected in the variety
of strains (genetic types) of the virus. HIV’s genetic mate-
rial is made of RNA, and like other RNA viruses, it evolves
quickly.
The most widespread strain in humans is HIV-1 M. To
pinpoint the earliest HIV-1 M infection, researchers com-
pared samples of the virus from various times during the ep-
idemic, including a sample from 1959. A comparison of gene
sequences showed that the virus has evolved in a clocklike
in irregular bursts that are not at all clocklike. And even
those genes that seem to act as reliable molecular clocks
are accurate only in the statistical sense of showing a fairly
smooth average rate of change. Over time, there may still
be deviations from that average rate. Furthermore, the same
gene may evolve at different rates in different groups of or-
ganisms. Finally, when comparing genes that are clocklike,
the rate of the clock may vary greatly from one gene to an-
other; some genes evolve a million times faster than others.
Differences in Clock Speed
What causes such differences in the speed at which clock-
like genes evolve? The answer stems from the fact that some
mutations are selectively neutral—neither beneficial nor
detrimental. Of course, many new mutations are harmful
and are removed quickly by selection. But if most of the rest
are neutral and have little or no effect on fitness, then the
rate of evolution of those neutral mutations should indeed be
regular, like a clock. Differences in the clock rate for different
genes are a function of how important a gene is. If the exact
sequence of amino acids that a gene specifies is essential to
survival, most of the mutational changes will be harmful and
only a few will be neutral. As a result, such genes change only
slowly. But if the exact sequence of amino acids is less criti-
cal, fewer of the new mutations will be harmful and more will
be neutral. Such genes change more quickly.
Potential Problems with Molecular Clocks
In fact, molecular clocks do not run as smoothly as would be
expected if the underlying mutations were selectively neu-
tral. Many irregularities are likely to be the result of natural
selection in which certain DNA changes are favored over
Numberofmutations
Divergence time (millions of years)
0 30 60 90 120
90
60
30
0
▲ Figure 26.19 A molecular clock for mammals. The number
of accumulated mutations in seven proteins has increased over time
in a consistent manner for most mammal species. The three green
data points represent primate species, whose proteins appear to have
evolved more slowly than those of other mammals. The divergence
time for each data point was based on fossil evidence.
I N T E R P R E T T H E DATA Use the graph to estimate the divergence
time for a mammal with a total of 30 mutations in the seven proteins.
562 UNIT FIVE The Evolutionary History of Biological Diversity
fashion (Figure 26.20). Extrapolating backward in time
using the molecular clock indicates that the HIV-1 M strain
first spread to humans around 1930. A later study, which
dated the origin of HIV using a more advanced molecular
clock approach than that covered in this book, estimated
that the HIV-1 M strain first spread to humans around 1910.
0.20
IndexofbasechangesbetweenHIVgenesequences
0.15
0.10
Range
HIV
0.05
0
1920 1940 1960 1980 20001900
Year
Adjusted best-fit line
(accounts for uncertain
dates of HIV sequences)
© 2000 AAAS
▲ Figure 26.20 Dating the origin of HIV-1 M. The black data
points are based on DNA sequences of an HIV gene in patients’ blood
samples. (The dates when these individual HIV gene sequences arose
are not certain because a person can harbor the virus for years before
symptoms occur.) Projecting the gene’s rate of change backward in
time suggests that the virus originated in the 1930s.
C O N C E P T C H E C K 2 6 . 5
1. What is a molecular clock? What assumption underlies
the use of a molecular clock?
2. M A K E C O N N E C T I O N S Review Concept 17.5.Then
explain how numerous base changes could occur in an
organism’s DNA yet have no effect on its fitness.
3. W H AT I F ? Suppose a molecular clock dates the diver-
gence of two taxa at 80 million years ago, but new fossil
evidence shows that the taxa diverged at least 120 mil-
lion years ago. Explain how this could happen.
For suggested answers, see Appendix A.
C O N C E P T 26.6
Our understanding of the tree of life
continues to change based on new data
The discovery that the glass lizard in Figure 26.1 evolved
from a different lineage of legless lizards than did snakes
is one example of how our understanding of life’s diversity
is informed by systematics. Indeed, in recent decades, sys-
tematists have gained insight into even the very deepest
branches of the tree of life by analyzing DNA sequence data.
From Two Kingdoms to Three Domains
Taxonomists once classified all known species into two
kingdoms: plants and animals. Classification schemes with
more than two kingdoms gained broad acceptance in the
late 1960s, when many biologists recognized five kingdoms:
Monera (prokaryotes), Protista (a diverse kingdom consist-
ing mostly of unicellular organisms), Plantae, Fungi, and
Animalia. This system highlighted the two fundamentally
different types of cells, prokaryotic and eukaryotic, and set
the prokaryotes apart from all eukaryotes by placing them in
their own kingdom, Monera.
However, phylogenies based on genetic data soon began to
reveal a problem with this system: Some prokaryotes differ as
much from each other as they do from eukaryotes. Such dif-
ficulties have led biologists to adopt a three-domain system.
The three domains—Bacteria, Archaea, and Eukarya—are a
taxonomic level higher than the kingdom level. The validity
of these domains is supported by many studies, including a
recent study that analyzed nearly 100 completely sequenced
genomes.
The domain Bacteria contains most of the currently
known prokaryotes, while the domain Archaea consists of a
diverse group of prokaryotic organisms that inhabit a wide
variety of environments. The domain Eukarya consists of all
the organisms that have cells containing true nuclei. This
domain includes many groups of single-celled organisms as
well as multicellular plants, fungi, and animals. Figure 26.21
represents one possible phylogenetic tree for the three do-
mains and some of the many lineages they encompass.
The three-domain system highlights the fact that much
of the history of life has been about single-celled organisms.
The two prokaryotic domains consist entirely of single-
celled organisms, and even in Eukarya, only the branches
labeled in blue type (land plants, fungi, and animals) are
dominated by multicellular organisms. Of the five king-
doms previously recognized by taxonomists, most biologists
continue to recognize Plantae, Fungi, and Animalia, but
not Monera and Protista. The kingdom Monera is obsolete
because it would have members in two different domains.
The kingdom Protista has also crumbled because it includes
members that are more closely related to plants, fungi, or
animals than to other protists (see Chapter 28).
The Important Role of Horizontal Gene
Transfer
In the phylogeny shown in Figure 26.21, the first major split
in the history of life occurred when bacteria diverged from
C HAPTER 26 Phylogeny and the Tree of Life 563
Forams
Euglenozoans
Diatoms
Ciliates
Red algae
Green algae
Land plants
Amoebas
Fungi
Animals
Nanoarchaeotes
Methanogens
Thermophiles
Proteobacteria
(Mitochondria)*
Chlamydias
Spirochetes
Gram-positive
bacteria
Cyanobacteria
(Chloroplasts)*
COMMON
ANCESTOR
OF ALL LIFE DomainBacteriaDomainEukaryaDomain
Archaea
▲ Figure 26.21 The three domains of life. This phylogenetic tree
is based on sequence data for rRNA and other genes. For simplicity,
only some of the major branches in each domain are shown. Lineages
within Eukarya that are dominated by multicellular organisms (land
plants, fungi, and animals) are in blue type, while the two lineages
denoted by an asterisk are based on DNA from cellular organelles. All
other lineages consist solely or mainly of single-celled organisms.
M A K E C O N N E C T I O N S After reviewing endosymbiont theory (see
Figure 6.16), explain the specific positions of the mitochondrion and chlo-
roplast lineages on this tree.
What causes trees based on data from different genes
to yield such different results? Comparisons of complete
genomes from the three domains show that there have been
substantial movements of genes between organisms in the
different domains. These took place through horizontal
gene transfer, a process in which genes are transferred
from one genome to another through mechanisms such as
exchange of transposable elements and plasmids, viral in-
fection (see Chapter 19), and perhaps fusions of organisms
(as when a host and its endosymbiont become a single or-
ganism). Recent research reinforces the view that horizon-
tal gene transfer is important. For example, a 2008 analysis
indicated that, on average, 80% of the genes in 181 prokary-
otic genomes had moved between species at some point
during the course of evolution. Because phylogenetic trees
are based on the assumption that genes are passed vertically
from one generation to the next, the occurrence of such
horizontal transfer events helps to explain why trees built
using different genes can give inconsistent results.
Horizontal gene transfer can also occur between eukary-
otes. For example, over 200 cases of the horizontal transfer
of transposons have been reported in eukaryotes, including
humans and other primates, plants, birds, and the gecko
shown in Figure 26.22. Nuclear genes have also been trans-
ferred horizontally from one eukaryote to another. The
Scientific Skills Exercise describes one such example, giv-
ing you the opportunity to interpret data on the transfer of a
pigment gene to an aphid from another species.
Overall, horizontal gene transfer has played a key role
throughout the evolutionary history of life and it continues
to occur today. Some biologists have argued that horizontal
gene transfer was so common that the early history of life
should be represented not as a dichotomously branching
tree like that in Figure 26.21, but rather as a tangled network
other organisms. If this tree is correct, eukaryotes and ar-
chaea are more closely related to each other than either is
to bacteria.
This reconstruction of the tree of life is based in part on
sequence comparisons of rRNA genes, which code for the
RNA components of ribosomes. However, some other genes
reveal a different set of relationships. For example, research-
ers have found that many of the genes that influence meta-
bolism in yeast (a unicellular eukaryote) are more similar
to genes in the domain Bacteria than they are to genes in
the domain Archaea—a finding that suggests that the
eukaryotes may share a more recent common ancestor
with bacteria than with archaea.
▼ Figure 26.22 A recipient of transferred
genes: the Mediterranean house gecko
(Hemidactylus turcicus). Recent genetic
evidence indicates that this gecko is one of
17 reptile species that acquired the transposon SPIN
as a result of horizontal gene transfer. The transpo-
son may have been transferred from
one species to another by
the feeding activities
of blood-sucking
insects.
564 UNIT FIVE The Evolutionary History of Biological Diversity
of connected branches (Figure 26.23). Although scientists
continue to debate whether early steps in the history of life
are best represented as a tree or a tangled web, in recent de-
cades there have been many exciting discoveries about evo-
lutionary events that occurred over time. We’ll explore such
discoveries in the rest of this unit’s chapters, beginning with
Earth’s earliest inhabitants, the prokaryotes.
DomainBacteriaDomainEukaryaDomain
Archaea
Cyanobacteria
Proteobacteria
Fungi
Plantae
Animalia
Chloroplasts
Mitochondria
Ancestral cell
populations Thermophiles
Methanogens
© 1999 AAAS
▶ Figure 26.23 A tangled web
of life. Horizontal gene transfer may
have been so common in the early
history of life that the base of
a “tree of life” might be more
accurately portrayed as a
tangled web.
C O N C E P T C H E C K 2 6 . 6
1. Why is the kingdom Monera no longer considered a valid
taxon?
2. Explain why phylogenies based on different genes can
yield different branching patterns for the tree of all life.
3. W H AT I F ? Draw the three possible dichotomously
branching trees showing evolutionary relationships for
the domains Bacteria,Archaea, and Eukarya.Two of
these trees have been supported by genetic data. Is it
likely that the third tree might also receive such support?
Explain your answer.
For suggested answers, see Appendix A.
S C I E N T I F I C S K I L L S E X E R C I S E
Did Aphids Acquire Their Ability to Make Carotenoids Through
Horizontal Gene Transfer? Carotenoids are colored molecules that
have diverse functions in many organisms, such as photosynthesis in
plants and light detection in animals. Plants and many microorganisms
can synthesize carotenoids from scratch, but animals generally cannot
(they must obtain carotenoids from their diet). One exception is the
pea aphid Acyrthosiphon pisum, a small plant-dwelling insect whose
genome includes a full set of genes for the enzymes needed to make
carotenoids. Because other animals lack these genes, it is unlikely that
aphids inherited them from a single-celled common ancestor shared
with microorganisms and plants. So where did they come from? Evo-
lutionary biologists hypothesize that an aphid ancestor acquired these
genes by horizontal gene transfer from distantly related organisms.
How the Experiment Was Done Scientists obtained the DNA se-
quences for the carotenoid-biosynthesis genes from several species,
including aphids, fungi, bacteria, and plants. A computer “translated”
these sequences into amino acid sequences of the encoded polypeptides
and aligned the amino acid sequences. This allowed the team to com-
pare the corresponding polypeptides in the different organisms.
Data from the Experiment The sequences below show the first 60
amino acids of one polypeptide of the carotenoid-biosynthesis enzymes
in the plant Arabidopsis thaliana (bottom) and the corresponding amino
acids in five nonplant species, using the one-letter abbreviations for the
amino acids (see Figure 5.14). A hyphen (-) indicates that a species lacks
Using Protein Sequence Data to Test an Evolutionary Hypothesis
Organism Alignment of Amino Acid Sequences
Acyrthosiphon (aphid)
Ustilago (fungus)
Gibberella (fungus)
Staphylococcus (bacterium)
Pantoea (bacterium)
Arabidopsis (plant)
a particular amino acid found in
the Arabidopsis sequence.
Interpret the Data
1. In the rows of data for the
organisms being compared
with the aphid, highlight the amino acids that are identical to the cor-
responding amino acids in the aphid.
2. Which organism has the most amino acids in common with the
aphid? Rank the partial polypeptides from the other four organisms in
degree of similarity to that of the aphid.
3. Do these data support the hypothesis that aphids acquired the gene
for this polypeptide by horizontal gene transfer? Why or why not? If
horizontal gene transfer did occur, what type of organism is likely to
have been the source?
4. What additional sequence data would support your hypothesis?
5. How would you account for the similarities between the aphid se-
quence and the sequences for the bacteria and plant?
A version of this Scientific Skills Exercise can be assigned in
MasteringBiology.
Data from Nancy A. Moran, Yale University. See N. A. Moran and T. Jarvik, Lateral trans-
fer of genes from fungi underlies carotenoid production in aphids, Science 328:624–627
(2010).
C HAPTER 26 Phylogeny and the Tree of Life 565
Clades can be distinguished by their shared derived characters.
SUMMARY OF KEY CONCEPTS
C O N C E P T 26.1
Phylogenies show evolutionary relationships (pp. 548–551)
Linnaeus’s binomial classification system gives organisms two-
part names: a genus plus a specific epithet.
In the Linnaean system, species are grouped in increasingly
broad taxa: Related genera are placed in the same family, fami-
lies in orders, orders in classes, classes in phyla, phyla in king-
doms, and (more recently) kingdoms in domains.
Systematists depict evolutionary relationships as branching phy-
logenetic trees. Many systematists propose that classification
be based entirely on evolutionary relationships.
Chapter Review26
Taxon A
Taxon B
Sister taxa
Basal taxon
Most recent
common
ancestor
Branch point
Polytomy
Taxon C
Taxon D
Taxon E
Taxon F
Taxon G
Unless branch lengths are proportional to time or genetic
change, a phylogenetic tree indicates only patterns of descent.
Much information can be learned about a species from its evolu-
tionary history; hence, phylogenies are useful in a wide range of
applications.
? Humans and chimpanzees are sister species. Explain what that means.
C O N C E P T 26.2
Phylogenies are inferred from morphological and molecular
data (pp. 551–553)
Organisms with similar morphologies or DNA sequences are
likely to be more closely related than organisms with very differ-
ent structures and genetic sequences.
To infer phylogeny, homology (similarity due to shared ances-
try) must be distinguished from analogy (similarity due to con-
vergent evolution).
Computer programs are used to align comparable DNA se-
quences and to distinguish molecular homologies from coinci-
dental matches between taxa that diverged long ago.
? Why is it necessary to distinguish homology from analogy to infer
phylogeny?
C O N C E P T 26.3
Shared characters are used to construct phylogenetic trees
(pp. 553–559)
A clade is a monophyletic grouping that includes an ancestral
species and all of its descendants.
A
C
Monophyletic group Polyphyletic group
Paraphyletic group
D
E
F
G
B
A
C
D
E
F
G
B
A
C
D
E
F
G
B
Among phylogenies, the most parsimonious tree is the one that
requires the fewest evolutionary changes. The most likely tree is
the one based on the most likely pattern of changes.
Well-supported phylogenetic hypotheses are consistent with a
wide range of data.
? Explain the logic of using shared derived characters to infer
phylogeny.
C O N C E P T 26.4
An organism’s evolutionary history is documented in its
genome (pp. 559–560)
Orthologous genes are homologous genes found in different
species as a result of speciation. Paralogous genes are homolo-
gous genes within a species that result from gene duplication;
such genes can diverge and potentially take on new functions.
Distantly related species often have many orthologous genes.
The small variation in gene number in organisms of varying
complexity suggests that genes are versatile and may have mul-
tiple functions.
? When reconstructing phylogenies, is it better to compare ortholo-
gous or paralogous genes? Explain.
C O N C E P T 26.5
Molecular clocks help track evolutionary time (pp. 560–562)
Some regions of DNA change at a rate consistent enough to
serve as a molecular clock, in which the amount of genetic
change is used to estimate the date of past evolutionary events.
Other DNA regions change in a less predictable way.
Molecular clock analyses suggest that the most common strain
of HIV jumped from primates to humans in the early 1900s.
? Describe some assumptions and limitations of molecular clocks.
C O N C E P T 26.6
Our understanding of the tree of life continues to change
based on new data (pp. 562–564)
Past classification systems have given way to the current view of
the tree of life, which consists of three great domains: Bacteria,
Archaea, and Eukarya.
This West Indian manatee (Trichechus manatus) is an aquatic
mammal. Like amphibians and reptiles, mammals are tetra-
pods (vertebrates with four limbs). Explain why manatees are
considered tetrapods even though they lack hind limbs, and
suggest traits that manatees likely share with leopards and
other mammals (see Figure 26.12b). How might early members
of the manatee lineage have differed from today’s manatees?
For selected answers, see Appendix A.
Salamander
Lizard
Goat
Human
Students Go to MasteringBiology for assignments, the eText, and the
Study Area with practice tests, animations, and activities.
Instructors Go to MasteringBiology for automatically graded tutorials and
questions that you can assign to your students, plus Instructor Resources.
LEVEL 3: SYNTHESIS/EVALUATION
8. EVOLUTION CONNECTION
Darwin suggested looking at a species’ close relatives to learn
what its ancestors may have been like. How does his suggestion
anticipate recent methods, such as phylogenetic bracketing
and the use of outgroups in cladistic analysis?
9. SCIENTIFIC INQUIRY
D R AW I T (a) Draw a phylogenetic tree based on characters
1–5 in the table below. Place hatch marks on the tree to indi-
cate the origin(s) of characters 1–6. (b) Assume that tuna and
dolphins are sister species and redraw the phylogenetic tree
accordingly. Use hatch marks to indicate the origin(s) of char-
acters 1–6. (c) How many evolutionary changes are required in
each tree? Which tree is most parsimonious?
Character
Lancelet
(outgroup)
Lamprey
Tuna
Salamander
Turtle
Leopard
Dolphin
(1) Backbone 0 1 1 1 1 1 1
(2) Hinged jaw 0 0 1 1 1 1 1
(3) Four limbs 0 0 0 1 1 1 1*
(4) Amnion 0 0 0 0 1 1 1
(5) Milk 0 0 0 0 0 1 1
(6) Dorsal fin 0 0 1 0 0 0 1
*Although adult dolphins have only two obvious limbs (their flippers), as em-
bryos they have two hind-limb buds, for a total of four limbs.
10. WRITE ABOUT A THEME: INFORMATION
In a short essay (100–150 words), explain how genetic infor-
mation—along with an understanding of the process of descent
with modification—enables scientists to reconstruct phylog-
enies that extend hundreds of millions of years back in time.
11. SYNTHESIZE YOUR KNOWLEDGE
Phylogenies based in part on rRNA genes suggest that eukary-
otes are most closely related to archaea, while data from some
other genes suggest a closer relationship to bacteria.
Genetic analyses indicate that extensive horizontal gene transfer
has occurred throughout the evolutionary history of life.
? Why was the five-kingdom system abandoned for a three-domain
system?
TEST YOUR UNDERSTANDING
LEVEL 1: KNOWLEDGE/COMPREHENSION
1. In a comparison of birds and mammals, the condition of hav-
ing four limbs is
a. a shared ancestral character.
b. a shared derived character.
c. a character useful for distinguishing birds from mammals.
d. an example of analogy rather than homology.
2. To apply parsimony to constructing a phylogenetic tree,
a. choose the tree that assumes all evolutionary changes are
equally probable.
b. choose the tree in which the branch points are based on as
many shared derived characters as possible.
c. choose the tree that represents the fewest evolutionary
changes, in either DNA sequences or morphology.
d. choose the tree with the fewest branch points.
LEVEL 2: APPLICATION/ANALYSIS
3. In Figure 26.4, which similarly inclusive taxon descended from
the same common ancestor as Canidae?
a. Felidae
b. Mustelidae
a. The salamander lineage is a basal taxon.
b. Salamanders are a sister group to the group containing liz-
ards, goats, and humans.
c. Salamanders are as closely related to goats as to humans.
d. Lizards are more closely related to salamanders than to
humans.
6. If you were using cladistics to build a phylogenetic tree of cats,
which of the following would be the best outgroup?
a. wolf
b. domestic cat
c. Carnivora
d. Lutra
c. lion
d. leopard
4. Three living species X, Y, and Z share a common ancestor T, as
do extinct species U and V. A grouping that consists of species
T, X, Y, and Z (but not U or V) makes up
a. a monophyletic taxon.
b. an ingroup, with species U as the outgroup.
c. a paraphyletic group.
d. a polyphyletic group.
5. Based on the tree below, which statement is not correct?
7. The relative lengths of the frog and mouse branches in the
phylogenetic tree in Figure 26.13 indicate that
a. frogs evolved before mice.
b. mice evolved before frogs.
c. the homolog has evolved more rapidly in mice.
d. the homolog has evolved more slowly in mice.
566 UNIT FIVE The Evolutionary History of Biological Diversity

More Related Content

What's hot

MBA CERTIFICATE
MBA CERTIFICATEMBA CERTIFICATE
MBA CERTIFICATEarash6613
 
MBA- MARK SHEET 1
MBA- MARK SHEET 1MBA- MARK SHEET 1
MBA- MARK SHEET 1nigusse ali
 
08 Kjm206 Expression Vector, Plasmid Vector
08 Kjm206 Expression Vector, Plasmid Vector08 Kjm206 Expression Vector, Plasmid Vector
08 Kjm206 Expression Vector, Plasmid Vector
Jeneesh Jose
 
An overview:Stem cells
An overview:Stem cells An overview:Stem cells
An overview:Stem cells
Sakshi Sharma
 
Human genetic diversity and origin of major human groups
Human genetic diversity and origin of major human groupsHuman genetic diversity and origin of major human groups
Human genetic diversity and origin of major human groups
Mayank Sagar
 
QUANTITATIVE INHERITANCE - KERNEL COLOR IN WHEAT
QUANTITATIVE INHERITANCE - KERNEL COLOR IN WHEATQUANTITATIVE INHERITANCE - KERNEL COLOR IN WHEAT
QUANTITATIVE INHERITANCE - KERNEL COLOR IN WHEAT
Nethravathi Siri
 
BBA Certificate - Saiyan Islam
BBA Certificate - Saiyan IslamBBA Certificate - Saiyan Islam
BBA Certificate - Saiyan Islam
Saiyan Islam
 
Morphogen gradient
Morphogen gradientMorphogen gradient
Male sterility in plants
Male sterility in plantsMale sterility in plants
Male sterility in plants
arunchacko14
 
Drosophila melanogester
Drosophila melanogesterDrosophila melanogester
Drosophila melanogester
anupisal
 
Cellular communication in multicellular organisms
Cellular communication in multicellular organismsCellular communication in multicellular organisms
Cellular communication in multicellular organisms
Central University of Gujarat, Gandhinagar
 
MBA Certificate
MBA CertificateMBA Certificate
MBA CertificateSujoy I J
 
Advances in plant breeding
Advances in plant breedingAdvances in plant breeding
Advances in plant breeding
SHUATS
 
Induced Pluripotent Stemcells: A P4 Perspective
Induced Pluripotent Stemcells: A P4 PerspectiveInduced Pluripotent Stemcells: A P4 Perspective
Induced Pluripotent Stemcells: A P4 Perspective
The Ohio State University Wexner Medical Center
 
pattern formation genes
pattern formation genespattern formation genes
pattern formation genes
UttamaTungkhang
 
Lethal alleles
Lethal allelesLethal alleles
Lethal alleles
Dr. Samira Fattah
 
Cleavage
CleavageCleavage
Cleavage
Gauri Haval
 

What's hot (20)

MBA CERTIFICATE
MBA CERTIFICATEMBA CERTIFICATE
MBA CERTIFICATE
 
MBA- MARK SHEET 1
MBA- MARK SHEET 1MBA- MARK SHEET 1
MBA- MARK SHEET 1
 
08 Kjm206 Expression Vector, Plasmid Vector
08 Kjm206 Expression Vector, Plasmid Vector08 Kjm206 Expression Vector, Plasmid Vector
08 Kjm206 Expression Vector, Plasmid Vector
 
CERT 2
CERT 2CERT 2
CERT 2
 
An overview:Stem cells
An overview:Stem cells An overview:Stem cells
An overview:Stem cells
 
Human genetic diversity and origin of major human groups
Human genetic diversity and origin of major human groupsHuman genetic diversity and origin of major human groups
Human genetic diversity and origin of major human groups
 
BCA Convocation Certificate
BCA Convocation CertificateBCA Convocation Certificate
BCA Convocation Certificate
 
QUANTITATIVE INHERITANCE - KERNEL COLOR IN WHEAT
QUANTITATIVE INHERITANCE - KERNEL COLOR IN WHEATQUANTITATIVE INHERITANCE - KERNEL COLOR IN WHEAT
QUANTITATIVE INHERITANCE - KERNEL COLOR IN WHEAT
 
BBA Certificate - Saiyan Islam
BBA Certificate - Saiyan IslamBBA Certificate - Saiyan Islam
BBA Certificate - Saiyan Islam
 
Morphogen gradient
Morphogen gradientMorphogen gradient
Morphogen gradient
 
BBA-Certificate
BBA-CertificateBBA-Certificate
BBA-Certificate
 
Male sterility in plants
Male sterility in plantsMale sterility in plants
Male sterility in plants
 
Drosophila melanogester
Drosophila melanogesterDrosophila melanogester
Drosophila melanogester
 
Cellular communication in multicellular organisms
Cellular communication in multicellular organismsCellular communication in multicellular organisms
Cellular communication in multicellular organisms
 
MBA Certificate
MBA CertificateMBA Certificate
MBA Certificate
 
Advances in plant breeding
Advances in plant breedingAdvances in plant breeding
Advances in plant breeding
 
Induced Pluripotent Stemcells: A P4 Perspective
Induced Pluripotent Stemcells: A P4 PerspectiveInduced Pluripotent Stemcells: A P4 Perspective
Induced Pluripotent Stemcells: A P4 Perspective
 
pattern formation genes
pattern formation genespattern formation genes
pattern formation genes
 
Lethal alleles
Lethal allelesLethal alleles
Lethal alleles
 
Cleavage
CleavageCleavage
Cleavage
 

Similar to 26 phylogeny and the tree of life

Classification notes for website
Classification notes for websiteClassification notes for website
Classification notes for websiteAmy Stolipher
 
Biology 1108L – Laboratory Exercises P
Biology 1108L – Laboratory Exercises       PBiology 1108L – Laboratory Exercises       P
Biology 1108L – Laboratory Exercises P
ChantellPantoja184
 
The Family Tree
The Family TreeThe Family Tree
The Family Tree
Geonyzl Alviola
 
Chapter 18 Lecture- Classification
Chapter 18 Lecture- ClassificationChapter 18 Lecture- Classification
Chapter 18 Lecture- Classification
Mary Beth Smith
 
Classification
ClassificationClassification
Classificationilanasaxe
 
Chapter 18.2
Chapter 18.2Chapter 18.2
Chapter 18.2fj560
 
Phylogeny & classification
Phylogeny & classificationPhylogeny & classification
Phylogeny & classification
ilanasaxe
 
Cladistics For Bb
Cladistics For BbCladistics For Bb
Cladistics For Bbguest63b917
 
TAXONOMY-AND-PHYLOGENY-OF-THE-ANIMALS.pdf
TAXONOMY-AND-PHYLOGENY-OF-THE-ANIMALS.pdfTAXONOMY-AND-PHYLOGENY-OF-THE-ANIMALS.pdf
TAXONOMY-AND-PHYLOGENY-OF-THE-ANIMALS.pdf
NeilMarkSumagaysay
 
Chapter 18.1
Chapter 18.1Chapter 18.1
Chapter 18.1fj560
 
Chapter 18.1
Chapter 18.1Chapter 18.1
Chapter 18.1fj560
 
taxonomyppt.ppt
taxonomyppt.ppttaxonomyppt.ppt
taxonomyppt.ppt
aprilrances1
 
Sandel classification
Sandel classificationSandel classification
Sandel classification--
 
KOUSIK_GHOSHPhenetics and Cladistics2020-04-05Phenetics and Cladistics.pptx
KOUSIK_GHOSHPhenetics and Cladistics2020-04-05Phenetics and Cladistics.pptxKOUSIK_GHOSHPhenetics and Cladistics2020-04-05Phenetics and Cladistics.pptx
KOUSIK_GHOSHPhenetics and Cladistics2020-04-05Phenetics and Cladistics.pptx
PriyankaChakraborty95
 
Classification
ClassificationClassification
ClassificationJolie Yu
 
Classification: Aims and principles
Classification: Aims and principlesClassification: Aims and principles
Classification: Aims and principles
Ubaid MaLik
 
Classification of animalm kknolnolmomos.pptx
Classification of animalm kknolnolmomos.pptxClassification of animalm kknolnolmomos.pptx
Classification of animalm kknolnolmomos.pptx
Amanda783100
 
Diversity in living organisms
Diversity in living organismsDiversity in living organisms
Diversity in living organisms
Rohitsatyaanand
 

Similar to 26 phylogeny and the tree of life (20)

Classification notes for website
Classification notes for websiteClassification notes for website
Classification notes for website
 
Biology 1108L – Laboratory Exercises P
Biology 1108L – Laboratory Exercises       PBiology 1108L – Laboratory Exercises       P
Biology 1108L – Laboratory Exercises P
 
The Family Tree
The Family TreeThe Family Tree
The Family Tree
 
Chapter 18 Lecture- Classification
Chapter 18 Lecture- ClassificationChapter 18 Lecture- Classification
Chapter 18 Lecture- Classification
 
Classification
ClassificationClassification
Classification
 
Taxonomy ppt
Taxonomy pptTaxonomy ppt
Taxonomy ppt
 
Chapter 18.2
Chapter 18.2Chapter 18.2
Chapter 18.2
 
Phylogeny & classification
Phylogeny & classificationPhylogeny & classification
Phylogeny & classification
 
Cladistics For Bb
Cladistics For BbCladistics For Bb
Cladistics For Bb
 
TAXONOMY-AND-PHYLOGENY-OF-THE-ANIMALS.pdf
TAXONOMY-AND-PHYLOGENY-OF-THE-ANIMALS.pdfTAXONOMY-AND-PHYLOGENY-OF-THE-ANIMALS.pdf
TAXONOMY-AND-PHYLOGENY-OF-THE-ANIMALS.pdf
 
Chapter 18.1
Chapter 18.1Chapter 18.1
Chapter 18.1
 
Chapter 18.1
Chapter 18.1Chapter 18.1
Chapter 18.1
 
taxonomyppt.ppt
taxonomyppt.ppttaxonomyppt.ppt
taxonomyppt.ppt
 
Sandel classification
Sandel classificationSandel classification
Sandel classification
 
KOUSIK_GHOSHPhenetics and Cladistics2020-04-05Phenetics and Cladistics.pptx
KOUSIK_GHOSHPhenetics and Cladistics2020-04-05Phenetics and Cladistics.pptxKOUSIK_GHOSHPhenetics and Cladistics2020-04-05Phenetics and Cladistics.pptx
KOUSIK_GHOSHPhenetics and Cladistics2020-04-05Phenetics and Cladistics.pptx
 
Classification
ClassificationClassification
Classification
 
Classification: Aims and principles
Classification: Aims and principlesClassification: Aims and principles
Classification: Aims and principles
 
Classification of animalm kknolnolmomos.pptx
Classification of animalm kknolnolmomos.pptxClassification of animalm kknolnolmomos.pptx
Classification of animalm kknolnolmomos.pptx
 
Diversity in living organisms
Diversity in living organismsDiversity in living organisms
Diversity in living organisms
 
Ecology boa
Ecology boaEcology boa
Ecology boa
 

More from Renee Ariesen

49 nervous systems
49   nervous systems49   nervous systems
49 nervous systems
Renee Ariesen
 
48 neurons, synapses, and signaling
48   neurons, synapses, and signaling48   neurons, synapses, and signaling
48 neurons, synapses, and signaling
Renee Ariesen
 
46 animal reproduction
46   animal reproduction46   animal reproduction
46 animal reproduction
Renee Ariesen
 
45 hormones and the endocrine system
45   hormones and the endocrine system45   hormones and the endocrine system
45 hormones and the endocrine system
Renee Ariesen
 
41 animal nutrition
41   animal nutrition41   animal nutrition
41 animal nutrition
Renee Ariesen
 
32 an overview of animal diversity
32   an overview of animal diversity32   an overview of animal diversity
32 an overview of animal diversity
Renee Ariesen
 
30 plant diversity ii-the evolution of seed plants
30   plant diversity ii-the evolution of seed plants30   plant diversity ii-the evolution of seed plants
30 plant diversity ii-the evolution of seed plants
Renee Ariesen
 
29 plant diversity I, how plants colonized land
29   plant diversity I, how plants colonized land29   plant diversity I, how plants colonized land
29 plant diversity I, how plants colonized land
Renee Ariesen
 
21 genomes and their evolution
21   genomes and their evolution21   genomes and their evolution
21 genomes and their evolution
Renee Ariesen
 
13 meiosis and sexual life cycles
13   meiosis and sexual life cycles13   meiosis and sexual life cycles
13 meiosis and sexual life cycles
Renee Ariesen
 
12 the cell cycle
12   the cell cycle12   the cell cycle
12 the cell cycle
Renee Ariesen
 

More from Renee Ariesen (11)

49 nervous systems
49   nervous systems49   nervous systems
49 nervous systems
 
48 neurons, synapses, and signaling
48   neurons, synapses, and signaling48   neurons, synapses, and signaling
48 neurons, synapses, and signaling
 
46 animal reproduction
46   animal reproduction46   animal reproduction
46 animal reproduction
 
45 hormones and the endocrine system
45   hormones and the endocrine system45   hormones and the endocrine system
45 hormones and the endocrine system
 
41 animal nutrition
41   animal nutrition41   animal nutrition
41 animal nutrition
 
32 an overview of animal diversity
32   an overview of animal diversity32   an overview of animal diversity
32 an overview of animal diversity
 
30 plant diversity ii-the evolution of seed plants
30   plant diversity ii-the evolution of seed plants30   plant diversity ii-the evolution of seed plants
30 plant diversity ii-the evolution of seed plants
 
29 plant diversity I, how plants colonized land
29   plant diversity I, how plants colonized land29   plant diversity I, how plants colonized land
29 plant diversity I, how plants colonized land
 
21 genomes and their evolution
21   genomes and their evolution21   genomes and their evolution
21 genomes and their evolution
 
13 meiosis and sexual life cycles
13   meiosis and sexual life cycles13   meiosis and sexual life cycles
13 meiosis and sexual life cycles
 
12 the cell cycle
12   the cell cycle12   the cell cycle
12 the cell cycle
 

Recently uploaded

2024.06.01 Introducing a competency framework for languag learning materials ...
2024.06.01 Introducing a competency framework for languag learning materials ...2024.06.01 Introducing a competency framework for languag learning materials ...
2024.06.01 Introducing a competency framework for languag learning materials ...
Sandy Millin
 
TESDA TM1 REVIEWER FOR NATIONAL ASSESSMENT WRITTEN AND ORAL QUESTIONS WITH A...
TESDA TM1 REVIEWER  FOR NATIONAL ASSESSMENT WRITTEN AND ORAL QUESTIONS WITH A...TESDA TM1 REVIEWER  FOR NATIONAL ASSESSMENT WRITTEN AND ORAL QUESTIONS WITH A...
TESDA TM1 REVIEWER FOR NATIONAL ASSESSMENT WRITTEN AND ORAL QUESTIONS WITH A...
EugeneSaldivar
 
The Challenger.pdf DNHS Official Publication
The Challenger.pdf DNHS Official PublicationThe Challenger.pdf DNHS Official Publication
The Challenger.pdf DNHS Official Publication
Delapenabediema
 
Synthetic Fiber Construction in lab .pptx
Synthetic Fiber Construction in lab .pptxSynthetic Fiber Construction in lab .pptx
Synthetic Fiber Construction in lab .pptx
Pavel ( NSTU)
 
Honest Reviews of Tim Han LMA Course Program.pptx
Honest Reviews of Tim Han LMA Course Program.pptxHonest Reviews of Tim Han LMA Course Program.pptx
Honest Reviews of Tim Han LMA Course Program.pptx
timhan337
 
Overview on Edible Vaccine: Pros & Cons with Mechanism
Overview on Edible Vaccine: Pros & Cons with MechanismOverview on Edible Vaccine: Pros & Cons with Mechanism
Overview on Edible Vaccine: Pros & Cons with Mechanism
DeeptiGupta154
 
Acetabularia Information For Class 9 .docx
Acetabularia Information For Class 9  .docxAcetabularia Information For Class 9  .docx
Acetabularia Information For Class 9 .docx
vaibhavrinwa19
 
Sha'Carri Richardson Presentation 202345
Sha'Carri Richardson Presentation 202345Sha'Carri Richardson Presentation 202345
Sha'Carri Richardson Presentation 202345
beazzy04
 
The geography of Taylor Swift - some ideas
The geography of Taylor Swift - some ideasThe geography of Taylor Swift - some ideas
The geography of Taylor Swift - some ideas
GeoBlogs
 
Palestine last event orientationfvgnh .pptx
Palestine last event orientationfvgnh .pptxPalestine last event orientationfvgnh .pptx
Palestine last event orientationfvgnh .pptx
RaedMohamed3
 
Introduction to AI for Nonprofits with Tapp Network
Introduction to AI for Nonprofits with Tapp NetworkIntroduction to AI for Nonprofits with Tapp Network
Introduction to AI for Nonprofits with Tapp Network
TechSoup
 
"Protectable subject matters, Protection in biotechnology, Protection of othe...
"Protectable subject matters, Protection in biotechnology, Protection of othe..."Protectable subject matters, Protection in biotechnology, Protection of othe...
"Protectable subject matters, Protection in biotechnology, Protection of othe...
SACHIN R KONDAGURI
 
Polish students' mobility in the Czech Republic
Polish students' mobility in the Czech RepublicPolish students' mobility in the Czech Republic
Polish students' mobility in the Czech Republic
Anna Sz.
 
Instructions for Submissions thorugh G- Classroom.pptx
Instructions for Submissions thorugh G- Classroom.pptxInstructions for Submissions thorugh G- Classroom.pptx
Instructions for Submissions thorugh G- Classroom.pptx
Jheel Barad
 
Unit 2- Research Aptitude (UGC NET Paper I).pdf
Unit 2- Research Aptitude (UGC NET Paper I).pdfUnit 2- Research Aptitude (UGC NET Paper I).pdf
Unit 2- Research Aptitude (UGC NET Paper I).pdf
Thiyagu K
 
The Accursed House by Émile Gaboriau.pptx
The Accursed House by Émile Gaboriau.pptxThe Accursed House by Émile Gaboriau.pptx
The Accursed House by Émile Gaboriau.pptx
DhatriParmar
 
The French Revolution Class 9 Study Material pdf free download
The French Revolution Class 9 Study Material pdf free downloadThe French Revolution Class 9 Study Material pdf free download
The French Revolution Class 9 Study Material pdf free download
Vivekanand Anglo Vedic Academy
 
678020731-Sumas-y-Restas-Para-Colorear.pdf
678020731-Sumas-y-Restas-Para-Colorear.pdf678020731-Sumas-y-Restas-Para-Colorear.pdf
678020731-Sumas-y-Restas-Para-Colorear.pdf
CarlosHernanMontoyab2
 
CLASS 11 CBSE B.St Project AIDS TO TRADE - INSURANCE
CLASS 11 CBSE B.St Project AIDS TO TRADE - INSURANCECLASS 11 CBSE B.St Project AIDS TO TRADE - INSURANCE
CLASS 11 CBSE B.St Project AIDS TO TRADE - INSURANCE
BhavyaRajput3
 
BÀI TẬP BỔ TRỢ TIẾNG ANH GLOBAL SUCCESS LỚP 3 - CẢ NĂM (CÓ FILE NGHE VÀ ĐÁP Á...
BÀI TẬP BỔ TRỢ TIẾNG ANH GLOBAL SUCCESS LỚP 3 - CẢ NĂM (CÓ FILE NGHE VÀ ĐÁP Á...BÀI TẬP BỔ TRỢ TIẾNG ANH GLOBAL SUCCESS LỚP 3 - CẢ NĂM (CÓ FILE NGHE VÀ ĐÁP Á...
BÀI TẬP BỔ TRỢ TIẾNG ANH GLOBAL SUCCESS LỚP 3 - CẢ NĂM (CÓ FILE NGHE VÀ ĐÁP Á...
Nguyen Thanh Tu Collection
 

Recently uploaded (20)

2024.06.01 Introducing a competency framework for languag learning materials ...
2024.06.01 Introducing a competency framework for languag learning materials ...2024.06.01 Introducing a competency framework for languag learning materials ...
2024.06.01 Introducing a competency framework for languag learning materials ...
 
TESDA TM1 REVIEWER FOR NATIONAL ASSESSMENT WRITTEN AND ORAL QUESTIONS WITH A...
TESDA TM1 REVIEWER  FOR NATIONAL ASSESSMENT WRITTEN AND ORAL QUESTIONS WITH A...TESDA TM1 REVIEWER  FOR NATIONAL ASSESSMENT WRITTEN AND ORAL QUESTIONS WITH A...
TESDA TM1 REVIEWER FOR NATIONAL ASSESSMENT WRITTEN AND ORAL QUESTIONS WITH A...
 
The Challenger.pdf DNHS Official Publication
The Challenger.pdf DNHS Official PublicationThe Challenger.pdf DNHS Official Publication
The Challenger.pdf DNHS Official Publication
 
Synthetic Fiber Construction in lab .pptx
Synthetic Fiber Construction in lab .pptxSynthetic Fiber Construction in lab .pptx
Synthetic Fiber Construction in lab .pptx
 
Honest Reviews of Tim Han LMA Course Program.pptx
Honest Reviews of Tim Han LMA Course Program.pptxHonest Reviews of Tim Han LMA Course Program.pptx
Honest Reviews of Tim Han LMA Course Program.pptx
 
Overview on Edible Vaccine: Pros & Cons with Mechanism
Overview on Edible Vaccine: Pros & Cons with MechanismOverview on Edible Vaccine: Pros & Cons with Mechanism
Overview on Edible Vaccine: Pros & Cons with Mechanism
 
Acetabularia Information For Class 9 .docx
Acetabularia Information For Class 9  .docxAcetabularia Information For Class 9  .docx
Acetabularia Information For Class 9 .docx
 
Sha'Carri Richardson Presentation 202345
Sha'Carri Richardson Presentation 202345Sha'Carri Richardson Presentation 202345
Sha'Carri Richardson Presentation 202345
 
The geography of Taylor Swift - some ideas
The geography of Taylor Swift - some ideasThe geography of Taylor Swift - some ideas
The geography of Taylor Swift - some ideas
 
Palestine last event orientationfvgnh .pptx
Palestine last event orientationfvgnh .pptxPalestine last event orientationfvgnh .pptx
Palestine last event orientationfvgnh .pptx
 
Introduction to AI for Nonprofits with Tapp Network
Introduction to AI for Nonprofits with Tapp NetworkIntroduction to AI for Nonprofits with Tapp Network
Introduction to AI for Nonprofits with Tapp Network
 
"Protectable subject matters, Protection in biotechnology, Protection of othe...
"Protectable subject matters, Protection in biotechnology, Protection of othe..."Protectable subject matters, Protection in biotechnology, Protection of othe...
"Protectable subject matters, Protection in biotechnology, Protection of othe...
 
Polish students' mobility in the Czech Republic
Polish students' mobility in the Czech RepublicPolish students' mobility in the Czech Republic
Polish students' mobility in the Czech Republic
 
Instructions for Submissions thorugh G- Classroom.pptx
Instructions for Submissions thorugh G- Classroom.pptxInstructions for Submissions thorugh G- Classroom.pptx
Instructions for Submissions thorugh G- Classroom.pptx
 
Unit 2- Research Aptitude (UGC NET Paper I).pdf
Unit 2- Research Aptitude (UGC NET Paper I).pdfUnit 2- Research Aptitude (UGC NET Paper I).pdf
Unit 2- Research Aptitude (UGC NET Paper I).pdf
 
The Accursed House by Émile Gaboriau.pptx
The Accursed House by Émile Gaboriau.pptxThe Accursed House by Émile Gaboriau.pptx
The Accursed House by Émile Gaboriau.pptx
 
The French Revolution Class 9 Study Material pdf free download
The French Revolution Class 9 Study Material pdf free downloadThe French Revolution Class 9 Study Material pdf free download
The French Revolution Class 9 Study Material pdf free download
 
678020731-Sumas-y-Restas-Para-Colorear.pdf
678020731-Sumas-y-Restas-Para-Colorear.pdf678020731-Sumas-y-Restas-Para-Colorear.pdf
678020731-Sumas-y-Restas-Para-Colorear.pdf
 
CLASS 11 CBSE B.St Project AIDS TO TRADE - INSURANCE
CLASS 11 CBSE B.St Project AIDS TO TRADE - INSURANCECLASS 11 CBSE B.St Project AIDS TO TRADE - INSURANCE
CLASS 11 CBSE B.St Project AIDS TO TRADE - INSURANCE
 
BÀI TẬP BỔ TRỢ TIẾNG ANH GLOBAL SUCCESS LỚP 3 - CẢ NĂM (CÓ FILE NGHE VÀ ĐÁP Á...
BÀI TẬP BỔ TRỢ TIẾNG ANH GLOBAL SUCCESS LỚP 3 - CẢ NĂM (CÓ FILE NGHE VÀ ĐÁP Á...BÀI TẬP BỔ TRỢ TIẾNG ANH GLOBAL SUCCESS LỚP 3 - CẢ NĂM (CÓ FILE NGHE VÀ ĐÁP Á...
BÀI TẬP BỔ TRỢ TIẾNG ANH GLOBAL SUCCESS LỚP 3 - CẢ NĂM (CÓ FILE NGHE VÀ ĐÁP Á...
 

26 phylogeny and the tree of life

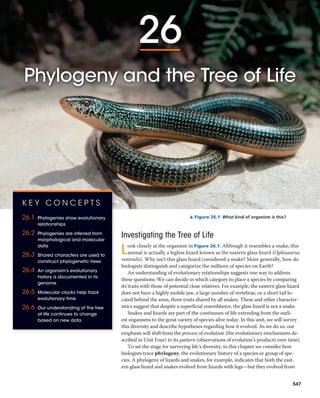
  • 1. 547 ▲ Figure 26.1 What kind of organism is this? Investigating the Tree of Life Look closely at the organism in Figure 26.1. Although it resembles a snake, this animal is actually a legless lizard known as the eastern glass lizard (Ophisaurus ventralis). Why isn’t this glass lizard considered a snake? More generally, how do biologists distinguish and categorize the millions of species on Earth? An understanding of evolutionary relationships suggests one way to address these questions: We can decide in which category to place a species by comparing its traits with those of potential close relatives. For example, the eastern glass lizard does not have a highly mobile jaw, a large number of vertebrae, or a short tail lo- cated behind the anus, three traits shared by all snakes. These and other character- istics suggest that despite a superficial resemblance, the glass lizard is not a snake. Snakes and lizards are part of the continuum of life extending from the earli- est organisms to the great variety of species alive today. In this unit, we will survey this diversity and describe hypotheses regarding how it evolved. As we do so, our emphasis will shift from the process of evolution (the evolutionary mechanisms de- scribed in Unit Four) to its pattern (observations of evolution’s products over time). To set the stage for surveying life’s diversity, in this chapter we consider how biologists trace phylogeny, the evolutionary history of a species or group of spe- cies. A phylogeny of lizards and snakes, for example, indicates that both the east- ern glass lizard and snakes evolved from lizards with legs—but they evolved from K E Y C O N C E P T S 26.1 Phylogenies show evolutionary relationships 26.2 Phylogenies are inferred from morphological and molecular data 26.3 Shared characters are used to construct phylogenetic trees 26.4 An organism’s evolutionary history is documented in its genome 26.5 Molecular clocks help track evolutionary time 26.6 Our understanding of the tree of life continues to change based on new data 26 Phylogeny and the Tree of Life
  • 2. 548 UNIT FIVE The Evolutionary History of Biological Diversity different lineages of legged lizards (Figure 26.2). Thus, it appears that their legless conditions evolved independently. As we’ll see, biologists reconstruct and interpret phylogenies like that in Figure 26.2 using systematics, a discipline focused on classifying organisms and determining their evolutionary relationships. C O N C E P T 26.1 Phylogenies show evolutionary relationships Organisms share many characteristics because of common ancestry (see Chapter 22). As a result, we can learn a great deal about a species if we know its evolutionary history. For example, an organism is likely to share many of its genes, metabolic pathways, and structural proteins with its close relatives. We’ll consider practical applications of such infor- mation later in this section, but first we’ll examine how or- ganisms are named and classified, the scientific discipline of taxonomy. We’ll also look at how we can interpret and use diagrams that represent evolutionary history. Binomial Nomenclature Common names for organisms—such as monkey, finch, and lilac—convey meaning in casual usage, but they can also cause confusion. Each of these names, for example, refers to more than one species. Moreover, some common names do not accurately reflect the kind of organism they signify. Consider these three “fishes”: jellyfish (a cnidarian), crayfish (a small lobsterlike crustacean), and silverfish (an insect). And of course, a given organism has different names in dif- ferent languages. To avoid ambiguity when communicating about their research, biologists refer to organisms by Latin scien- tific names. The two-part format of the scientific name, commonly called a binomial, was instituted in the 18th century by Carolus Linnaeus (see Chapter 22). The first part of a binomial is the name of the genus (plural, genera) to which the species belongs. The second part, called the specific epithet, is unique for each species within the genus. An example of a binomial is Panthera pardus, the scientific name for the large cat commonly called the leopard. Notice that the first letter of the genus is capitalized and the entire binomial is italicized. (Newly created scientific names are also “latinized”: You can name an insect you discover after a friend, but you must add a Latin ending.) Many of the more than 11,000 binomials assigned by Linnaeus are still used today, including the optimistic name he gave our own species—Homo sapiens, meaning “wise man.” Hierarchical Classification In addition to naming species, Linnaeus also grouped them into a hierarchy of increasingly inclusive categories. The first grouping is built into the binomial: Species that appear to be closely related are grouped into the same genus. For exam- ple, the leopard (Panthera pardus) belongs to a genus that also includes the African lion (Panthera leo), the tiger (Pan- thera tigris), and the jaguar (Panthera onca). Beyond genera, taxonomists employ progressively more comprehensive categories of classification. The taxonomic system named after Linnaeus, the Linnaean system, places related genera in the same family, families into orders, orders into classes, classes into phyla (singular, phylum), phyla into kingdoms, and, more recently, kingdoms into domains (Figure 26.3). The resulting biological classification of a particular organ- ism is somewhat like a postal address identifying a person in a particular apartment, in a building with many apartments, on a street with many apartment buildings, in a city with many streets, and so on. The named taxonomic unit at any level of the hierarchy is called a taxon (plural, taxa). In the leopard example, Pan- thera is a taxon at the genus level, and Mammalia is a taxon at the class level that includes all the many orders of mam- mals. Note that in the Linnaean system, taxa broader than the genus are not italicized, though they are capitalized. Classifying species is a way to structure our human view of the world. We lump together various species of trees to which we give the common name of pines and distinguish them from other trees that we call firs. Taxonomists have decided that pines and firs are different enough to be placed in separate genera, yet similar enough to be grouped into the same family, Pinaceae. As with pines and firs, higher levels of classification are usually defined by particular characters chosen by taxonomists. However, characters that are useful for classifying one group of organisms may not be appropri- ate for other organisms. For this reason, the larger catego- ries often are not comparable between lineages; that is, an Geckos Snakes Iguanas Monitor lizard Eastern glass lizard ANCESTRAL LIZARD (with limbs) No limbs No limbs ▲ Figure 26.2 Convergent evolution of limbless bodies. A phylogeny based on DNA sequence data reveals that a legless body form evolved independently from legged ancestors in the lineages leading to the eastern glass lizard and to snakes.
  • 3. C HAPTER 26 Phylogeny and the Tree of Life 549 order of snails does not exhibit the same degree of morpho- logical or genetic diversity as an order of mammals. Fur- thermore, as we’ll see, the placement of species into orders, classes, and so on, does not necessarily reflect evolutionary history. Linking Classification and Phylogeny The evolutionary history of a group of organisms can be represented in a branching diagram called a phylogenetic tree. As in Figure 26.4, the branching pattern often matches how taxonomists have classified groups of organisms nested within more inclusive groups. Sometimes, however, taxono- mists have placed a species within a genus (or other group) to which it is not most closely related. One reason for such a mistake might be that over the course of evolution, a spe- cies has lost a key feature shared by its close relatives. If DNA or other new evidence indicates that an organism has been misclassified, the organism may be reclassified to ac- curately reflect its evolutionary history. Another issue is that while the Linnaean system may distinguish groups, such as amphibians, mammals, reptiles, and other classes of verte- brates, it tells us nothing about these groups’ evolutionary relationships to one another. Such difficulties in aligning Linnaean classification with phylogeny have led some systematists to propose that clas- sification be based entirely on evolutionary relationships. In such systems, names are only assigned to groups that include a common ancestor and all of its descendants. As a consequence of this approach, some commonly recognized groups would become part of other groups previously at the same level of the Linnaean system. For example, because birds evolved from a group of reptiles, Aves (the Linnaean class to which birds are assigned) would be considered a subgroup of Reptilia (also a class in the Linnaean system). Regardless of how groups are named, a phylogenetic tree represents a hypothesis about evolutionary relation- ships. These relationships often are depicted as a series of dichotomies, or two-way branch points. Each branch point Domain: Eukarya Domain: Bacteria Domain: Archaea Kingdom: Animalia Phylum: Chordata Class: Mammalia Order: Carnivora Family: Felidae Genus: Panthera Species: Panthera pardus ▲ Figure 26.3 Linnaean classification. At each level, or “rank,” species are placed in groups within more inclusive groups. SpeciesGenusFamilyOrder Panthera pardus (leopard) Taxidea taxus (American badger) Lutra lutra (European otter) Canis latrans (coyote) Canis lupus (gray wolf) 1 2 Carnivora FelidaeMustelidaeCanidae PantheraTaxideaLutraCanis ▲ Figure 26.4 The connection between classification and phylogeny. Hierarchical classification can reflect the branching pat- terns of phylogenetic trees. This tree traces possible evolutionary relationships between some of the taxa within order Carnivora, itself a branch of class Mammalia. The branch point 1 represents the most recent common ancestor of all members of the weasel (Mustelidae) and dog (Canidae) families. The branch point 2 represents the most recent common ancestor of coyotes and gray wolves. ? What does this phylogenetic tree indicate about the evolutionary re- lationships between the leopard, badger, and wolf?
  • 4. 550 UNIT FIVE The Evolutionary History of Biological Diversity represents the divergence of two evolutionary lineages from a common ancestor. In Figure 26.5, for example, branch point 3 represents the common ancestor of taxa A, B, and C. The position of branch point 4 to the right of 3 indicates that taxa B and C diverged after their shared lin- eage split from the lineage leading to taxon A. Note also that tree branches can be rotated around a branch point without changing their evolutionary relationships. In Figure 26.5, taxa B and C are sister taxa, groups of or- ganisms that share an immediate common ancestor (branch point 4 ) and hence are each other’s closest relatives. In ad- dition, this tree, like most of the phylogenetic trees in this book, is rooted, which means that a branch point within the tree (often drawn farthest to the left) represents the most recent common ancestor of all taxa in the tree. The term basal taxon refers to a lineage that diverges early in the his- tory of a group and hence, like taxon G in Figure 26.5, lies on a branch that originates near the common ancestor of the group. Finally, the lineage leading to taxa D–F includes a polytomy, a branch point from which more than two descendant groups emerge. A polytomy signifies that evolu- tionary relationships among the taxa are not yet clear. What We Can and Cannot Learn from Phylogenetic Trees Let’s summarize three key points about phylogenetic trees. First, they are intended to show patterns of descent, not phenotypic similarity. Although closely related organisms often resemble one another due to their common ances- try, they may not if their lineages have evolved at different rates or faced very different environmental conditions. For example, even though crocodiles are more closely related to birds than to lizards (see Figure 22.17), they look more like lizards because morphology has changed dramatically in the bird lineage. Second, the sequence of branching in a tree does not nec- essarily indicate the actual (absolute) ages of the particular species. For example, the tree in Figure 26.4 does not indi- cate that the wolf evolved more recently than the European otter; rather, the tree shows only that the most recent com- mon ancestor of the wolf and otter (branch point 1 ) lived before the most recent common ancestor of the wolf and coyote ( 2 ). To indicate when wolves and otters evolved, the tree would need to include additional divergences in each evolutionary lineage, as well as the dates when those splits occurred. Generally, unless given specific informa- tion about what the branch lengths in a phylogenetic tree mean—for example, that they are proportional to time—we should interpret the diagram solely in terms of patterns of descent. No assumptions should be made about when par- ticular species evolved or how much change occurred in each lineage. Third, we should not assume that a taxon on a phylo- genetic tree evolved from the taxon next to it. Figure 26.4 does not indicate that wolves evolved from coyotes or vice versa. We can infer only that the lineage leading to wolves and the lineage leading to coyotes both evolved from the common ancestor 2 . That ancestor, which is now extinct, was neither a wolf nor a coyote. However, its descendants include the two extant (living) species shown here, wolves and coyotes. Applying Phylogenies Understanding phylogeny can have practical applications. Consider maize (corn), which originated in the Americas and is now an important food crop worldwide. From a phylogeny of maize based on DNA data, researchers have been able to identify two species of wild grasses that may be maize’s closest living relatives. These two close relatives may be useful as “reservoirs” of beneficial alleles that can be transferred to cultivated maize by cross-breeding or genetic engineering (see Chapter 20). A different use of phylogenetic trees is to infer species identities by analyzing the relatedness of DNA sequences from different organisms. Researchers have used this ap- proach to investigate whether “whale meat” had been harvested illegally from whale species protected under inter- national law rather than from species that can be harvested legally (Figure 26.6). How do researchers construct trees like those we’ve considered here? In the next section, we’ll begin to answer that question by examining the data used to determine phylogenies. Taxon A ANCESTRAL LINEAGE Taxon B Sister taxa Basal taxon Taxon C Taxon D Taxon E Taxon F Taxon G This branch point forms a polytomy: an unresolved pattern of divergence. Branch point: where lineages diverge This branch point represents the common ancestor of taxa A–G. 3 5 4 2 1 ▲ Figure 26.5 How to read a phylogenetic tree. D R AW I T Redraw this tree, rotating the branches around branch points 2 and 4 . Does your new version tell a different story about the evolutionary relationships between the taxa? Explain.
  • 5. C HAPTER 26 Phylogeny and the Tree of Life 551 3. W H AT I F ? Suppose new evidence indicates that taxon E in Figure 26.5 is the sister taxon of a group con- sisting of taxa D and F. Redraw the tree accordingly. For suggested answers, see Appendix A. Minke (Southern Hemisphere) Minke (North Atlantic) Humpback Blue Fin Unknown #9 Unknown #1b Unknowns #10, 11, 12, 13 Unknowns #1a, 2, 3, 4, 5, 6, 7, 8 © 1994 AAAS Inquiry What is the species identity of food being sold as whale meat? ▼ Figure 26.6 Experiment C. S. Baker and S. R. Palumbi purchased 13 samples of “whale meat” from Japanese fish markets. They sequenced part of the mitochondrial DNA (mtDNA) from each sample and compared their results with the comparable mtDNA sequence from known whale species. To infer the species identity of each sample, the team constructed a gene tree, a phylogenetic tree that shows patterns of relatedness among DNA sequences rather than among taxa. Results Of the species in the resulting gene tree, only Minke whales caught in the Southern Hemisphere can be sold legally in Japan. Conclusion This analysis indicated that mtDNA sequences of six of the unknown samples (in red) were most closely related to mtDNA sequences of whales that are not legal to harvest. Source: C. S. Baker and S. R. Palumbi, Which whales are hunted? A molecular genetic approach to monitoring whaling, Science 265:1538–1539 (1994). Reprinted with permission from AAAS. W H AT I F ? What different results would have indicated that the whale meat had not been harvested illegally? C O N C E P T C H E C K 2 6 . 1 1. Which levels of the classification in Figure 26.3 do hu- mans share with leopards? 2. Which of the trees shown here depicts an evolutionary history different from the other two? Explain. A (a) B C D B (b) D C A D (c) C B A C O N C E P T 26.2 Phylogenies are inferred from morphological and molecular data To infer phylogeny, systematists must gather as much infor- mation as possible about the morphology, genes, and bio- chemistry of the relevant organisms. It is important to focus on features that result from common ancestry, because only such features reflect evolutionary relationships. Morphological and Molecular Homologies Recall that phenotypic and genetic similarities due to shared ancestry are called homologies. For example, the similarity in the number and arrangement of bones in the forelimbs of mammals is due to their descent from a common ancestor with the same bone structure; this is an example of a mor- phological homology (see Figure 22.15). In the same way, genes or other DNA sequences are homologous if they are descended from sequences carried by a common ancestor. In general, organisms that share very similar morpholo- gies or similar DNA sequences are likely to be more closely related than organisms with vastly different structures or sequences. In some cases, however, the morphological diver- gence between related species can be great and their genetic divergence small (or vice versa). Consider the Hawaiian silver- sword plants: some of these species are tall, twiggy trees, while others are dense, ground-hugging shrubs (see Figure 25.22). But despite these striking phenotypic differences, the silver- swords’ genes are very similar. Based on these small molecular divergences, scientists estimate that the silversword group began to diverge 5 million years ago. We’ll discuss how sci- entists use molecular data to estimate such divergence times later in this chapter. Sorting Homology from Analogy A potential source of confusion in constructing a phylogeny is similarity between organisms that is due to convergent evolution—called analogy— rather than to shared ancestry (homology). Convergent evo- lution occurs when similar environmental pressures and natural selection produce simi- lar (analogous) adaptations in organisms from different evo- lutionary lineages. For example, the two mole-like animals shown in Figure 26.7 Australian marsupial “mole” North American eutherian mole ▲ Figure 26.7 Convergent evolution in burrowers. A long body, large front paws, small eyes, and a pad of thick skin that pro- tects the nose all evolved indepen- dently in these species.
  • 6. 552 UNIT FIVE The Evolutionary History of Biological Diversity look very similar. However, their internal anatomy, physiol- ogy, and reproductive systems are very dissimilar. Indeed, genetic and fossil evidence indicate that the common ances- tor of these moles lived 140 million years ago. This common ancestor and most of its descendents were not mole-like, but analogous characteristics evolved independently in these two mole lineages as they became adapted to similar lifestyles. Distinguishing between homology and analogy is criti- cal in reconstructing phylogenies. To see why, consider bats and birds, both of which have adaptations that enable flight. This superficial resemblance might imply that bats are more closely related to birds than they are to cats, which cannot fly. But a closer examination reveals that a bat’s wing is more similar to the forelimbs of cats and other mammals than to a bird’s wing. Bats and birds descended from a common tet- rapod ancestor that lived about 320 million years ago. This common ancestor could not fly. Thus, although the underly- ing skeletal systems of bats and birds are homologous, their wings are not. Flight is enabled in different ways—stretched membranes in the bat wing versus feathers in the bird wing. Fossil evidence also documents that bat wings and bird wings arose independently from the forelimbs of different tetrapod ancestors. Thus, with respect to flight, a bat’s wing is analo- gous, not homologous, to a bird’s wing. Analogous structures that arose independently are also called homoplasies (from the Greek, meaning “to mold in the same way”). Besides corroborative similarities and fossil evidence, an- other clue to distinguishing between homology and analogy is the complexity of the characters being compared. The more elements that are similar in two complex structures, the more likely it is that they evolved from a common ancestor. For in- stance, the skulls of an adult human and an adult chimpanzee both consist of many bones fused together. The compositions of the skulls match almost perfectly, bone for bone. It is highly improbable that such complex structures, matching in so many details, have separate origins. More likely, the genes in- volved in the development of both skulls were inherited from a common ancestor. The same argument applies to compari- sons at the gene level. Genes are sequences of thousands of nucleotides, each of which represents an inherited character in the form of one of the four DNA bases: A (adenine), G (guanine), C (cytosine), or T (thymine). If genes in two or- ganisms share many portions of their nucleotide sequences, it is likely that the genes are homologous. Evaluating Molecular Homologies Comparing DNA molecules often poses technical chal- lenges for researchers. The first step after sequencing the molecules is to align comparable sequences from the spe- cies being studied. If the species are very closely related, the sequences probably differ at only one or a few sites. In con- trast, comparable nucleic acid sequences in distantly related species usually have different bases at many sites and may have different lengths. This is because insertions and dele- tions accumulate over long periods of time. Suppose, for example, that certain noncoding DNA sequences near a particular gene are very similar in two species, except that the first base of the sequence has been deleted in one of the species. The effect is that the remain- ing sequence shifts back one notch. A comparison of the two sequences that does not take this deletion into account would overlook what in fact is a very good match. To ad- dress such problems, researchers have developed computer programs that estimate the best way to align comparable DNA segments of differing lengths (Figure 26.8). Such molecular comparisons reveal that many base substi- tutions and other differences have accumulated in the com- parable genes of an Australian mole and a North American mole. The many differences indicate that their lineages have diverged greatly since their common ancestor; thus, we say that the living species are not closely related. In contrast, the high degree of gene sequence similarity among the silver- sword plants indicates that they are all very closely related, in spite of their considerable morphological differences. Just as with morphological characters, it is necessary to distinguish homology from analogy in evaluating molecular similarities for evolutionary studies. Two sequences that C C A T C A G A G T C C C C A T C A G A G T C C 1 2 C Deletion Insertion C A T C A G A G T C C C C A T G T A C A G A G T C C 1 2 C C A T C A A G T C C C C A T G T A C A G A G T C C 1 2 C C A T C A A G T C C C C A T G T A C A G A G T C C 1 2 These homologous DNA sequences are identical as species 1 and species 2 begin to diverge from their common ancestor. 1 Deletion and insertion mutations shift what had been matching sequences in the two species. 2 Of the regions of the species 2 sequence that match the species 1 sequence, those shaded orange no longer align because of these mutations. 3 The matching regions realign after a computer program adds gaps in sequence 1. 4 ▲ Figure 26.8 Aligning segments of DNA. Systematists search for similar sequences along DNA segments from two species (only one DNA strand is shown for each species). In this example, 11 of the original 12 bases have not changed since the species diverged. Hence, those portions of the sequences still align once the length is adjusted.
  • 7. C HAPTER 26 Phylogeny and the Tree of Life 553 C O N C E P T C H E C K 2 6 . 2 1. Decide whether each of the following pairs of structures more likely represents analogy or homology, and explain your reasoning: (a) a porcupine’s quills and a cactus’s spines; (b) a cat’s paw and a human’s hand; (c) an owl’s wing and a hornet’s wing. 2. W H AT I F ? Suppose that two species,A and B, have similar appearances but very divergent gene sequences, while species B and C have very different appearances but similar gene sequences.Which pair of species is more likely to be closely related: A and B or B and C? Explain. For suggested answers, see Appendix A. C O N C E P T 26.3 Shared characters are used to construct phylogenetic trees As we’ve discussed, a key step in reconstructing phylogenies is to distinguish homologous features from analogous ones (since only homology reflects evolutionary history). We must also choose a method of inferring phylogeny from these homologous characters. A widely used set of methods is known as cladistics. Cladistics In the approach to systematics called cladistics, common ancestry is the primary criterion used to classify organisms. Using this methodology, biologists attempt to place species into groups called clades, each of which includes an ances- tral species and all of its descendants (Figure 26.10a). Clades, like taxonomic categories of the Linnaean system, are nested within larger clades. In Figure 26.4, for example, the cat group (Felidae) represents a clade within a larger clade (Carnivora) that also includes the dog group (Canidae). However, a taxon is equivalent to a clade only if it is monophyletic (from the Greek, meaning “single tribe”), signifying that it consists of an ancestral species and all of its descendants (see Figure 26.10a). Contrast this with a paraphyletic (“beside the tribe”) group, which consists of an ancestral species and some, but not all, of its descendants (Figure 26.10b), or a polyphyletic (“many tribes”) group, which includes distantly related species but does not include their most recent common ancestor (Figure 26.10c). ▼ Figure 26.10 Monophyletic, paraphyletic, and polyphyletic groups. 1 2 3 1 2 3 (a) Monophyletic group (clade) (b) Paraphyletic group (c) Polyphyletic group Group I, consisting of three species (A, B, C) and their common ancestor , is a monophyletic group (clade), meaning that it consists of an ancestral species and all of its descendants. Group III, consisting of four species (A, B, C, D), is polyphyletic, meaning that the common ancestor of its members is not part of the group. A C Group I D E F G B A C Group II D E F G B A C D E F G B Group III Group II is paraphyletic, meaning that it consists of an ancestral species and some of its descendants (species D, E, F) but not all of them (missing species G). resemble each other at many points along their length most likely are homologous (see Figure 26.8). But in organisms that do not appear to be closely related, the bases that their otherwise very different sequences happen to share may sim- ply be coincidental matches, called molecular homoplasies. For example, if the two DNA sequences in Figure 26.9 were from distantly related organisms, the fact that they share 23% of their bases would be coincidental. Statistical tools have been developed to determine whether DNA sequences that share more than 25% of their bases do so because they are homologous. A C G G A T A G T C C A C T A G G C A C T A T C A C C G A C A G G T C T T T G A C T A G ▲ Figure 26.9 A molecular homoplasy.
  • 8. 554 UNIT FIVE The Evolutionary History of Biological Diversity Note that in a paraphyletic group, the most recent com- mon ancestor of all members of the group is part of the group, whereas in a polyphyletic group the most recent common ancestor is not part of the group. For example, a group consisting of even-toed ungulates (hippopotamuses, deer, and their relatives) and their common ancestor is paraphyletic because it includes the common ancestor but excludes cetaceans (whales, dolphins, and porpoises), which descended from that ancestor (Figure 26.11). In contrast, a group consisting of seals and cetaceans (based on their similar body forms) would be polyphyletic because it does not include the common ancestor of seals and cetaceans. Biologists avoid defining such polyphyletic groups; if new evidence indicates that an existing group is polyphyletic, organisms in that group are reclassified. Shared Ancestral and Shared Derived Characters As a result of descent with modification, organisms have characteristics they share with their ancestors, and they also have characteristics that differ from those of their ancestors. For example, all mammals have backbones, but a backbone does not distinguish mammals from other vertebrates be- cause all vertebrates have backbones. The backbone pre- dates the branching of mammals from other vertebrates. Thus for mammals, the backbone is a shared ancestral character, a character that originated in an ancestor of the taxon. In contrast, hair is a character shared by all mammals but not found in their ancestors. Thus, in mammals, hair is considered a shared derived character, an evolutionary novelty unique to a clade. Other even-toed ungulates Hippopotamuses Cetaceans Bears Other carnivores Seals Common ancestor of even-toed ungulates This group is paraphyletic because it does not include all the descendants of the common ancestor (it excludes cetaceans). This group is polyphyletic because it does not include the most recent common ancestor of its members. ▲ Figure 26.11 Examples of a paraphyletic and a polyphyletic group. ? Circle the branch point that represents the most recent common ancestor of cetaceans and seals. Explain why that ancestor would not be part of a cetacean–seal group defined by their similar body forms. 0Hair TAXA Amnion CHARACTERS Lancelet (outgroup) Lamprey Bass Frog Turtle Leopard Four walking legs Hinged jaws 0 0 0 0 1 0 0 0 0 1 1 0 0 0 1 1 1 0 0 1 1 1 1 Vertebral column (backbone) 0 1 1 1 1 1 (a) (b)Character table. A 0 indicates that a character is absent; a 1 indicates that a character is present. Lancelet (outgroup) Lamprey Bass Frog Turtle Leopard Phylogenetic tree. Analyzing the distribution of these derived characters can provide insight into vertebrate phylogeny. Vertebral column Hinged jaws Four walking legs Amnion Hair ▲ Figure 26.12 Constructing a phylogenetic tree. The characters used here include the amnion, a membrane that encloses the embryo inside a fluid-filled sac (see Figure 34.25). D R AW I T In (b), circle the most inclusive clade for which a hinged jaw is a shared ancestral character.
  • 9. C HAPTER 26 Phylogeny and the Tree of Life 555 Note that it is a relative matter whether a character is considered ancestral or derived. A backbone can also qualify as a shared derived character, but only at a deeper branch point that distinguishes all vertebrates from other animals. Inferring Phylogenies Using Derived Characters Shared derived characters are unique to particular clades. Because all features of organisms arose at some point in the history of life, it should be possible to determine the clade in which each shared derived character first appeared and to use that information to infer evolutionary relationships. To see how this analysis is done, consider the set of char- acters shown in Figure 26.12a for each of five vertebrates— a leopard, turtle, frog, bass, and lamprey (a jawless aquatic vertebrate). As a basis of comparison, we need to select an outgroup. An outgroup is a species or group of species from an evolutionary lineage that is known to have diverged before the lineage that includes the species we are studying (the ingroup). A suitable outgroup can be determined based on evidence from morphology, paleontology, embryonic development, and gene sequences. An appropriate outgroup for our example is the lancelet, a small animal that lives in mudflats and (like vertebrates) is a member of the more in- clusive group called the chordates. Unlike the vertebrates, however, the lancelet does not have a backbone. By comparing members of the ingroup with each other and with the outgroup, we can determine which characters were derived at the various branch points of vertebrate evolution. For example, all of the vertebrates in the ingroup have back- bones: This character was present in the ancestral vertebrate, but not in the outgroup. Now note that hinged jaws are a character absent in lampreys but present in other members of the ingroup; this character helps us to identify an early branch point in the vertebrate clade. Proceeding in this way, we can translate the data in our table of characters into a phylogenetic tree that groups all the ingroup taxa into a hierarchy based on their shared derived characters (Figure 26.12b). Phylogenetic Trees with Proportional Branch Lengths In the phylogenetic trees we have presented so far, the lengths of the tree’s branches do not indicate the degree of evolutionary change in each lineage. Furthermore, the chro- nology represented by the branching pattern of the tree is relative (earlier versus later) rather than absolute (how many millions of years ago). But in some tree diagrams, branch lengths are proportional to amount of evolutionary change or to the times at which particular events occurred. In Figure 26.13, for example, the branch length of the phylogenetic tree reflects the number of changes that have taken place in a particular DNA sequence in that lineage. Note that the total length of the horizontal lines from the base of the tree to the mouse is less than that of the line lead- ing to the outgroup species, the fruit fly Drosophila. This im- plies that in the time since the mouse and fly diverged from a common ancestor, more genetic changes have occurred in the Drosophila lineage than in the mouse lineage. Even though the branches of a phylogenetic tree may have different lengths, among organisms alive today, all the different lineages that descend from a common ances- tor have survived for the same number of years. To take an extreme example, humans and bacteria had a common ancestor that lived over 3 billion years ago. Fossils and ge- netic evidence indicate that this ancestor was a single-celled prokaryote. Even though bacteria have apparently changed Drosophila Lancelet Zebrafish Frog Chicken Human Mouse ▲ Figure 26.13 Branch lengths can represent genetic change. This tree was constructed by comparing sequences of homologs of a gene that plays a role in development; Drosophila was used as an outgroup. The branch lengths are proportional to the amount of genetic change in each lineage; varying branch lengths indicate that the gene has evolved at different rates in different lineages. I N T E R P R E T T H E DATA In which vertebrate lineage has the studied gene evolved most rapidly? Explain.
  • 10. 556 UNIT FIVE The Evolutionary History of Biological Diversity According to the principle of maximum parsimony, we should first investigate the simplest explanation that is consistent with the facts. (The parsimony principle is also called “Occam’s razor” after William of Occam, a 14th- century English philosopher who advocated this minimalist problem-solving approach of “shaving away” unnecessary complications.) In the case of trees based on morphology, the most parsimonious tree requires the fewest evolutionary events, as measured by the origin of shared derived morpho- logical characters. For phylogenies based on DNA, the most parsimonious tree requires the fewest base changes. A maximum likelihood approach identifies the tree most likely to have produced a given set of DNA data, based on certain probability rules about how DNA sequences change over time. For example, the underlying probability rules could be based on the assumption that all nucleotide substi- tutions are equally likely. However, if evidence suggests that this assumption is not correct, more complex rules could be devised to account for different rates of change among dif- ferent nucleotides or at different positions in a gene. Scientists have developed many computer programs to search for trees that are parsimonious and likely. When a large amount of accurate data is available, the methods used in these programs usually yield similar trees. As an example of one method, Figure 26.15 walks you through the process of identifying the most parsimonious molecular tree for a little in their morphology since that common ancestor, there have nonetheless been 3 billion years of evolution in the bacterial lineage, just as there have been 3 billion years of evolution in the lineage that ultimately gave rise to humans. These equal spans of chronological time can be repre- sented in a phylogenetic tree whose branch lengths are pro- portional to time (Figure 26.14). Such a tree draws on fossil data to place branch points in the context of geologic time. Additionally, it is possible to combine these two types of trees by labeling branch points with information about rates of genetic change or dates of divergence. Maximum Parsimony and Maximum Likelihood As the database of DNA sequences that enables us to study more species grows, the difficulty of building the phyloge- netic tree that best describes their evolutionary history also grows. What if you are analyzing data for 50 species? There are 3 * 1076 different ways to arrange 50 species into a tree! And which tree in this huge forest reflects the true phy- logeny? Systematists can never be sure of finding the most accurate tree in such a large data set, but they can narrow the possibilities by applying the principles of maximum par- simony and maximum likelihood. 542 251 Millions of years ago PALEOZOIC MESOZOIC CENOZOIC 65.5 Present Drosophila Lancelet Zebrafish Frog Chicken Human Mouse ▲ Figure 26.14 Branch lengths can indicate time. This tree is based on the same molecular data as the tree in Figure 26.13, but here the branch points are mapped to dates based on fossil evidence. Thus, the branch lengths are proportional to time. Each lineage has the same total length from the base of the tree to the branch tip, indicating that all the lineages have diverged from the common ancestor for equal amounts of time.
  • 11. C HAPTER 26 Phylogeny and the Tree of Life 557 Research Method▼ Figure 26.15 Application In considering possible phylogenies for a group of species, sys- tematists compare molecular data for the species. An efficient way to begin is by identifying the most parsimonious hypothesis—the one that requires the fewest evolutionary events (molecular changes) to have occurred. Applying Parsimony to a Problem in Molecular Systematics 1/C 1/C 1/C 1/C 1/C 3/A 2/T 4/C 3/A 4/C 2/T 3/A 4/C 2/T 4/C 3/A 4/C 2/T 2/T 3/A 7 events6 events 7 events Species I Three phylogenetic hypotheses: Site 1 2 3 4 CSpecies I T A T CSpecies II T T C ASpecies III Ancestral sequence G A C A G T T I II III I III II III II I I II III I III II III II I I II III I III II I III II I II III I III II III II I Species II Species III Technique Follow the numbered steps as we apply the principle of parsimony to a hypothetical phylogenetic problem involving three closely related bird species. 1 First, draw the three possible phylogenies for the species. (Al- though only 3 trees are possible when ordering 3 species, the number of possible trees increases rapidly with the number of spe- cies: There are 15 trees for 4 species and 34,459,425 trees for 10 species.) 2 Tabulate the molecular data for the species. In this simplified ex- ample, the data represent a DNA sequence consisting of just four nucleotide bases. Data from several outgroup species (not shown) were used to infer the ancestral DNA sequence. 3 Now focus on site 1 in the DNA sequence. In the tree on the left, a single base-change event, represented by the purple hatchmark on the branch leading to species I and II (and labeled 1/C, indicat- ing a change at site 1 to nucleotide C), is sufficient to account for the site 1 data. In the other two trees, two base-change events are necessary. 4 Continuing the comparison of bases at sites 2, 3, and 4 reveals that each of the three trees requires a total of five additional base- change events (purple hatchmarks). Results To identify the most parsimonious tree, we total all of the base-change events noted in steps 3 and 4. We conclude that the first tree is the most parsimonious of the three possible phylogenies. (In a real example, many more sites would be analyzed. Hence, the trees would often differ by more than one base-change event.)
  • 12. 558 UNIT FIVE The Evolutionary History of Biological Diversity crocodiles cover their eggs with their neck. Reasoning that any feature shared by birds and crocodiles is likely to have been present in their common ancestor (denoted by the blue dot in Figure 26.16) and all of its descendants, biologists predicted that dinosaurs had four-chambered hearts, sang, built nests, and exhibited brooding. Internal organs, such as the heart, rarely fossilize, and it is, of course, difficult to test whether dinosaurs sang to defend territories and attract mates. However, fossilized dinosaur eggs and nests have provided evidence support- ing the prediction of brooding in dinosaurs. First, a fossil embryo of an Oviraptor dinosaur was found, still inside its egg. This egg was identical to those found in another fos- sil, one that showed an Oviraptor crouching over a group of eggs in a posture similar to that seen in brooding birds today (Figure 26.17). Researchers suggested that the Ovi- raptor dinosaur preserved in this second fossil died while incubating or protecting its eggs. The broader conclusion that emerged from this work—that dinosaurs built nests and exhibited brooding—has since been strengthened by additional fossil discoveries that show that other species of dinosaurs built nests and sat on their eggs. Finally, by supporting predictions based on the phylogenetic hypoth- esis shown in Figure 26.16, fossil discoveries of nests and brooding in dinosaurs provide independent data that suggest that the hypothesis is correct. three-species problem. Computer programs use the prin- ciple of parsimony to estimate phylogenies in a similar way: They examine large numbers of possible trees and identify those that require the fewest evolutionary changes. Phylogenetic Trees as Hypotheses This is a good place to reiterate that any phylogenetic tree represents a hypothesis about how the organisms in the tree are related to one another. The best hypothesis is the one that best fits all the available data. A phylogenetic hypothesis may be modified when new evidence compels systematists to revise their trees. Indeed, while many older phylogenetic hypotheses have been supported by new morphological and molecular data, others have been changed or rejected. Thinking of phylogenies as hypotheses also allows us to use them in a powerful way: We can make and test predic- tions based on the assumption that a particular phylogeny— our hypothesis—is correct. For example, in an approach known as phylogenetic bracketing, we can predict (by parsi- mony) that features shared by two groups of closely related organisms are present in their common ancestor and all of its descendants unless independent data indicate otherwise. (Note that “prediction” can refer to unknown past events as well as to evolutionary changes yet to occur.) This approach has been used to make novel predictions about dinosaurs. For example, there is evidence that birds descended from the theropods, a group of bipedal sauris- chian dinosaurs. As seen in Figure 26.16, the closest living relatives of birds are crocodiles. Birds and crocodiles share numerous features: They have four-chambered hearts, they “sing” to defend territories and attract mates (although a crocodile’s “song” is more like a bellow), and they build nests. Both birds and crocodiles also care for their eggs by brooding, a behavior in which a parent warms the eggs with its body. Birds brood by sitting on their eggs, whereas Lizards and snakes Crocodilians Ornithischian dinosaurs Saurischian dinosaurs Common ancestor of crocodilians, dinosaurs, and birds Birds ▲ Figure 26.16 A phylogenetic tree of birds and their close relatives. ? What is the most basal taxon represented in this tree? Front limb Hind limb (a) Eggs Fossil remains of Oviraptor and eggs. The orientation of the bones, which surround and cover the eggs, suggests that the dinosaur died while incubating or protect- ing its eggs. (b) Artist’s reconstruction of the dinosaur’s posture based on the fossil findings. ▲ Figure 26.17 Fossil support for a phylogenetic prediction: Dinosaurs built nests and brooded their eggs.
  • 13. C HAPTER 26 Phylogeny and the Tree of Life 559 C O N C E P T C H E C K 2 6 . 3 1. To distinguish a particular clade of mammals within the larger clade that corresponds to class Mammalia, would hair be a useful character? Why or why not? 2. The most parsimonious tree of evolutionary relationships can be inaccurate. How can this occur? 3. W H AT I F ? Draw a phylogenetic tree that includes the relationships from Figure 25.7 and Figure 26.16.Tradition- ally, all the taxa shown besides birds and mammals were classified as reptiles. Would a cladistic approach support that classification? Explain. For suggested answers, see Appendix A. C O N C E P T 26.4 An organism’s evolutionary history is documented in its genome As you have seen in this chapter, molecular systematics— using comparisons of nucleic acids or other molecules to deduce relatedness—can reveal phylogenetic relationships that cannot be determined by nonmolecular methods such as comparative anatomy. For example, molecular systemat- ics helps us uncover evolutionary relationships between groups that have little common ground for morphologi- cal comparison, such as animals and fungi. And molecular methods allow us to reconstruct phylogenies among groups of present-day organisms for which the fossil record is poor or lacking entirely. Different genes can evolve at different rates, even in the same evolutionary lineage. As a result, molecular trees can represent short or long periods of time, depending on which Ancestral gene Ancestral gene Species CAncestral species Speciation with divergence of gene Gene duplication and divergence Paralogous genesOrthologous genes Species A Species C after many generationsSpecies B (a) Formation of orthologous genes: a product of speciation (b) Formation of paralogous genes: within a species ▼ Figure 26.18 Two types of homologous genes. Colored bands mark regions of the genes where differences in base sequences have accumulated. genes are used. For example, the DNA that codes for ribo- somal RNA (rRNA) changes relatively slowly. Therefore, comparisons of DNA sequences in these genes are useful for investigating relationships between taxa that diverged hun- dreds of millions of years ago. Studies of rRNA sequences indicate, for instance, that fungi are more closely related to animals than to plants. In contrast, mitochondrial DNA (mtDNA) evolves relatively rapidly and can be used to ex- plore recent evolutionary events. One research team has traced the relationships among Native American groups through their mtDNA sequences. The molecular find- ings corroborate other evidence that the Pima of Arizona, the Maya of Mexico, and the Yanomami of Venezuela are closely related, probably descending from the first of three waves of immigrants that crossed the Bering Land Bridge from Asia to the Americas about 15,000 years ago. Gene Duplications and Gene Families What do molecular data reveal about the evolutionary his- tory of genome change? Consider gene duplication, which plays a particularly important role in evolution because it in- creases the number of genes in the genome, providing more opportunities for further evolutionary changes. Molecular techniques now allow us to trace the phylogenies of gene duplications. These molecular phylogenies must account for repeated duplications that have resulted in gene families, groups of related genes within an organism’s genome (see Figure 21.11). Accounting for such duplications leads us to distinguish two types of homologous genes (Figure 26.18): orthologous genes and paralogous genes. In orthologous genes (from the Greek orthos, exact), the homology is the result of a
  • 14. 560 UNIT FIVE The Evolutionary History of Biological Diversity speciation event and hence occurs between genes found in different species (see Figure 26.18a). For example, the genes that code for cytochrome c (a protein that functions in elec- tron transport chains) in humans and dogs are orthologous. In paralogous genes (from the Greek para, in parallel), the homology results from gene duplication; hence, multiple copies of these genes have diverged from one another within a species (see Figure 26.18b). In Chapter 23, you encoun- tered the example of olfactory receptor genes, which have undergone many gene duplications in vertebrates; humans have 350 of these paralogous genes, while mice have 1,000. Note that orthologous genes can only diverge after spe- ciation has taken place, that is, after the genes are found in separate gene pools. For example, although the cyto- chrome c genes in humans and dogs serve the same func- tion, the gene’s sequence in humans has diverged from that in dogs in the time since these species last shared a com- mon ancestor. Paralogous genes, on the other hand, can diverge within a species because they are present in more than one copy in the genome. The paralogous genes that make up the olfactory receptor gene family in humans have diverged from each other during our long evolutionary his- tory. They now specify proteins that confer sensitivity to a wide variety of molecules, ranging from food odors to sex pheromones. Genome Evolution Now that we can compare the entire genomes of different organisms, including our own, two patterns have emerged. First, lineages that diverged long ago often share many orthologous genes. For example, though the human and mouse lineages diverged about 65 million years ago, 99% of the genes of humans and mice are orthologous. And 50% of human genes are orthologous with those of yeast, despite 1 billion years of divergent evolution. Such commonalities explain why disparate organisms nevertheless share many biochemical and developmental pathways. As a result of these shared pathways, the functioning of genes linked to diseases in humans can often be investigated by studying yeast and other organisms distantly related to humans. Second, the number of genes a species has doesn’t seem to increase through duplication at the same rate as per- ceived phenotypic complexity. Humans have only about four times as many genes as yeast, a single-celled eukaryote, even though—unlike yeast—we have a large, complex brain and a body with more than 200 different types of tissues. Evidence is emerging that many human genes are more ver- satile than those of yeast: A single human gene can encode multiple proteins that perform different tasks in various body tissues. Unraveling the mechanisms that cause this genomic versatility and phenotypic variation is an exciting challenge. C O N C E P T C H E C K 2 6 . 4 1. Explain how comparing proteins of two species can yield data about the species’ evolutionary relationship. 2. W H AT I F ? Suppose gene A is orthologous in species 1 and species 2, and gene B is paralogous to gene A in species 1. Suggest a sequence of two evolutionary events that could result in the following: Gene A differs considerably between species, yet gene A and gene B show little divergence from each other. 3. M A K E C O N N E C T I O N S Review Figure 18.13; then sug- gest how a particular gene could have different func- tions in different tissues within an organism. For suggested answers, see Appendix A. C O N C E P T 26.5 Molecular clocks help track evolutionary time One goal of evolutionary biology is to understand the rela- tionships among all organisms, including those for which there is no fossil record. However, if we attempt to deter- mine the timing of phylogenies that extend beyond the fos- sil record, we must rely on an important assumption about how change occurs at the molecular level. Molecular Clocks We stated earlier that researchers have estimated that the common ancestor of Hawaiian silversword plants lived about 5 million years ago. How did they make this esti- mate? They relied on the concept of a molecular clock, an approach for measuring the absolute time of evolution- ary change based on the observation that some genes and other regions of genomes appear to evolve at constant rates. An assumption underlying the molecular clock is that the number of nucleotide substitutions in orthologous genes is proportional to the time that has elapsed since the genes branched from their common ancestor (divergence time). In the case of paralogous genes, the number of substitu- tions is proportional to the time since the ancestral gene was duplicated. We can calibrate the molecular clock of a gene that has a reliable average rate of evolution by graphing the number of genetic differences—for example, nucleotide, codon, or amino acid differences—against the dates of evolutionary branch points that are known from the fossil record (Figure 26.19). The average rates of genetic change inferred from such graphs can then be used to estimate the dates of events that cannot be discerned from the fossil re- cord, such as the origin of the silverswords discussed earlier. Of course, no gene marks time with complete precision. In fact, some portions of the genome appear to have evolved
  • 15. C HAPTER 26 Phylogeny and the Tree of Life 561 others. Indeed, evidence suggests that almost half the ami- no acid differences in proteins of two Drosophila species, D. simulans and D. yakuba, are not neutral but have resulted from natural selection. But because the direction of natural selection may change repeatedly over long periods of time (and hence may average out), some genes experiencing se- lection can nevertheless serve as approximate markers of elapsed time. Another question arises when researchers attempt to ex- tend molecular clocks beyond the time span documented by the fossil record. Although some fossils are more than 3 bil- lion years old, these are very rare. An abundant fossil record extends back only about 550 million years, but molecular clocks have been used to date evolutionary divergences that occurred a billion or more years ago. These estimates as- sume that the clocks have been constant for all that time. Such estimates are highly uncertain. In some cases, problems may be avoided by calibrat- ing molecular clocks with data on the rates at which genes have evolved in different taxa. In other cases, problems may be avoided by using many genes rather than the common approach of using just one or a few genes. By using many genes, fluctuations in evolutionary rate due to natural selec- tion or other factors that vary over time may average out. For example, one group of researchers constructed molecu- lar clocks of vertebrate evolution from published sequence data for 658 nuclear genes. Despite the broad period of time covered (nearly 600 million years) and the fact that natural selection probably affected some of these genes, their esti- mates of divergence times agreed closely with fossil-based estimates. As this example suggests, if used with care, mol- ecular clocks can aid our understanding of evolutionary relationships. Applying a Molecular Clock: Dating the Origin of HIV Researchers have used a molecular clock to date the origin of HIV infection in humans. Phylogenetic analysis shows that HIV, the virus that causes AIDS, is descended from vi- ruses that infect chimpanzees and other primates. (Most of these viruses do not cause AIDS-like diseases in their native hosts.) When did HIV jump to humans? There is no simple answer, because the virus has spread to humans more than once. The multiple origins of HIV are reflected in the variety of strains (genetic types) of the virus. HIV’s genetic mate- rial is made of RNA, and like other RNA viruses, it evolves quickly. The most widespread strain in humans is HIV-1 M. To pinpoint the earliest HIV-1 M infection, researchers com- pared samples of the virus from various times during the ep- idemic, including a sample from 1959. A comparison of gene sequences showed that the virus has evolved in a clocklike in irregular bursts that are not at all clocklike. And even those genes that seem to act as reliable molecular clocks are accurate only in the statistical sense of showing a fairly smooth average rate of change. Over time, there may still be deviations from that average rate. Furthermore, the same gene may evolve at different rates in different groups of or- ganisms. Finally, when comparing genes that are clocklike, the rate of the clock may vary greatly from one gene to an- other; some genes evolve a million times faster than others. Differences in Clock Speed What causes such differences in the speed at which clock- like genes evolve? The answer stems from the fact that some mutations are selectively neutral—neither beneficial nor detrimental. Of course, many new mutations are harmful and are removed quickly by selection. But if most of the rest are neutral and have little or no effect on fitness, then the rate of evolution of those neutral mutations should indeed be regular, like a clock. Differences in the clock rate for different genes are a function of how important a gene is. If the exact sequence of amino acids that a gene specifies is essential to survival, most of the mutational changes will be harmful and only a few will be neutral. As a result, such genes change only slowly. But if the exact sequence of amino acids is less criti- cal, fewer of the new mutations will be harmful and more will be neutral. Such genes change more quickly. Potential Problems with Molecular Clocks In fact, molecular clocks do not run as smoothly as would be expected if the underlying mutations were selectively neu- tral. Many irregularities are likely to be the result of natural selection in which certain DNA changes are favored over Numberofmutations Divergence time (millions of years) 0 30 60 90 120 90 60 30 0 ▲ Figure 26.19 A molecular clock for mammals. The number of accumulated mutations in seven proteins has increased over time in a consistent manner for most mammal species. The three green data points represent primate species, whose proteins appear to have evolved more slowly than those of other mammals. The divergence time for each data point was based on fossil evidence. I N T E R P R E T T H E DATA Use the graph to estimate the divergence time for a mammal with a total of 30 mutations in the seven proteins.
  • 16. 562 UNIT FIVE The Evolutionary History of Biological Diversity fashion (Figure 26.20). Extrapolating backward in time using the molecular clock indicates that the HIV-1 M strain first spread to humans around 1930. A later study, which dated the origin of HIV using a more advanced molecular clock approach than that covered in this book, estimated that the HIV-1 M strain first spread to humans around 1910. 0.20 IndexofbasechangesbetweenHIVgenesequences 0.15 0.10 Range HIV 0.05 0 1920 1940 1960 1980 20001900 Year Adjusted best-fit line (accounts for uncertain dates of HIV sequences) © 2000 AAAS ▲ Figure 26.20 Dating the origin of HIV-1 M. The black data points are based on DNA sequences of an HIV gene in patients’ blood samples. (The dates when these individual HIV gene sequences arose are not certain because a person can harbor the virus for years before symptoms occur.) Projecting the gene’s rate of change backward in time suggests that the virus originated in the 1930s. C O N C E P T C H E C K 2 6 . 5 1. What is a molecular clock? What assumption underlies the use of a molecular clock? 2. M A K E C O N N E C T I O N S Review Concept 17.5.Then explain how numerous base changes could occur in an organism’s DNA yet have no effect on its fitness. 3. W H AT I F ? Suppose a molecular clock dates the diver- gence of two taxa at 80 million years ago, but new fossil evidence shows that the taxa diverged at least 120 mil- lion years ago. Explain how this could happen. For suggested answers, see Appendix A. C O N C E P T 26.6 Our understanding of the tree of life continues to change based on new data The discovery that the glass lizard in Figure 26.1 evolved from a different lineage of legless lizards than did snakes is one example of how our understanding of life’s diversity is informed by systematics. Indeed, in recent decades, sys- tematists have gained insight into even the very deepest branches of the tree of life by analyzing DNA sequence data. From Two Kingdoms to Three Domains Taxonomists once classified all known species into two kingdoms: plants and animals. Classification schemes with more than two kingdoms gained broad acceptance in the late 1960s, when many biologists recognized five kingdoms: Monera (prokaryotes), Protista (a diverse kingdom consist- ing mostly of unicellular organisms), Plantae, Fungi, and Animalia. This system highlighted the two fundamentally different types of cells, prokaryotic and eukaryotic, and set the prokaryotes apart from all eukaryotes by placing them in their own kingdom, Monera. However, phylogenies based on genetic data soon began to reveal a problem with this system: Some prokaryotes differ as much from each other as they do from eukaryotes. Such dif- ficulties have led biologists to adopt a three-domain system. The three domains—Bacteria, Archaea, and Eukarya—are a taxonomic level higher than the kingdom level. The validity of these domains is supported by many studies, including a recent study that analyzed nearly 100 completely sequenced genomes. The domain Bacteria contains most of the currently known prokaryotes, while the domain Archaea consists of a diverse group of prokaryotic organisms that inhabit a wide variety of environments. The domain Eukarya consists of all the organisms that have cells containing true nuclei. This domain includes many groups of single-celled organisms as well as multicellular plants, fungi, and animals. Figure 26.21 represents one possible phylogenetic tree for the three do- mains and some of the many lineages they encompass. The three-domain system highlights the fact that much of the history of life has been about single-celled organisms. The two prokaryotic domains consist entirely of single- celled organisms, and even in Eukarya, only the branches labeled in blue type (land plants, fungi, and animals) are dominated by multicellular organisms. Of the five king- doms previously recognized by taxonomists, most biologists continue to recognize Plantae, Fungi, and Animalia, but not Monera and Protista. The kingdom Monera is obsolete because it would have members in two different domains. The kingdom Protista has also crumbled because it includes members that are more closely related to plants, fungi, or animals than to other protists (see Chapter 28). The Important Role of Horizontal Gene Transfer In the phylogeny shown in Figure 26.21, the first major split in the history of life occurred when bacteria diverged from
  • 17. C HAPTER 26 Phylogeny and the Tree of Life 563 Forams Euglenozoans Diatoms Ciliates Red algae Green algae Land plants Amoebas Fungi Animals Nanoarchaeotes Methanogens Thermophiles Proteobacteria (Mitochondria)* Chlamydias Spirochetes Gram-positive bacteria Cyanobacteria (Chloroplasts)* COMMON ANCESTOR OF ALL LIFE DomainBacteriaDomainEukaryaDomain Archaea ▲ Figure 26.21 The three domains of life. This phylogenetic tree is based on sequence data for rRNA and other genes. For simplicity, only some of the major branches in each domain are shown. Lineages within Eukarya that are dominated by multicellular organisms (land plants, fungi, and animals) are in blue type, while the two lineages denoted by an asterisk are based on DNA from cellular organelles. All other lineages consist solely or mainly of single-celled organisms. M A K E C O N N E C T I O N S After reviewing endosymbiont theory (see Figure 6.16), explain the specific positions of the mitochondrion and chlo- roplast lineages on this tree. What causes trees based on data from different genes to yield such different results? Comparisons of complete genomes from the three domains show that there have been substantial movements of genes between organisms in the different domains. These took place through horizontal gene transfer, a process in which genes are transferred from one genome to another through mechanisms such as exchange of transposable elements and plasmids, viral in- fection (see Chapter 19), and perhaps fusions of organisms (as when a host and its endosymbiont become a single or- ganism). Recent research reinforces the view that horizon- tal gene transfer is important. For example, a 2008 analysis indicated that, on average, 80% of the genes in 181 prokary- otic genomes had moved between species at some point during the course of evolution. Because phylogenetic trees are based on the assumption that genes are passed vertically from one generation to the next, the occurrence of such horizontal transfer events helps to explain why trees built using different genes can give inconsistent results. Horizontal gene transfer can also occur between eukary- otes. For example, over 200 cases of the horizontal transfer of transposons have been reported in eukaryotes, including humans and other primates, plants, birds, and the gecko shown in Figure 26.22. Nuclear genes have also been trans- ferred horizontally from one eukaryote to another. The Scientific Skills Exercise describes one such example, giv- ing you the opportunity to interpret data on the transfer of a pigment gene to an aphid from another species. Overall, horizontal gene transfer has played a key role throughout the evolutionary history of life and it continues to occur today. Some biologists have argued that horizontal gene transfer was so common that the early history of life should be represented not as a dichotomously branching tree like that in Figure 26.21, but rather as a tangled network other organisms. If this tree is correct, eukaryotes and ar- chaea are more closely related to each other than either is to bacteria. This reconstruction of the tree of life is based in part on sequence comparisons of rRNA genes, which code for the RNA components of ribosomes. However, some other genes reveal a different set of relationships. For example, research- ers have found that many of the genes that influence meta- bolism in yeast (a unicellular eukaryote) are more similar to genes in the domain Bacteria than they are to genes in the domain Archaea—a finding that suggests that the eukaryotes may share a more recent common ancestor with bacteria than with archaea. ▼ Figure 26.22 A recipient of transferred genes: the Mediterranean house gecko (Hemidactylus turcicus). Recent genetic evidence indicates that this gecko is one of 17 reptile species that acquired the transposon SPIN as a result of horizontal gene transfer. The transpo- son may have been transferred from one species to another by the feeding activities of blood-sucking insects.
  • 18. 564 UNIT FIVE The Evolutionary History of Biological Diversity of connected branches (Figure 26.23). Although scientists continue to debate whether early steps in the history of life are best represented as a tree or a tangled web, in recent de- cades there have been many exciting discoveries about evo- lutionary events that occurred over time. We’ll explore such discoveries in the rest of this unit’s chapters, beginning with Earth’s earliest inhabitants, the prokaryotes. DomainBacteriaDomainEukaryaDomain Archaea Cyanobacteria Proteobacteria Fungi Plantae Animalia Chloroplasts Mitochondria Ancestral cell populations Thermophiles Methanogens © 1999 AAAS ▶ Figure 26.23 A tangled web of life. Horizontal gene transfer may have been so common in the early history of life that the base of a “tree of life” might be more accurately portrayed as a tangled web. C O N C E P T C H E C K 2 6 . 6 1. Why is the kingdom Monera no longer considered a valid taxon? 2. Explain why phylogenies based on different genes can yield different branching patterns for the tree of all life. 3. W H AT I F ? Draw the three possible dichotomously branching trees showing evolutionary relationships for the domains Bacteria,Archaea, and Eukarya.Two of these trees have been supported by genetic data. Is it likely that the third tree might also receive such support? Explain your answer. For suggested answers, see Appendix A. S C I E N T I F I C S K I L L S E X E R C I S E Did Aphids Acquire Their Ability to Make Carotenoids Through Horizontal Gene Transfer? Carotenoids are colored molecules that have diverse functions in many organisms, such as photosynthesis in plants and light detection in animals. Plants and many microorganisms can synthesize carotenoids from scratch, but animals generally cannot (they must obtain carotenoids from their diet). One exception is the pea aphid Acyrthosiphon pisum, a small plant-dwelling insect whose genome includes a full set of genes for the enzymes needed to make carotenoids. Because other animals lack these genes, it is unlikely that aphids inherited them from a single-celled common ancestor shared with microorganisms and plants. So where did they come from? Evo- lutionary biologists hypothesize that an aphid ancestor acquired these genes by horizontal gene transfer from distantly related organisms. How the Experiment Was Done Scientists obtained the DNA se- quences for the carotenoid-biosynthesis genes from several species, including aphids, fungi, bacteria, and plants. A computer “translated” these sequences into amino acid sequences of the encoded polypeptides and aligned the amino acid sequences. This allowed the team to com- pare the corresponding polypeptides in the different organisms. Data from the Experiment The sequences below show the first 60 amino acids of one polypeptide of the carotenoid-biosynthesis enzymes in the plant Arabidopsis thaliana (bottom) and the corresponding amino acids in five nonplant species, using the one-letter abbreviations for the amino acids (see Figure 5.14). A hyphen (-) indicates that a species lacks Using Protein Sequence Data to Test an Evolutionary Hypothesis Organism Alignment of Amino Acid Sequences Acyrthosiphon (aphid) Ustilago (fungus) Gibberella (fungus) Staphylococcus (bacterium) Pantoea (bacterium) Arabidopsis (plant) a particular amino acid found in the Arabidopsis sequence. Interpret the Data 1. In the rows of data for the organisms being compared with the aphid, highlight the amino acids that are identical to the cor- responding amino acids in the aphid. 2. Which organism has the most amino acids in common with the aphid? Rank the partial polypeptides from the other four organisms in degree of similarity to that of the aphid. 3. Do these data support the hypothesis that aphids acquired the gene for this polypeptide by horizontal gene transfer? Why or why not? If horizontal gene transfer did occur, what type of organism is likely to have been the source? 4. What additional sequence data would support your hypothesis? 5. How would you account for the similarities between the aphid se- quence and the sequences for the bacteria and plant? A version of this Scientific Skills Exercise can be assigned in MasteringBiology. Data from Nancy A. Moran, Yale University. See N. A. Moran and T. Jarvik, Lateral trans- fer of genes from fungi underlies carotenoid production in aphids, Science 328:624–627 (2010).
  • 19. C HAPTER 26 Phylogeny and the Tree of Life 565 Clades can be distinguished by their shared derived characters. SUMMARY OF KEY CONCEPTS C O N C E P T 26.1 Phylogenies show evolutionary relationships (pp. 548–551) Linnaeus’s binomial classification system gives organisms two- part names: a genus plus a specific epithet. In the Linnaean system, species are grouped in increasingly broad taxa: Related genera are placed in the same family, fami- lies in orders, orders in classes, classes in phyla, phyla in king- doms, and (more recently) kingdoms in domains. Systematists depict evolutionary relationships as branching phy- logenetic trees. Many systematists propose that classification be based entirely on evolutionary relationships. Chapter Review26 Taxon A Taxon B Sister taxa Basal taxon Most recent common ancestor Branch point Polytomy Taxon C Taxon D Taxon E Taxon F Taxon G Unless branch lengths are proportional to time or genetic change, a phylogenetic tree indicates only patterns of descent. Much information can be learned about a species from its evolu- tionary history; hence, phylogenies are useful in a wide range of applications. ? Humans and chimpanzees are sister species. Explain what that means. C O N C E P T 26.2 Phylogenies are inferred from morphological and molecular data (pp. 551–553) Organisms with similar morphologies or DNA sequences are likely to be more closely related than organisms with very differ- ent structures and genetic sequences. To infer phylogeny, homology (similarity due to shared ances- try) must be distinguished from analogy (similarity due to con- vergent evolution). Computer programs are used to align comparable DNA se- quences and to distinguish molecular homologies from coinci- dental matches between taxa that diverged long ago. ? Why is it necessary to distinguish homology from analogy to infer phylogeny? C O N C E P T 26.3 Shared characters are used to construct phylogenetic trees (pp. 553–559) A clade is a monophyletic grouping that includes an ancestral species and all of its descendants. A C Monophyletic group Polyphyletic group Paraphyletic group D E F G B A C D E F G B A C D E F G B Among phylogenies, the most parsimonious tree is the one that requires the fewest evolutionary changes. The most likely tree is the one based on the most likely pattern of changes. Well-supported phylogenetic hypotheses are consistent with a wide range of data. ? Explain the logic of using shared derived characters to infer phylogeny. C O N C E P T 26.4 An organism’s evolutionary history is documented in its genome (pp. 559–560) Orthologous genes are homologous genes found in different species as a result of speciation. Paralogous genes are homolo- gous genes within a species that result from gene duplication; such genes can diverge and potentially take on new functions. Distantly related species often have many orthologous genes. The small variation in gene number in organisms of varying complexity suggests that genes are versatile and may have mul- tiple functions. ? When reconstructing phylogenies, is it better to compare ortholo- gous or paralogous genes? Explain. C O N C E P T 26.5 Molecular clocks help track evolutionary time (pp. 560–562) Some regions of DNA change at a rate consistent enough to serve as a molecular clock, in which the amount of genetic change is used to estimate the date of past evolutionary events. Other DNA regions change in a less predictable way. Molecular clock analyses suggest that the most common strain of HIV jumped from primates to humans in the early 1900s. ? Describe some assumptions and limitations of molecular clocks. C O N C E P T 26.6 Our understanding of the tree of life continues to change based on new data (pp. 562–564) Past classification systems have given way to the current view of the tree of life, which consists of three great domains: Bacteria, Archaea, and Eukarya.
  • 20. This West Indian manatee (Trichechus manatus) is an aquatic mammal. Like amphibians and reptiles, mammals are tetra- pods (vertebrates with four limbs). Explain why manatees are considered tetrapods even though they lack hind limbs, and suggest traits that manatees likely share with leopards and other mammals (see Figure 26.12b). How might early members of the manatee lineage have differed from today’s manatees? For selected answers, see Appendix A. Salamander Lizard Goat Human Students Go to MasteringBiology for assignments, the eText, and the Study Area with practice tests, animations, and activities. Instructors Go to MasteringBiology for automatically graded tutorials and questions that you can assign to your students, plus Instructor Resources. LEVEL 3: SYNTHESIS/EVALUATION 8. EVOLUTION CONNECTION Darwin suggested looking at a species’ close relatives to learn what its ancestors may have been like. How does his suggestion anticipate recent methods, such as phylogenetic bracketing and the use of outgroups in cladistic analysis? 9. SCIENTIFIC INQUIRY D R AW I T (a) Draw a phylogenetic tree based on characters 1–5 in the table below. Place hatch marks on the tree to indi- cate the origin(s) of characters 1–6. (b) Assume that tuna and dolphins are sister species and redraw the phylogenetic tree accordingly. Use hatch marks to indicate the origin(s) of char- acters 1–6. (c) How many evolutionary changes are required in each tree? Which tree is most parsimonious? Character Lancelet (outgroup) Lamprey Tuna Salamander Turtle Leopard Dolphin (1) Backbone 0 1 1 1 1 1 1 (2) Hinged jaw 0 0 1 1 1 1 1 (3) Four limbs 0 0 0 1 1 1 1* (4) Amnion 0 0 0 0 1 1 1 (5) Milk 0 0 0 0 0 1 1 (6) Dorsal fin 0 0 1 0 0 0 1 *Although adult dolphins have only two obvious limbs (their flippers), as em- bryos they have two hind-limb buds, for a total of four limbs. 10. WRITE ABOUT A THEME: INFORMATION In a short essay (100–150 words), explain how genetic infor- mation—along with an understanding of the process of descent with modification—enables scientists to reconstruct phylog- enies that extend hundreds of millions of years back in time. 11. SYNTHESIZE YOUR KNOWLEDGE Phylogenies based in part on rRNA genes suggest that eukary- otes are most closely related to archaea, while data from some other genes suggest a closer relationship to bacteria. Genetic analyses indicate that extensive horizontal gene transfer has occurred throughout the evolutionary history of life. ? Why was the five-kingdom system abandoned for a three-domain system? TEST YOUR UNDERSTANDING LEVEL 1: KNOWLEDGE/COMPREHENSION 1. In a comparison of birds and mammals, the condition of hav- ing four limbs is a. a shared ancestral character. b. a shared derived character. c. a character useful for distinguishing birds from mammals. d. an example of analogy rather than homology. 2. To apply parsimony to constructing a phylogenetic tree, a. choose the tree that assumes all evolutionary changes are equally probable. b. choose the tree in which the branch points are based on as many shared derived characters as possible. c. choose the tree that represents the fewest evolutionary changes, in either DNA sequences or morphology. d. choose the tree with the fewest branch points. LEVEL 2: APPLICATION/ANALYSIS 3. In Figure 26.4, which similarly inclusive taxon descended from the same common ancestor as Canidae? a. Felidae b. Mustelidae a. The salamander lineage is a basal taxon. b. Salamanders are a sister group to the group containing liz- ards, goats, and humans. c. Salamanders are as closely related to goats as to humans. d. Lizards are more closely related to salamanders than to humans. 6. If you were using cladistics to build a phylogenetic tree of cats, which of the following would be the best outgroup? a. wolf b. domestic cat c. Carnivora d. Lutra c. lion d. leopard 4. Three living species X, Y, and Z share a common ancestor T, as do extinct species U and V. A grouping that consists of species T, X, Y, and Z (but not U or V) makes up a. a monophyletic taxon. b. an ingroup, with species U as the outgroup. c. a paraphyletic group. d. a polyphyletic group. 5. Based on the tree below, which statement is not correct? 7. The relative lengths of the frog and mouse branches in the phylogenetic tree in Figure 26.13 indicate that a. frogs evolved before mice. b. mice evolved before frogs. c. the homolog has evolved more rapidly in mice. d. the homolog has evolved more slowly in mice. 566 UNIT FIVE The Evolutionary History of Biological Diversity