Download to read offline


![Apparent Electrical Power,
𝑆 𝑒 = 𝑉𝐼 =
𝑉2
𝑍 𝑒
= 𝐼2 𝑍 𝑒,
where 𝑍 𝑒=𝑅 𝑒+j[ωL +
1
𝑗2 𝜔𝐶
]
Apparent Mechanical Power,
𝑆 𝑚 𝑠 = τ 𝑠 ω 𝑠 =
𝜏(𝑠)2
𝑍 𝑚(𝑠)
= 𝑠𝜔(𝑠)2 𝑍 𝑚(𝑠)
where, Zm s = B s + s[ J(s) +
𝐾(𝑠)
𝑠2 ]
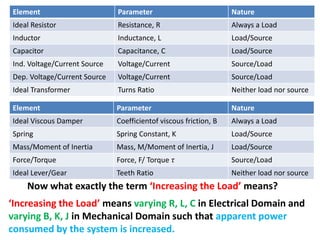
Increase in Load means:
1. Decrease in Electrical Impedance, if applied voltage is kept constant.
2. Increase in Electrical Impedance, if current is kept constant.
3. Decreasein Mechanical Impedance, if applied torque is kept constant.
4. Increase in Mechanical Impedance, if angular velocity is kept constant.](https://image.slidesharecdn.com/2017-somebasicconceptionsandmisconceptionsinelectricalengineering-180306052721/85/2017-Some-basic-conceptions-and-misconceptions-in-electrical-engineering-45-320.jpg)


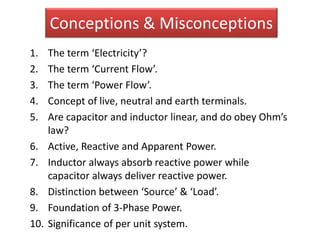
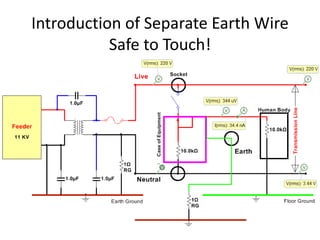
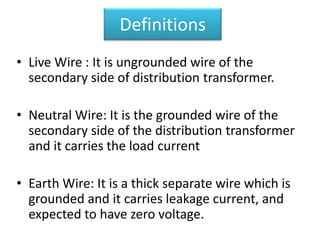
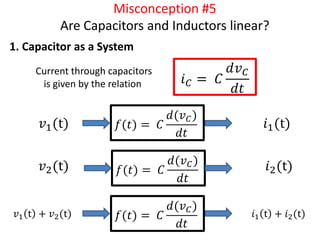
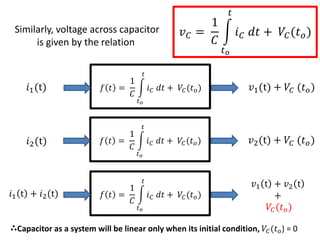
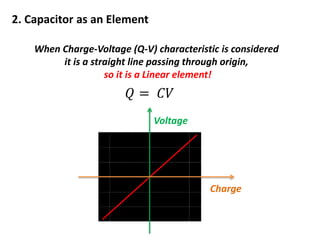
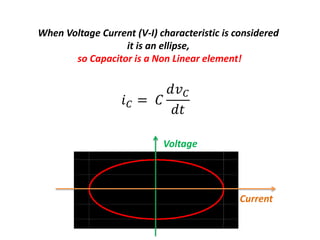
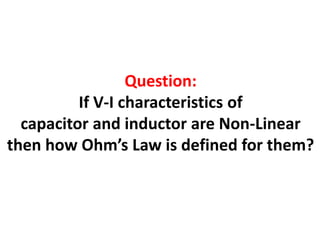
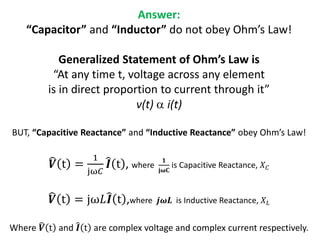
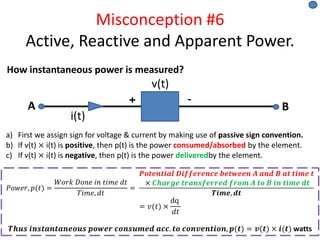
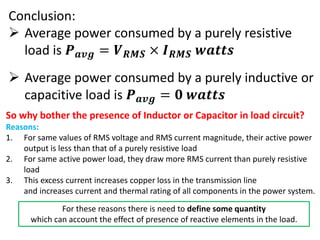
The document discusses various concepts and misconceptions related to electricity, such as the definitions of electricity, current flow, and power flow. It addresses common misunderstandings regarding capacitors and inductors, reactive and apparent power, and the distinction between sources and loads in electrical systems. The document also outlines the foundations of 3-phase power and the significance of the per unit system.