This document defines key concepts in measurement including variables, concepts, indicators, and scales of measurement. It discusses:
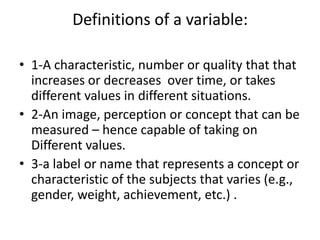
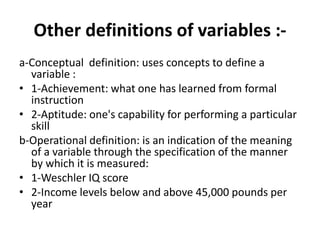
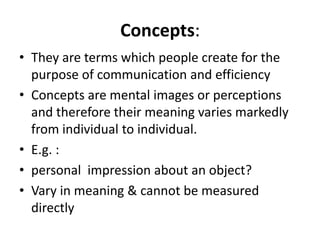
- The difference between concepts, which cannot be measured, and variables, which can be measured through various scales. Variables are operationalized from concepts.
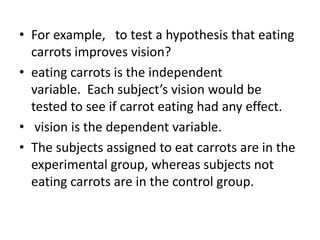
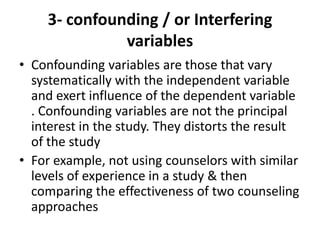
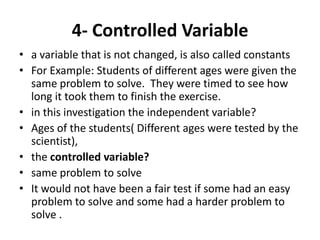
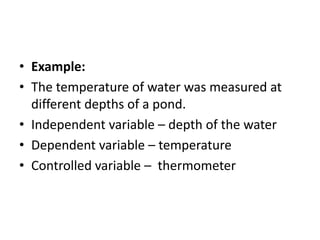
- Types of variables including independent and dependent variables in experimental research, and confounding variables.
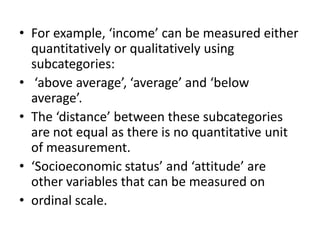
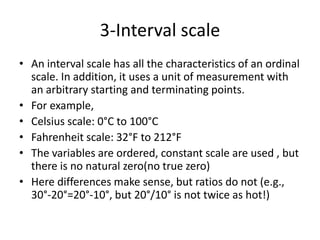
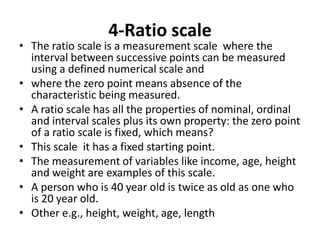
- The four scales of measurement - nominal, ordinal, interval, and ratio - and their properties in terms of ordering and calculating differences and ratios between values.