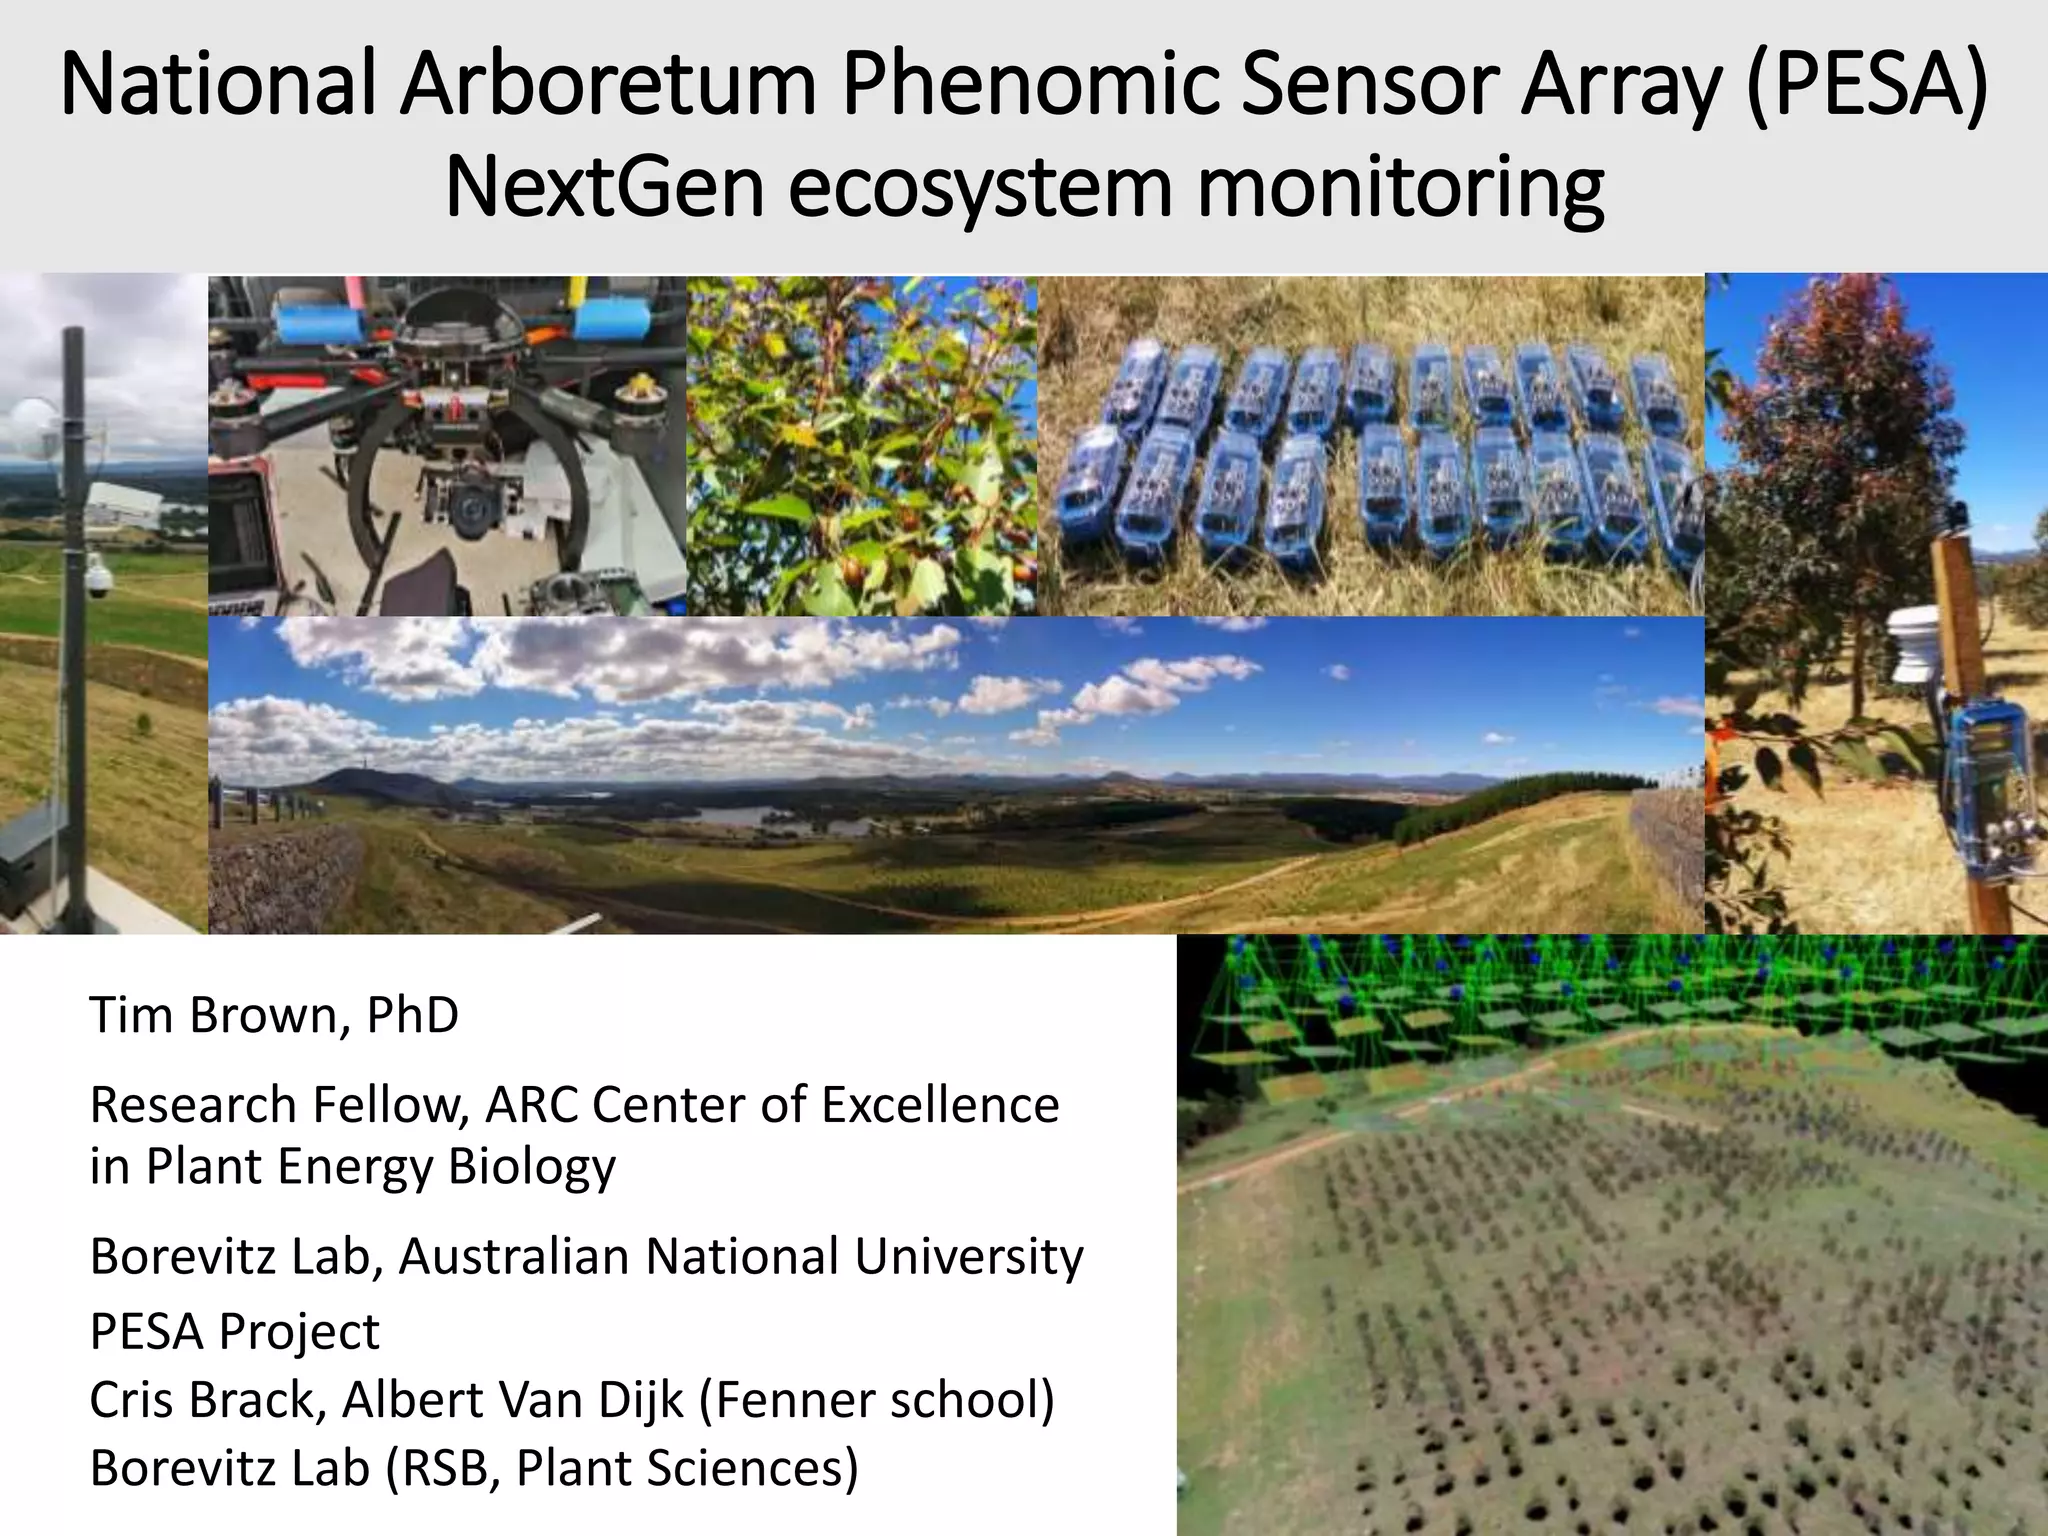
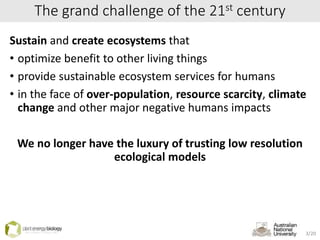
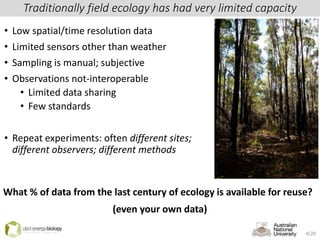
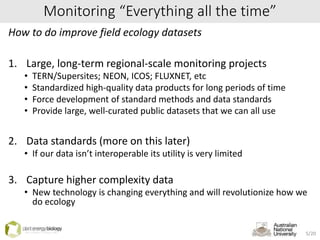
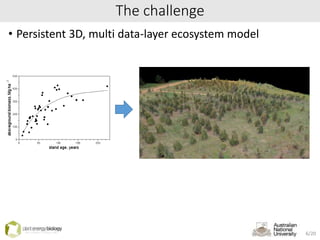
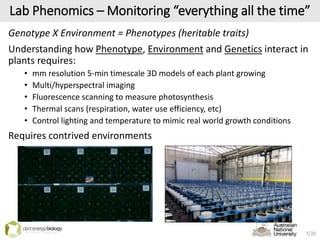
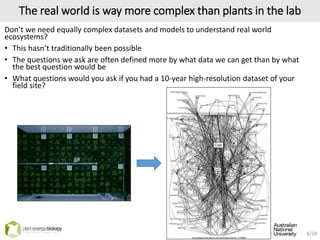
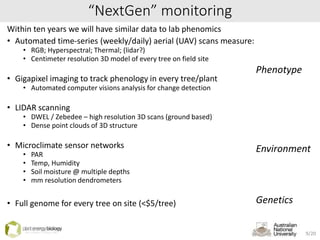
The document discusses the National Arboretum Phenomic Sensor Array (PESA) project, which aims to address significant ecological challenges arising from climate change, biodiversity loss, and resource scarcity through advanced monitoring technologies. It emphasizes the need for high-resolution ecological data, interoperability of datasets, and the role of new technologies like UAVs and automated sensors in transforming field ecology. The project aims to create a persistent and comprehensive dataset to improve ecosystem modeling and understanding of plant-environment interactions.

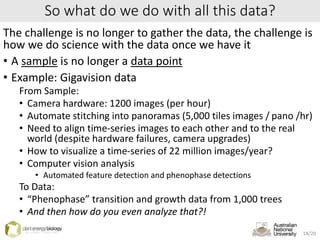
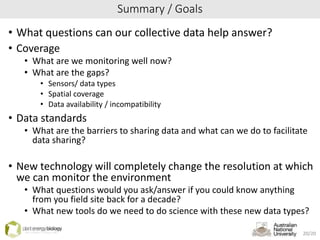
![In the next 100 years we will face challenges of
unprecedented scale and complexity
• Massive Biodiversity loss (since 1500):
• ~30% decline in land animals; ~70% of invertebrates (insects, etc.) show >45% declines4
• > 90% of the world’s fish stocks are fully exploited or overexploited 6
• 11 billion people on the planet by 2100 1
• We must grow more food by 2100 than all the food produced in human history2
• Global climate will warm by 4-6°C by 2100
• No one under the age of 24 has lived in a year when the earth was cooler than any time in the last 2,000 years
• 53% of Eucalyptus species will be out of their native ranges 21002
• Sea levels will rise by 0.5 – 1.1m3
1) Gerland, et al, 2014, [DOI:10.1126/science.1257469];
2) “Seeds of Doubt” New Yorker, Aug 25, 2014
3) Hughes et al. Global Ecology and Biogeography Letters (1996): 23-29.
4) “Climate Change Risks to Australia’s Coast”, 2009
5) Dirzo, Rodolfo, et al. 2014. DOI: 10.1126/science.1251817
6) http://worldoceanreview.com/en/wor-2/fisheries/state-of-fisheries-worldwide/ 2/20](https://image.slidesharecdn.com/2015-02-13arboretumpesafinal-150223175842-conversion-gate02/85/NextGen-environmental-sensing-at-the-National-Arboretum-2-320.jpg)


![TraitCapture: NextGen phenomics tools for lab and field [ComBio2015]](https://cdn.slidesharecdn.com/ss_thumbnails/2015-09-24-combio2015-timbrown-upload-150930015646-lva1-app6891-thumbnail.jpg?width=640&height=640&fit=bounds)


![Polymer [ बहुलक ] Chemistry Notes PDF - Irfanullah Mehar - JJ Sir Chemistry.pdf](https://cdn.slidesharecdn.com/ss_thumbnails/polymerchemistrynotespdf-irfanullahmehar-jjsirchemistry-260210172118-3f9b37f7-thumbnail.jpg?width=640&height=640&fit=bounds)


