This document discusses next generation software and hardware for plant phenotyping and ecosystem monitoring. It outlines challenges such as processing and managing large datasets, and optimizing open data sharing. Emerging tools discussed for high resolution field phenotyping include gigapixel imaging, drones, LiDAR, virtual/augmented reality, and sensor networks. A case study is presented of a sensor array installed at the Australian National Arboretum to monitor the environment, tree growth phenotypes, and genotypes over time at high precision across the landscape. The goal is to address fundamental ecological questions by capturing data at finer spatial and temporal resolutions than previously possible.
2015 05 Scaling from seeds to ecosystemsTimeScience
A presentation on my work to the Robert Mahony's lab at the ARC Centre of Excellence for Robotic Vision at ANU.
Video here: http://youtu.be/IGPZSZn_zzw
TraitCapture: NextGen phenomics tools for lab and field [ComBio2015]TimeScience
Presentation given at ComBio2015.
Abstract:
Effectively addressing the environmental, land management and food production challenges of the 21st century requires exponential increases in our ability to understand and model ecosystem and agricultural processes. Lab approaches enable accurate measurement of the genetic and environmental basis of yield and fitness traits. In the field, we can fit models to predict how genotype/environment interactions scale to ecosystems. High-throughput phenomics in the lab can precisely phenotype thousands of plants under simulated climates. Full-genome sequencing and Genome-Wide Association Studies are used to dissect how traits emerge as an interaction between genes and environment. However, this high-dimensional data analysis is challenging and scaling such to the field is difficult. In the field we can use new monitoring technologies (UAVs, sensor networks, etc.) and cloud-based computation to monitor the environment at unprecedented resolutions. But our ability to collect data is rapidly outstripping capacity to visualize and analyzing these data. Lack of data standards and open-source software are a major limiting factor in our ability to effectively make use of complex research data. TraitCapture is an open-source high-throughput phenotyping system combining multispectral lighting and environmental controls simulating regional or climate-shifted growth conditions with real-time phenotyping of 2,000 plants/month. Plant sequence data and phenotypes are co-analyzed with GWAS to identify heritable traits. The Phenomic-Environmental-Sensing-Array (PESA) is a field-based system at the National Arboretum in Canberra, Australia that combines traditional and “NextGen” monitoring (weather, microclimate sensor networks, precision dendrometers, UAV time-lapse imaging, high-density LiDAR, phenocams and gigapixel-resolution time-lapse imaging. The site has biologically significant microclimate variation and a multi-year drought trial. Phenomic and environmental data, combined with tree genomic data, allow us to examine how environment and genetics shape phenotype and how the site microclimate changes with forest maturation. All software tools are web-based, open-source and work with both lab and field datasets.
Gigapixel imaging, ESA Australia, Dec 2012TimeScience
Talk given by Tim Brown at the annual Ecological Society of Australia, 2012 meeting in Melbourne, Australia.
More info on the Gigavision project here:
http://www.gigavision.org
From pixels to point clouds - Using drones,game engines and virtual reality t...ARDC
Presentation by Dr Tim Brown
Full webinar: https://www.youtube.com/watch?v=bl_7ClXhQlA&list=PLG25fMbdLRa5qsPiBGPaj2NHqPyG8X435&index=11
Individual snippet:https://youtu.be/PVf4zYNJlmM?list=PLG25fMbdLRa5qsPiBGPaj2NHqPyG8X435
Making Sense of Information Through Planetary Scale ComputingLarry Smarr
09.03.01
Invited Presentation to the
Diamond Exchange—Brave New World
Title: Making Sense of Information Through Planetary Scale Computing
Monterey, CA
The Pacific Research Platform: A Regional-Scale Big Data Analytics Cyberinfra...Larry Smarr
National Ocean Exploration Forum 2017
Ocean Exploration in a Sea of Data
Calit2’s Qualcomm Institute
University of California, San Diego
October 21, 2017
An End-to-End Campus-Scale High Performance Cyberinfrastructure for Data-Inte...Larry Smarr
12.04.19
The Annual Robert Stewart Distinguished Lecture
Iowa State University
Title: An End-to-End Campus-Scale High Performance Cyberinfrastructure for Data-Intensive Research
Ames, IA
Remote Telepresence for Exploring Virtual WorldsLarry Smarr
08.01.26
Foundational Talk
Virtual World and Immersive Environments
NASA Ames
Title: Remote Telepresence for Exploring Virtual Worlds
Mountain View, CA
Efficient data reduction and analysis of DECam images using multicore archite...Roberto Muñoz
A talk I gave in the workshop "Tools for astronomical big data" held in Tucson, Arizona on March 2015. My talk was about how to do data science and big data in Astronomy having a small budget.
Applying Photonics to User Needs: The Application ChallengeLarry Smarr
05.02.28
Invited Talk to the 4th Annual On*VECTOR International Photonics Workshop
Sponsored by NTT Network Innovation Laboratories
Title: Applying Photonics to User Needs: The Application Challenge
University of California, San Diego
Calit2 - CSE's Living Laboratory for ApplicationsLarry Smarr
08.05.27
UCSD CSE 91 - Perspectives in Computer Science (Spring 2008)
Calit2@UCSD
Title: Calit2 - CSE's Living Laboratory for Applications
La Jolla, CA
Building a Global Collaboration System for Data-Intensive DiscoveryLarry Smarr
11.01.06
Distinguished Lecture
Hawaii International Conference on System Sciences (HICSS-44)
Title: Building a Global Collaboration System for Data-Intensive Discovery
Kauai, HI
High Performance Cyberinfrastructure Discovery Tools for Data Intensive ResearchLarry Smarr
10.05.03
Keynote Speaker
NAE Grand Challenges Summit
Title: High Performance Cyberinfrastructure Discovery Tools for Data Intensive Research
Seattle, WA
LambdaGrids--Earth and Planetary Sciences Driving High Performance Networks a...Larry Smarr
05.02.04
Invited Talk to the NASA Jet Propulsion Laboratory
Title: LambdaGrids--Earth and Planetary Sciences Driving High Performance Networks and High Resolution Visualizations
Pasadena, CA
Coupling Australia’s Researchers to the Global Innovation EconomyLarry Smarr
08.10.15
Eighth Lecture in the
Australian American Leadership Dialogue Scholar Tour
Australian National University
Title: Coupling Australia’s Researchers to the Global Innovation Economy
Canberra, Australia
Science and Cyberinfrastructure in the Data-Dominated EraLarry Smarr
10.02.22
Invited talk
Symposium #1610, How Computational Science Is Tackling the Grand Challenges Facing Science and Society
Title: Science and Cyberinfrastructure in the Data-Dominated Era
San Diego, CA
GeoCENS Source Talk: Results from an Atlantic Rainforest Micrometeorology Sen...Cybera Inc.
Rob Fatland gave this presentation to the GeoCENS SSC Workshop on the current efforts, projects, and tools towards advancing environmental science in Banff, AB, September 23, 2010.
Enabling the physical world to the Internet and potential benefits for agricu...Andreas Kamilaris
The Internet of Things (IoT) allows physical devices that live inside smart homes, offices, roads, electricity networks and city infrastructures to seamlessly communicate through the Internet while the forthcoming Web of Things (WoT) ensures interoperability at the application level through standardized Web technologies and protocols. In this presentation, we explain the concepts of the IoT and the WoT and their potential through various applications in the aforementioned domains. Then, we examine how the IoT/WoT can be used in the agri-food industry in order to enable novel smart farming technologies and applications,considering the recent technological opportunities for big data analysis.
How HPC and large-scale data analytics are transforming experimental scienceinside-BigData.com
In this deck from DataTech19, Debbie Bard from NERSC presents: Supercomputing and the scientist: How HPC and large-scale data analytics are transforming experimental science.
"Debbie Bard leads the Data Science Engagement Group NERSC. NERSC is the mission supercomputing center for the USA Department of Energy, and supports over 7000 scientists and 700 projects with supercomputing needs. A native of the UK, her career spans research in particle physics, cosmology and computing on both sides of the Atlantic. She obtained her PhD at Edinburgh University, and has worked at Imperial College London as well as the Stanford Linear Accelerator Center (SLAC) in the USA, before joining the Data Department at NERSC, where she focuses on data-intensive computing and research, including supercomputing for experimental science and machine learning at scale."
Watch the video: https://wp.me/p3RLHQ-kLV
Sign up for our insideHPC Newsletter: http://insidehpc.com/newsletter
In this deck from the 2014 HPC User Forum in Seattle, Jack Collins from the National Cancer Institute presents: Genomes to Structures to Function: The Role of HPC.
Watch the video presentation: http://wp.me/p3RLHQ-d28
Here are the slides of a talk given on a seminar "Earth observation and deep learning", given at Polytechnique.
The state of progress in a context that evolves very very fast!
VISION / AMBITION
-Australia the first drone-sensed nation (cm-scale)
-Pre-competitive data release for industry, environmental management, education & research
-Conventional survey & remote sensing techniques at ultra-high resolution and flexibility (time-series, rapid response etc)
-Next gen “UNDERCOVER” techniques (minerals and water resources)
Detecting solar farms with deep learningJason Brown
Talk delivered at Free and Open Source Software for Geo North America 2019 (FOSS4GNA)
Large scale solar arrays or farms have been installed globally faster than can be reliably tracked by interested stakeholders. We have built a deep learning model with Sentinel 2 satellite imagery that allows us to create accurate, timely global maps of solar farms.
A National Big Data Cyberinfrastructure Supporting Computational Biomedical R...Larry Smarr
Invited Presentation
Symposium on Computational Biology and Bioinformatics:
Remembering John Wooley
National Institutes of Health
Bethesda, MD
July 29, 2016
For the full video of this presentation, please visit:
https://www.embedded-vision.com/platinum-members/embedded-vision-alliance/embedded-vision-training/videos/pages/sept-2017-alliance-vitf-courtney
For more information about embedded vision, please visit:
http://www.embedded-vision.com
Dr. Patrick Courtney, MBA, of tec-connection and the Standards in Laboratory Automation (SiLA) Consortium delivers the presentation "The Reverse Factory: Embedded Vision in High-Volume Laboratory Applications" at the Embedded Vision Alliance's September 2017 Vision Industry and Technology Forum. In his presentation, Courtney covers the following topics:
▪ Motivation: the need and the market
▪ Big applications today: NGS case study
▪ Improvement curve: Carlson’s curve and what this means
▪ The next applications for imaging
(Em)Powering Science: High-Performance Infrastructure in Biomedical ScienceAri Berman
We’ll explore current and future considerations in advanced computing architectures that empower the conversion of data into knowledge. Life sciences produce the largest amount of data production out of all major science domains, making analytics and scientific computing cornerstones of modern research programs and methodologies. We’ll highlight the remarkable biomedical discoveries that are emerging through combined efforts, and discuss where and how the right infrastructure can catalyze the advancement of human knowledge. On-premises architectures as well as cloud, hybrid, and exotic architectures will all be discussed. It’s likely that all life science researchers will required advanced computing to perform their research within the next year. However, there has been less focus on advanced computing infrastructures across the industry due to the increased availability of public cloud infrastructure anything as a service models.
Driving Applications on the UCSD Big Data Freeway SystemLarry Smarr
Keynote lecture by Calit2 Director Larry Smarr to the Cubic and UC San Diego Innovation Workshop on February 26, 2014 explores driving applications on the UCSD Big Data freeway system.
Comparing Evolved Extractive Text Summary Scores of Bidirectional Encoder Rep...University of Maribor
Slides from:
11th International Conference on Electrical, Electronics and Computer Engineering (IcETRAN), Niš, 3-6 June 2024
Track: Artificial Intelligence
https://www.etran.rs/2024/en/home-english/
A brief information about the SCOP protein database used in bioinformatics.
The Structural Classification of Proteins (SCOP) database is a comprehensive and authoritative resource for the structural and evolutionary relationships of proteins. It provides a detailed and curated classification of protein structures, grouping them into families, superfamilies, and folds based on their structural and sequence similarities.
Cancer cell metabolism: special Reference to Lactate PathwayAADYARAJPANDEY1
Normal Cell Metabolism:
Cellular respiration describes the series of steps that cells use to break down sugar and other chemicals to get the energy we need to function.
Energy is stored in the bonds of glucose and when glucose is broken down, much of that energy is released.
Cell utilize energy in the form of ATP.
The first step of respiration is called glycolysis. In a series of steps, glycolysis breaks glucose into two smaller molecules - a chemical called pyruvate. A small amount of ATP is formed during this process.
Most healthy cells continue the breakdown in a second process, called the Kreb's cycle. The Kreb's cycle allows cells to “burn” the pyruvates made in glycolysis to get more ATP.
The last step in the breakdown of glucose is called oxidative phosphorylation (Ox-Phos).
It takes place in specialized cell structures called mitochondria. This process produces a large amount of ATP. Importantly, cells need oxygen to complete oxidative phosphorylation.
If a cell completes only glycolysis, only 2 molecules of ATP are made per glucose. However, if the cell completes the entire respiration process (glycolysis - Kreb's - oxidative phosphorylation), about 36 molecules of ATP are created, giving it much more energy to use.
IN CANCER CELL:
Unlike healthy cells that "burn" the entire molecule of sugar to capture a large amount of energy as ATP, cancer cells are wasteful.
Cancer cells only partially break down sugar molecules. They overuse the first step of respiration, glycolysis. They frequently do not complete the second step, oxidative phosphorylation.
This results in only 2 molecules of ATP per each glucose molecule instead of the 36 or so ATPs healthy cells gain. As a result, cancer cells need to use a lot more sugar molecules to get enough energy to survive.
introduction to WARBERG PHENOMENA:
WARBURG EFFECT Usually, cancer cells are highly glycolytic (glucose addiction) and take up more glucose than do normal cells from outside.
Otto Heinrich Warburg (; 8 October 1883 – 1 August 1970) In 1931 was awarded the Nobel Prize in Physiology for his "discovery of the nature and mode of action of the respiratory enzyme.
WARNBURG EFFECT : cancer cells under aerobic (well-oxygenated) conditions to metabolize glucose to lactate (aerobic glycolysis) is known as the Warburg effect. Warburg made the observation that tumor slices consume glucose and secrete lactate at a higher rate than normal tissues.
THE IMPORTANCE OF MARTIAN ATMOSPHERE SAMPLE RETURN.Sérgio Sacani
The return of a sample of near-surface atmosphere from Mars would facilitate answers to several first-order science questions surrounding the formation and evolution of the planet. One of the important aspects of terrestrial planet formation in general is the role that primary atmospheres played in influencing the chemistry and structure of the planets and their antecedents. Studies of the martian atmosphere can be used to investigate the role of a primary atmosphere in its history. Atmosphere samples would also inform our understanding of the near-surface chemistry of the planet, and ultimately the prospects for life. High-precision isotopic analyses of constituent gases are needed to address these questions, requiring that the analyses are made on returned samples rather than in situ.
Richard's entangled aventures in wonderlandRichard Gill
Since the loophole-free Bell experiments of 2020 and the Nobel prizes in physics of 2022, critics of Bell's work have retreated to the fortress of super-determinism. Now, super-determinism is a derogatory word - it just means "determinism". Palmer, Hance and Hossenfelder argue that quantum mechanics and determinism are not incompatible, using a sophisticated mathematical construction based on a subtle thinning of allowed states and measurements in quantum mechanics, such that what is left appears to make Bell's argument fail, without altering the empirical predictions of quantum mechanics. I think however that it is a smoke screen, and the slogan "lost in math" comes to my mind. I will discuss some other recent disproofs of Bell's theorem using the language of causality based on causal graphs. Causal thinking is also central to law and justice. I will mention surprising connections to my work on serial killer nurse cases, in particular the Dutch case of Lucia de Berk and the current UK case of Lucy Letby.
Earliest Galaxies in the JADES Origins Field: Luminosity Function and Cosmic ...Sérgio Sacani
We characterize the earliest galaxy population in the JADES Origins Field (JOF), the deepest
imaging field observed with JWST. We make use of the ancillary Hubble optical images (5 filters
spanning 0.4−0.9µm) and novel JWST images with 14 filters spanning 0.8−5µm, including 7 mediumband filters, and reaching total exposure times of up to 46 hours per filter. We combine all our data
at > 2.3µm to construct an ultradeep image, reaching as deep as ≈ 31.4 AB mag in the stack and
30.3-31.0 AB mag (5σ, r = 0.1” circular aperture) in individual filters. We measure photometric
redshifts and use robust selection criteria to identify a sample of eight galaxy candidates at redshifts
z = 11.5 − 15. These objects show compact half-light radii of R1/2 ∼ 50 − 200pc, stellar masses of
M⋆ ∼ 107−108M⊙, and star-formation rates of SFR ∼ 0.1−1 M⊙ yr−1
. Our search finds no candidates
at 15 < z < 20, placing upper limits at these redshifts. We develop a forward modeling approach to
infer the properties of the evolving luminosity function without binning in redshift or luminosity that
marginalizes over the photometric redshift uncertainty of our candidate galaxies and incorporates the
impact of non-detections. We find a z = 12 luminosity function in good agreement with prior results,
and that the luminosity function normalization and UV luminosity density decline by a factor of ∼ 2.5
from z = 12 to z = 14. We discuss the possible implications of our results in the context of theoretical
models for evolution of the dark matter halo mass function.
(May 29th, 2024) Advancements in Intravital Microscopy- Insights for Preclini...Scintica Instrumentation
Intravital microscopy (IVM) is a powerful tool utilized to study cellular behavior over time and space in vivo. Much of our understanding of cell biology has been accomplished using various in vitro and ex vivo methods; however, these studies do not necessarily reflect the natural dynamics of biological processes. Unlike traditional cell culture or fixed tissue imaging, IVM allows for the ultra-fast high-resolution imaging of cellular processes over time and space and were studied in its natural environment. Real-time visualization of biological processes in the context of an intact organism helps maintain physiological relevance and provide insights into the progression of disease, response to treatments or developmental processes.
In this webinar we give an overview of advanced applications of the IVM system in preclinical research. IVIM technology is a provider of all-in-one intravital microscopy systems and solutions optimized for in vivo imaging of live animal models at sub-micron resolution. The system’s unique features and user-friendly software enables researchers to probe fast dynamic biological processes such as immune cell tracking, cell-cell interaction as well as vascularization and tumor metastasis with exceptional detail. This webinar will also give an overview of IVM being utilized in drug development, offering a view into the intricate interaction between drugs/nanoparticles and tissues in vivo and allows for the evaluation of therapeutic intervention in a variety of tissues and organs. This interdisciplinary collaboration continues to drive the advancements of novel therapeutic strategies.
Multi-source connectivity as the driver of solar wind variability in the heli...Sérgio Sacani
The ambient solar wind that flls the heliosphere originates from multiple
sources in the solar corona and is highly structured. It is often described
as high-speed, relatively homogeneous, plasma streams from coronal
holes and slow-speed, highly variable, streams whose source regions are
under debate. A key goal of ESA/NASA’s Solar Orbiter mission is to identify
solar wind sources and understand what drives the complexity seen in the
heliosphere. By combining magnetic feld modelling and spectroscopic
techniques with high-resolution observations and measurements, we show
that the solar wind variability detected in situ by Solar Orbiter in March
2022 is driven by spatio-temporal changes in the magnetic connectivity to
multiple sources in the solar atmosphere. The magnetic feld footpoints
connected to the spacecraft moved from the boundaries of a coronal hole
to one active region (12961) and then across to another region (12957). This
is refected in the in situ measurements, which show the transition from fast
to highly Alfvénic then to slow solar wind that is disrupted by the arrival of
a coronal mass ejection. Our results describe solar wind variability at 0.5 au
but are applicable to near-Earth observatories.
Seminar of U.V. Spectroscopy by SAMIR PANDASAMIR PANDA
Spectroscopy is a branch of science dealing the study of interaction of electromagnetic radiation with matter.
Ultraviolet-visible spectroscopy refers to absorption spectroscopy or reflect spectroscopy in the UV-VIS spectral region.
Ultraviolet-visible spectroscopy is an analytical method that can measure the amount of light received by the analyte.
TraitCapture: NextGen Monitoring and Visualization from seed to ecosystem
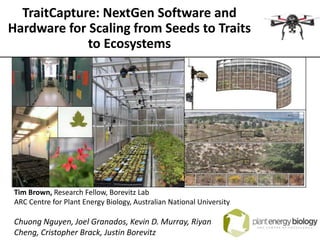
1. TraitCapture: NextGen Software and
Hardware for Scaling from Seeds to Traits
to Ecosystems
Tim Brown, Research Fellow, Borevitz Lab
ARC Centre for Plant Energy Biology, Australian National University
Chuong Nguyen, Joel Granados, Kevin D. Murray, Riyan
Cheng, Cristopher Brack, Justin Borevitz
2. Terraforming
“To alter the environment of a planet to make it capable of
supporting terrestrial life forms.”
We are currently unterraforming the earth at an exceptionally fast rate
To meet the challenges of the coming century we need to restore and
re-engineer the environment to support >7 billion people for the next
100 years in the face of climate change while maintaining biodiversity
and ecosystem services
These ecological challenges are too hard to be solved
with existing data and methods
3. Genotype x Environment = Phenotype
The degree to which we can measure all three components
is the degree to which we can understand plant and
ecosystem function
FIELDLAB
4. Outline: Phenomics challenges
• Lab:
• Measure phenotypes with high precision across large natural
populations in varied growth environments
• Identify the genetic basis of traits of interest
• Identify novel, cryptic traits
• Field:
• Monitor phenotype and environment at high precision across scales
from plant to ecosystem to identify natural variation on the landscape
Conservation: Ecosystem stability / plasticity (how should we spend
limited conservation $$)
Restoration: Using existing plasticity and population genetic variation
to select seeds for building “climate ready” populations and assited
migration (reforestation, etc.)
5. Outline: General challenges
(1) Processing and managing big data
• We used to be primarily limited by data collection (hardware)
• Now we are increasingly limited by data processing and curation (software)
• We need “excel” for big data
6. And how do you do science if you can’t even download your data?
7. Outline: General challenges
(2) Optimizing the knowledge discovery network
• Data sharing, open access and open source are of major importance
for solving research problems:
• Research dollars are poorly spent when they produce closed
data and firewalled journal articles, yet we all aspire to publish
our best work in journals that refuse access to the public.
• We have serious problems to solve in this decade: This is a network
optimization problem
• Open source matters! – The rate of knowledge discovery is
determined by how efficiently we can share data, tools and new
knowledge.
8. Lab vs field phenotyping
Lab: High precision measurement and control but low realism
youtu.be/d3vUwCbpDk0
9. Lab vs field phenotyping
Field: Realistic environment but low precision measurements
In the field we have real environments but the complexity (and bad lighting!) reduces
our ability to measure things with precision
youtu.be/gFnXXT1d_7s
11. Lab phenotyping
Normal lab growth conditions aren’t very “natural”
Kulheim, Agren, and Jansson 2002
Real World
Growth Chamber
12. Growth cabinets with dynamic “semi-realistic” environmental &
lighting conditions
• Grow plants in simulated regional/seasonal conditions & simulate climate
• Control chamber light intensity, spectra (8/10-bands), Temp/Humidity @ 5min
intervals
• Expose “cryptic” phenotypes
• Repeat environmental conditions
• Between studies and collaborators
• Simulate live field site climate
Lab Solution: SpectralPhenoClimatron (SPC)
Spectral response of Heliospectra LEDs. (L4A s20: 10-band)
13. TraitCapture: Open-source phenotyping pipeline
• Phenotype 2,000 plants (7 Conviron chambers) in real-time
• 14 DSLR’s (2/chamber) - Controlled by raspberry Pi computers
• 4-12 JPG + RAW images/hr every during daylight
• Automated analysis pipeline: phenotype data from 150,000 pot
images a day
• Automated Phenotypes
• Area
• Diurnal movement
• Color (RGB, Gcc, etc)
• Perimeter, Roundness
• Compactness, Eccentricity
• Upcoming:
• Leaf Count
• Leaf tracking
• Leaf length/width/petiole
• Machine learning
Brown, Tim B., et al. (2014). Current opinion in plant biology 18 (2014): 73-79.
Corrected
Segmented
Original
GWAS
Area
15. The current resolution of field ecology is very limited
• Low spatial & time resolution data
• Limited sensors; don’t capture local spatial variation
• Sampling is often manual and subjective
• Observations not-interoperable or proprietary; little or no data sharing
• Sample resolution is “Forest” or “field” not Tree or Plant
• Very little data from the 20th century ecology is available for reuse
The lab is not the real world
16. The challenge – “Measure everything all the time”
How do we go from doing the science at
the scale of one point per forest to
multilayer data cubes for every tree or
leaf?
16/
20
17. Tech revolutions are driving data revolutions
• Computation
• Small fast and cheap (Raspberry Pi) and Huge fast and cheap (cloud)
• Unlimited storage
• Unlimited processing
• All comes down to pipelines and data management
• Many of the actual computational problems are “solved” or could be with reasonable effort.
• Network
• Ubiquitous internet is huge
• Lab is now in the field (i.e. cloud computational resources available remotely)
• Field is in the lab via AR/VR and 3D
• Mobile computing – your phone is a supercomputer
• 1.5-2x the network bandwidth of MODIS
• The computing power of a supercomputer from 20 years ago
• 4000x the RAM of the Space Shuttle
• 3D
• 3D reconstruction from static and moving cameras
• LiDAR and LightField
• Robotics – automated monitoring and field sampling; Drones/UAVs
• Machine learning / Deep learning / AI – processing huge datasets
18. Huge data crunching isn’t impossible
• Google didn’t exit 17 yrs ago and now it indexes 30
trillion web pages (and 500hrs of new video per minute)
• 1.8 billion (mostly geolocated) images are uploaded to
social media every day (2014; was 500m in 2013)1
• Consider: 75% of cars may be self-driving by 20402 –
continuously imaging, laser scanning and 3D modelling
their immediate environment: 6.2 billion miles3 of
roadside environments in US, imaged in 3D daily!
• Google street view already has imaged 5 million miles of
roads in 3D
We need this level of resolution (and google-like tools) for
ecological knowledge
1. Meeker, 2013, 2014
19. Cloud computing and automation can do amazing things…
2015 Paper: Time-lapse mining from internet photos
• Mined 86 million public geolocated online photos (Flickr, Picassa)
• Clustered 120K different landmarks
• Computed 755K 3D reconstructions.
• 10,728 time-lapses from 2942 landmarks, that contain more than
300 images
• Including a 3-D time-lapse reconstruction of the retreat of the
Briksdalsbreen Glacier in Norway from 9,400 images over a 10-year
time-span.
Martin-Brualla R, Gallup D, and Seitz SM. 2015.
Time-lapse mining from internet photos. ACM
Trans Graph 34: 62.
26. Low cost sequencing let’s us genotype every individual tree and identify genetic loci that correlate
with observed phenotypic differences between trees.
We can do this for all trees at the arboretum within view of the camera.
Fall Color change shows differing rates of fall senescence in trees
Late fall
Brown, TB et al, 2012. High-resolution, time-lapse imaging for ecosystem-scale phenotyping
in the field. in: High Throughput Phenotyping in Plants. Methods in molecular biology.
27. Gigavision hardware evolution
• 2009
• Custom-built system with robotics servos, DSLR’s,
hand wired with mini pc, 0.5 deg accuracy
• 40 minutes / panorama (1.5 gigapixels)
• Jan 2016
• Off the shelf Axis PTZ camera (Q6128) with $40 Raspberry Pi
computer running python code
• 4K resolution PTZ with 700 degree/sec rotation
and 0.2 deg accuracy sensor
• 2 gigapixel panorama in < 5 min
• SMS/Slack alerts if system offline
28. Visualization and analysis (future)
• Current challenge is in visualizing and processing the data
• NGINX image server – stream unlimited resolution images to
any device
• Cloud-backed processing and stitching (university super
computer resources or Amazon cloud)
• Machine learning to detect individuals and phenotypes
• Visualization tools (same as for pot images) – output growth
curves for thousands of trees
• Gigapan viewer demo
• http://bit.ly/gv-tif1 (downsizing a 500MP tif on the fly)
• Player demo
• Old version: Gigavision.org
• New (beta): http://bit.ly/gigavisionV1
29. Gigavision pros and cons
• Pros
• Turn-key always-on automated monitoring
• Monitor huge areas (if you have a tower or a good hill)
• High resolution time-series of everything in your field site
(including ephemerals)
• Cons
• Data transfer issues if you don’t have good internet
• May be overkill if a DSLR image or phenocam provides sufficient
resolution (e.g. tree-level phenology)
• Data extraction pipeline still in beta
• Best hardware solution requires lots of power (30-50watts)
30. UAV’s (drones) for monitoring
• $2-4K airframe (DJI, Aeronavics, senseFly) + 10-20MP digital
camera (~500g – 5KG payload)
• Processing software ($700 - 2,000 USD: Pix4D; Agisoft)
• 3D models of field site (cm resolutions)
• Orthorectified image and map layers
• LAS / point cloud data
• Automated pipeline:
• Tree Height; Volume, foliage density (?)
• RGB color
• GPS location
• DEM of site
• Typically RGB
• Other layers:
• NDVI (MicaSense)
• Hyperspectral
• Thermal
30/
20
View 3D model online:
http://traitcapture.org/
pointclouds
31. Software outputs: DEM and point cloud data
• Processing script for tree data (python):
• GPS, Height, 3D volume, top-down area, RGB phenology data
• Straight to google maps online
32. 3D Point clouds online: http://Phenocam.org.au
Up next, re-sort 3D tree data by provenance, size, etc
33. Drones – Pro’s and cons
• Pros
• Nadir view
• Wide coverage (km’s)
• Larger airframes can carry big payload (~5kg for larger
airframes) for advanced imaging (thermal, hyperspec, etc)
• Time-series point clouds and 3D models of field site
• Outputs can match conventional satellite data for comparison
• Cons
• Requires operator and site visit (can’t fly itself yet)
• Limited time-series and weather dependent
• Regulations and cost (for site visits)
• Processing pipelines not fully turn-key
(and not that cheap)
34. Ultra-high resolution ground-based laser
• DWEL (CSIRO); Zebedee(handheld; $25K LiDAR)
• Multiband Lidar with full point returns
• DWEL: ~30 million points in a 50m2 area (vs 5-10 pts/m for typical airborne)
Data: Michael.Schaefer@csiro.au
36. VR and AR
• Virtual Reality (VR) and Augmented Reality (AR) will
radically change how we interact with our data
• VR (Oculus, VIVE, Morpheus) allows you to immerse
people in imaginary space
• AR (MS Hololens, Magic Leap) allow you to add virtual
content to the real world
Search: “Magic Leap Wired”
37. Augmented / Mixed Reality
• Add holograms to the existing world that can be seen by
anyone
• Microsfot Hololens
• Magic Leap
• Estimated value 2015: $500 million USD; 2016: $2.4 billion
Minecraft on the hololens Magic Leap promo image
40. This is just the beginning
Atari 2600 “Adventure” circa 1980
“Skyrim” circa 2011
We are at the “ATARI” stage in VR
In 10 years, VR/AR will be
indistinguishable from reality.
What will you do with this tool?
41. Important things to consider for monitoring
• Pick the right tool for the job
• What do you really need to measure?
• What is the lowest time and visual resolution you can get
away with?
• How often does it happen? (minute or monthly resolution?)
• How many pixels do you need to detect it?
• For new tech – how do you ground-truth?
• Phenotyping hardware is just sampling some stuff from the
world – the trick is understanding how what the sensor sees
relates to a signal of biological importance (and when it
doesn’t)
• This seems obvious but important to think about when playing
with shiny new toys
Brown, Tim B et al, (2016) Using phenocams to monitor our changing Earth:
towards a global phenocam network. Frontiers in Ecology and the Environment. Vol
14, Issue 2 (March 2016).
42. Example “NextGen” Field site:
National Arboretum Phenomic & Environmental Sensor Array
National Arboretum, Canberra, Australia
ANU Major Equipment Grant, 2014; ANU MEC 2016
Collaboration with:
• Cris Brack and Albert Van Dijk (ANU Fenner school); Borevitz Lab
43. National Arboretum Phenomic & Environmental Sensor Array
• Ideal location
• 5km from ANU (64 Mbps wifi) and near many research institutions
• Forest is only ~4 yrs old
• Chance to monitor it from birth into the future!
• Great site for testing experimental monitoring systems prior to
more remote deployments
43/
20
44. National Arboretum Sensor Array
• 20-node Wireless mesh sensor network (10min sample interval)
• Temp, Humidity
• Sunlight (PAR)
• Soil Temp and moisture @ 20cm depth
• uM resolution denrometers on 20 trees
• Campbell weather stations (baseline data for verification)
• Two Gigapixel timelapse cameras:
• Leaf/growth phenology for > 1,000 trees
• LIDAR: DWEL / Zebedee
• UAV overflights (bi-weekly/monthly)
• Georectified image layers
• High resolution DEM
• 3D point cloud of site in time-series
• Sequence tree genomes
Environment
Phenotype
Genetics
46. “The missing heritability is on your hard drive”
• The challenge is no longer to gather the data, the challenge is how we do science with the data
once we have it
• A sample is no longer a data point
• Gigavision – Hourly time-series of every tree is just pixels not “data” until you quantify something
• Example: Soil Moisture
• 5min intervals @ 20 locations, 6 months of data
• The spatial variation is what is interesting... Artifact or signal?
Soil Moisture @ 20 sensor locations
47. EcoVR: Virtual 3D Ecosystems Project
GIS for 3D “time-series data”• Goal:
• Use modern gaming software to explore new methods for
visualizing time-series environmental data
• Historic and real-time data layers integrated into persistent 3D
model of the national arboretum in the Unreal gaming engine
• Collaboration with
• ANU Computer Science Dept. TechLauncher students
• Stuart Ramsden, ANU VISlab
48.
49. Thanks and Contacts
Justin Borevitz – Lab Leader Lab web page: http://borevitzlab.anu.edu.au
• Funding:
• Arboretum ANU Major Equipment Grant
• ARC Center of Excellence in Planet Energy Biology | ARC Linkage 2014
• Arboretum
• http://bit.ly/PESA2014
• Cris Brack, Albert VanDijk, Justin Borevitz (PESA Project PI’s)
• UAV data: Darrell Burkey, ProUAV
• 3D site modelling:
• Pix4D.com / Zac Hatfield Dodds / ANUVR team
• Dendrometers & site infrastructure
• Darius Culvenor: Environmental Sensing Systems
• Mesh sensors: EnviroStatus, Alberta, CA
• ANUVR Team
• Zena Wolba; Alex Alex Jansons; Isobel Stobo; David Wai [2015/16 Team]
• Yuhao Lui, Zhuoqi Qui, Abishek Kookana, Andrew Kock, Thomas Urwin [2016/7 Team]
• TraitCapture:
• Chuong Nguyen; Joel Granados; Kevin Murray; Gareth Dunstone; Jiri Fajkus
• Pip Wilson; Keng Rugrat; Borevitz Lab
• Gareth Dunstone; Jack Adamson Jordan Braiuka
• Contact me:
• tim.brown@anu.edu.au
• http://bit.ly/Tim_ANU
Code: http://github.com/borevitzlab
50. Links to open
• Gigapan demo
• https://traitcapture.org/test-gigapan?ARB-GV-HILL-1/ARB-GV-HILL-
1.tif
• https://traitcapture.org/test-gigapan?ARB-GV-HILL-1/ARB-GV-HILL-1-
april10.tif
• Black mountain: http://gigapan.com/gigapans/154507
• Player demo
• https://traitcapture.org/timestreams/by-
id/577c7868f7f5660be205ffd0
• Map
• https://www.google.com/maps/d/u/0/edit?mid=1CYARFsRGTvszPKqC
aiBW-tib3nQ
• Plant timestream
• https://traitcapture.org/timestreams/by-
id/57722b4cf7f566640959c908