
Recommended
Recommended
More Related Content
What's hot
What's hot (20)
Similar to High throughput phenotyping
Similar to High throughput phenotyping (20)
Recently uploaded
Recently uploaded (20)
High throughput phenotyping
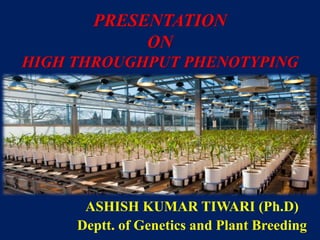
- 1. PRESENTATION ON HIGH THROUGHPUT PHENOTYPING ASHISH KUMAR TIWARI (Ph.D) Deptt. of Genetics and Plant Breeding
- 2. Introduction
- 3. High throughput phenotyping are fully automated facilities in greenhouses or growth chambers with robotics, precise environmental control, and remote sensing techniques to assess plant growth and performance. The Plant Accelerator’s phenotyping capacity, which is built around the LemnaTec Scanalyzer 3D platform, consists of four smart houses; these are fully climate- controlled greenhouses equipped with computer- controlled conveyor belts carrying up to 600 plants per room.
- 4. • Each smart house is linked to one of two imaging halls, within which are five imaging chambers. Cameras in these chambers record images of plants in a range of different wavelengths, from far infrared through to UV-fluorescence, providing a diversity of phenotype information. • Visible cameras quantify overall plant morphology, size, colour, shoot mass and other physical characteristics, near infra-red cameras detect water content of the leaves and soil, far infra-red provides information about leaf temperature and transpiration rate, and UV lighting detects chlorophyll.
- 5. The various parameters are measure includes • Leaf area, • Leaf colour, • Leaf angle • Leaf rolling, • Leaf elongation, • Chlorophyll content, • Stem diameter, • Plant height/width, • Stress pigment concentration, • Tip burn, • Internode length, • Seed number, • Seed size, • Tiller number, • Flowering time, • Germination time etc.
- 6. Steps involved in phenotyping • Plant phenotyping system focusing in the different stage of the plant. • It has the capability to image plants in a greenhouse by automatically moving plants. • Positioning them in front of a stereoscopic camera. • Proprietary software analyzes the images to extract phenotypic-related information.
- 8. Scanning in different wavelength and modes 1. Scanning by visible light (RGB) • High-resolution colour images for comprehensive morphological and growth phenotyping. Under reproducible illumination conditions provide the best basis for comprehensive phenotyping. High-resolution colour images taken from the top and several sides.
- 9. 3.IR infrared light With infrared light, high-throughput 3-D imaging systems provide a unique chance to quantify temperature differences (e. g. within leaves and between plants).
- 10. 3) Fluorescence Imaging Chlorophyll Fluorescence • The light energy absorbed by green plants meets one of the following three fates: (1) One part of this energy is used for electron transport and carbon assimilation (photochemical quenching). (2) Another fraction of the incident light energy is dissipated as heat via the xanthophyll cycle (non-photochemical quenching). (3) Finally, the remainder of light energy is emitted as fluorescence. Fv/Fm intervals during several stages of symptom development in bean plants .
- 11. 4.NIR / RGB Near-infrared (NIR) cameras study water content and movement in leaves and soil. They use light in the NIR region of the spectrum (900–1550 μm) Plants are grown in clear pots so roots can be photographed while the plant is growing. Soil NIR measurements are used to calculate: • how much water the roots remove from the soil. • where and how much water the plant is using.
- 12. • Far infrared (FIR) imaging Cooler plants have better root systems and take up more water.
- 13. Magnetic resonance imaging (MRI) Magnetic resonance imaging (MRI) is used to study plant roots. • MRI uses a magnetic field and radio waves to take images of roots. • MRI allows the 3D geometry of roots to be viewed just as if the plant was growing in the soil.
- 14. Three-dimensional (3D) imaging Digital photos of the top and sides of plants are combined into a 3D image. Measurements that can be taken using a 3D image include: • shoot mass • leaf number, shape and angle • leaf colour • leaf health.
- 15. Image Analysis software LemnaGrid- The image analysis grids combine efficient development in a graphic interface with excellent surveys on image analysis. LemnaMiner- By correlating image analysis data with other experimental data the results are transformed into biologically relevant information for subsequent statistical analysis. LemnaLauncher- Universal interface for machine / analysis / database management of all Scanalyzer systems. LemnaControl- Control center for imaging and plant / data handling, robots and greenhouse logistics.
- 16. LemnaBase- Data handling medium offering consistent and adequate data storage of up to 20 terabyte. LemnaShare- Supervised exchange platform for LemnaTec image analysis Agrids. LemnaCount- Image and data analysis tool for standardised counting and measurement applications. LemnaTrack- Image and data analysis portfolio to identify small organism behaviour and mobility.
- 17. IRGA – Uptake of CO2 can be measured with the means of an IRGA (Infra-Red Gas Analyzer) which can compare the CO2 concentration in gas passing into a chamber surrounding a leaf/plant and the CO2 leaving the chamber. The first hand held photosynthesis measuring device was launched in 1992.
- 18. Mini Plant Photosynthesis Meter The new miniPPM is the third generation of our plant photosynthesis meter. It features the latest innovations in optics and electronics and is based on a new, advanced measuring concept. Electronics innovation and smaller components made it possible to design an entirely new device, much smaller and lighter in weight than previous versions, without compromising on quality and accuracy. Yet the instrument is simple in operation: just press the button and a photosynthesis measurement is completed within a second. Laboratory tests show excellent properties. Measurements are stable and reproducible.
- 19. Canopy sensor:- Chlorophyll concentrations have been measured nondestructively by absorbance methods. A commonly used absorbance chlorophyll meter is the Minolta SPAD-502 meter . Monje and Bugbee (1992) conducted an experiment in which the dual-wave SPAD-502 chlorophyll meter was tested against a custom-built single-wave meter and then destructive colorimetric measurement was performed to find in vitro chlorophyll concentration to compare the absorbance measurements.
- 20. Infrared Thermometer- Infrared thermometers use for monitoring evapotranspiration rates in crops (Stone and Horton, 1974) and in the observation of daily crop temperatures (Blad and Rosenberg, 1976). Leaf and canopy temperatures have been fast and easy to measure with infrared thermometers and have been related to plant water stress.
- 21. Application Plant Phenotyping & Functional Genomics Non-destructive, multispectral plant imaging and comprehensive control of water evaporation/supply allow optimal assessment of GxE impact on phenotypes under stress or natural field conditions. Breeding of new Traits Quantitative phenotype assessment of seed collections/crossing programmes guarantees fast data access, even with complex traits such as drought tolerance. High Content & High Throughput Screening Multi-parameter assessment of a wide range of organisms and assay types across thousands of samples provides a reliable basis for agrochemical/pharmaceutical screening.
- 22. Life Science Research & Drug Discovery Assessment of small organisms (nematodes, fish eggs, parasites) and cell cultures – new prospects for the screening of active ingredients and pharmacological key structures. Quality Control All Scanalyzer hard- and software modules can be customised to target most quality control solutions in agricultural or pharmaceutical applications.
- 23. • Advantages- • Interconnected breeding and trait validation process. • The development of information and data storage technologies, providing suitable tools for the analysis of complex structures of plants. • The need to accelerate breeding. • The impossibility for individual breeders and senior research experts to acquire all important data themselves, in order to keep in control of subjectivity effects. • To quantify more complex traits. • The necessity to spot increasingly smaller differences. • Disadvantages • High developmental cost. • For Image analysis and data interpretation well trained person required.
Editor's Notes
- Notes for teachers This MRI image shows the effect of temperature on root growth. Both the growth rate and formation of lateral roots are affected at the lower temperature.