TraitCapture: NextGen phenomics tools for lab and field [ComBio2015]TimeScience
Presentation given at ComBio2015.
Abstract:
Effectively addressing the environmental, land management and food production challenges of the 21st century requires exponential increases in our ability to understand and model ecosystem and agricultural processes. Lab approaches enable accurate measurement of the genetic and environmental basis of yield and fitness traits. In the field, we can fit models to predict how genotype/environment interactions scale to ecosystems. High-throughput phenomics in the lab can precisely phenotype thousands of plants under simulated climates. Full-genome sequencing and Genome-Wide Association Studies are used to dissect how traits emerge as an interaction between genes and environment. However, this high-dimensional data analysis is challenging and scaling such to the field is difficult. In the field we can use new monitoring technologies (UAVs, sensor networks, etc.) and cloud-based computation to monitor the environment at unprecedented resolutions. But our ability to collect data is rapidly outstripping capacity to visualize and analyzing these data. Lack of data standards and open-source software are a major limiting factor in our ability to effectively make use of complex research data. TraitCapture is an open-source high-throughput phenotyping system combining multispectral lighting and environmental controls simulating regional or climate-shifted growth conditions with real-time phenotyping of 2,000 plants/month. Plant sequence data and phenotypes are co-analyzed with GWAS to identify heritable traits. The Phenomic-Environmental-Sensing-Array (PESA) is a field-based system at the National Arboretum in Canberra, Australia that combines traditional and “NextGen” monitoring (weather, microclimate sensor networks, precision dendrometers, UAV time-lapse imaging, high-density LiDAR, phenocams and gigapixel-resolution time-lapse imaging. The site has biologically significant microclimate variation and a multi-year drought trial. Phenomic and environmental data, combined with tree genomic data, allow us to examine how environment and genetics shape phenotype and how the site microclimate changes with forest maturation. All software tools are web-based, open-source and work with both lab and field datasets.
Gigapixel imaging, ESA Australia, Dec 2012TimeScience
Talk given by Tim Brown at the annual Ecological Society of Australia, 2012 meeting in Melbourne, Australia.
More info on the Gigavision project here:
http://www.gigavision.org
2015 05 Scaling from seeds to ecosystemsTimeScience
A presentation on my work to the Robert Mahony's lab at the ARC Centre of Excellence for Robotic Vision at ANU.
Video here: http://youtu.be/IGPZSZn_zzw
Brief informations on technologies available for high throughput field based phenomics for plant breeding experiments. The instrumentations and technologies presented here are based on the year 2015. Phenomics is expanding area of plant science as more technogies and latest instruments were introduced to the scientific community
New remote and proximal sensing methodologies in high throughput field phenot...CIMMYT
Remote sensing –Beyond images
Mexico 14-15 December 2013
The workshop was organized by CIMMYT Global Conservation Agriculture Program (GCAP) and funded by the Bill & Melinda Gates Foundation (BMGF), the Mexican Secretariat of Agriculture, Livestock, Rural Development, Fisheries and Food (SAGARPA), the International Maize and Wheat Improvement Center (CIMMYT), CGIAR Research Program on Maize, the Cereal System Initiative for South Asia (CSISA) and the Sustainable Modernization of the Traditional Agriculture (MasAgro)
High throughput phenotyping are fully automated facilities in greenhouses or growth chambers with robotics, precise environmental control, and remote sensing techniques to assess plant growth and performance
Cyberinfrastructure Day 2010: Applications in BiocomputingJeremy Yang
UNM Cyberinfrastructure Day 2010 presentation: Applications in Biocomputing, biomedical and cheminformatics research computing cyberinfrastructure issues.
Bio computers use systems of biologically derived molecules—such as DNA and proteins—to perform computational calculations involving storing, retrieving, and processing data. The development of biocomputers has been made possible by the expanding new science of nanobiotechnology.
Affordable field high-throughput phenotyping - some tipsCIMMYT
Remote sensing –Beyond images
Mexico 14-15 December 2013
The workshop was organized by CIMMYT Global Conservation Agriculture Program (GCAP) and funded by the Bill & Melinda Gates Foundation (BMGF), the Mexican Secretariat of Agriculture, Livestock, Rural Development, Fisheries and Food (SAGARPA), the International Maize and Wheat Improvement Center (CIMMYT), CGIAR Research Program on Maize, the Cereal System Initiative for South Asia (CSISA) and the Sustainable Modernization of the Traditional Agriculture (MasAgro)
An Aerial Remote Sensing Platform for High Throughput Phenotyping of Genetic ...CIMMYT
Remote sensing –Beyond images
Mexico 14-15 December 2013
The workshop was organized by CIMMYT Global Conservation Agriculture Program (GCAP) and funded by the Bill & Melinda Gates Foundation (BMGF), the Mexican Secretariat of Agriculture, Livestock, Rural Development, Fisheries and Food (SAGARPA), the International Maize and Wheat Improvement Center (CIMMYT), CGIAR Research Program on Maize, the Cereal System Initiative for South Asia (CSISA) and the Sustainable Modernization of the Traditional Agriculture (MasAgro)
Do you work with big data? Do you need to share your data and analyses with collaborators at multiple institutions? Does it take days to run your analyses on your laptop? The iPlant Collaborative (http://www.iplantcollaborative.org/) provides free cyberinfrastructure to biologists to address these very challenges. We are an NSF-funded initiative with the mission to facilitate the transformation of life sciences research and education by providing the computing infrastructure and expertise needed to answer biological questions that were previously difficult or impossible to address. Despite the name, iPlant’s scope includes any life sciences research, be it genomics or ecology; in plants, animals, or microbes; from single-researcher investigations to community-wide collaborations. Our cyberinfrastructure is suitable for ecological research that requires access to shared data storage, very large data sets, high performance computing, or cloud computing. iPlant also provides a platform for developers and informaticians to share their tools with the ecological community.
This presentation will provide an overview of the tools and services available through iPlant, with an emphasis on their utility to ecologists and ecological informaticians. These include: data storage, sharing, and metadata mark-up via the iPlant Data Store; data publishing and discovery through the iPlant Data Commons; cloud-based computing through Atmosphere; web-based access to dozens of applications through the Discovery Environment; iPlant Application Programming Interfaces (APIs); an image management and analysis system with a high performance computing back-end (Bisque); access to high-resolution global environmental layers; and educational and training resources. Projects that use iPlant’s infrastructure will be touched upon, including the iMicrobe project. iPlant’s flexible, open-source architecture should be of interest to anyone who needs to organize and analyze very large data sets, is using genomic or metagenomic methods to address ecological questions, or is developing or using ecological models that require large memory or parallel computations.
Thrive:Timely Health Indicators Using Remote Sensing & innovation for the Vit...US-Ignite
Prevention is better than a cure, so a timely alert could preclude a trip to the ER for the 25 million Americans who have Asthma. This technology could benefit all people with environmentally triggered health conditions and supply forecasts to ER and walk in clinic managers, David Lary, University of Texas at Dallas and York Eggleston, Machine Data Learning.
From pixels to point clouds - Using drones,game engines and virtual reality t...ARDC
Presentation by Dr Tim Brown
Full webinar: https://www.youtube.com/watch?v=bl_7ClXhQlA&list=PLG25fMbdLRa5qsPiBGPaj2NHqPyG8X435&index=11
Individual snippet:https://youtu.be/PVf4zYNJlmM?list=PLG25fMbdLRa5qsPiBGPaj2NHqPyG8X435
Automated models for rapid data insights
Environmental modeling is crucial for making decisions or understanding what’s happening in the field, but it can be an extremely complex and manual process. Not anymore. Forget endless spreadsheets, equations, and long hours of post processing. ZENTRA Cloud now includes environmental models—so the information you need to make sense of your data can be instantly visualized on a daily basis.
Environmental modeling made easy
Growing degree days, daily light integral, evapotranspiration, and more! We made the models. Now you can use them. Discover the magic behind the models, how ZENTRA Cloud simplifies and automates the process, and how researchers are using these models in their unique applications. Topics covered:
An introduction and some of the scientific methods behind popular ZENTRA Cloud models
Plant available water
Evapotranspiration (ET)
Daily light integral
Daily light photoperiod
Growing degree days
Modified chill hours
Case studies: How people are using these models in their research
Improving Animal Model Translation, Welfare, and Operational Efficiency with ...InsideScientific
To learn more and watch the webinar, go to:
https://insidescientific.com/webinar/improving-animal-model-translation-welfare-and-operational-efficiency-with-appropriate-housing-and-infrastructure-design/
In this webinar, John Hasenau, DVM and Jeffrey Zynda consider practical options for housing and infrastructural designs to sustainably improve animal welfare, data reporting and reproducibility through the use of new technologies used by academia, pharma and CROs to acquire animal activity data.
They also present examples of the practical application of digital information across a global organization and within a unit, and its effects on study reproducibility, on scientific results for PIs and on lab animal facility management. Differences in cage components, housing density, cage changing frequency and best practices are discussed in the context of animal model development, physiology and behavior. This webinar is applicable to all individuals engaged in research involving animal models.
Key Topics Include:
- A review of recent housing and equipment developments that improve repeatability and rigor of the data reporting
- The impact of environmental conditions on animal research models
- Next-generation strategies to maximize laboratory space efficiency, flexibility and productivity
- The value of digitalization from an architecture point of view in a LAS Facility
- Strategies to select the right equipment for your research objectives
A Presentation created to introduce Year 9 Students to environmental monitoring, Surveillance monitoring as a type of monitoring, and Ausplots as a surveillance monitoring program.
08.04.14
Invited Talk
National Astrobiology Institute Executive Council Meeting
Astrobiology Science Conference 2008
Santa Clara Convention Center
Title: High Performance Collaboration
Santa Clara, CA
Crowdsourcing Biodiversity Monitoring: How Sharing your Photo Stream can Sust...maranlar
Paper at the ACM Multimedia 2016 Brave New Ideas Session on Societal Impact of Multimedia Research:
Alexis Joly, Hervé Goëau, Julien Champ, Samuel Dufour-Kowalski, Henning Müller, and Pierre Bonnet. 2016. Crowdsourcing Biodiversity Monitoring: How Sharing your Photo Stream can Sustain our Planet. In Proceedings of the 2016 ACM on Multimedia Conference (MM '16). ACM, New York, NY, USA, 958-967.
Paper: https://hal-lirmm.ccsd.cnrs.fr/hal-01373762/document
Pl@ntNet app:
https://play.google.com/store/apps/details?id=org.plantnet&hl=en
Developing high yielding varieties adapted to changing environmental conditions and new agronomic management practices is an urgent priority to match the predicted demand for food and biomass in 2050. To identify a new commercial variety and optimise its productivity, a typical breeding program has to screen the performance of thousands of genotypes under a variety of environmental and management conditions. Only through a quantitative analysis of plant phenotypes in response to the environment and management practices (P=GxExM) will a geneticist be able to generate the link to the genotype and identify the causal polymorphisms in the genome that can be used in the breeder’s selection process. While significant progress has been made by public research institutions to develop high-throughput phenotyping tools and sensor networks to digitise plants and measure dynamically the environment, the automated quantitative analysis of the phenotype, i.e. extracting information from the raw data and deriving knowledge from it, has become a major bottleneck and is today preventing wide adoption of these tools in breeding companies or Agribusiness industries.
My talk will present our approach to building an Australian analytics infrastructure to address this bottleneck while illustrating at the same time our effort to translating the research tools into products for use by the Agribusiness sector. The opportunities to apply modelling approaches to integrate the information extracted at multiple temporal and spatial scales from state-of-the-art phenotyping technologies will also be explored in a move towards a revolution in plant biology.
THE IMPORTANCE OF MARTIAN ATMOSPHERE SAMPLE RETURN.Sérgio Sacani
The return of a sample of near-surface atmosphere from Mars would facilitate answers to several first-order science questions surrounding the formation and evolution of the planet. One of the important aspects of terrestrial planet formation in general is the role that primary atmospheres played in influencing the chemistry and structure of the planets and their antecedents. Studies of the martian atmosphere can be used to investigate the role of a primary atmosphere in its history. Atmosphere samples would also inform our understanding of the near-surface chemistry of the planet, and ultimately the prospects for life. High-precision isotopic analyses of constituent gases are needed to address these questions, requiring that the analyses are made on returned samples rather than in situ.
This pdf is about the Schizophrenia.
For more details visit on YouTube; @SELF-EXPLANATORY;
https://www.youtube.com/channel/UCAiarMZDNhe1A3Rnpr_WkzA/videos
Thanks...!
This presentation explores a brief idea about the structural and functional attributes of nucleotides, the structure and function of genetic materials along with the impact of UV rays and pH upon them.
Cancer cell metabolism: special Reference to Lactate PathwayAADYARAJPANDEY1
Normal Cell Metabolism:
Cellular respiration describes the series of steps that cells use to break down sugar and other chemicals to get the energy we need to function.
Energy is stored in the bonds of glucose and when glucose is broken down, much of that energy is released.
Cell utilize energy in the form of ATP.
The first step of respiration is called glycolysis. In a series of steps, glycolysis breaks glucose into two smaller molecules - a chemical called pyruvate. A small amount of ATP is formed during this process.
Most healthy cells continue the breakdown in a second process, called the Kreb's cycle. The Kreb's cycle allows cells to “burn” the pyruvates made in glycolysis to get more ATP.
The last step in the breakdown of glucose is called oxidative phosphorylation (Ox-Phos).
It takes place in specialized cell structures called mitochondria. This process produces a large amount of ATP. Importantly, cells need oxygen to complete oxidative phosphorylation.
If a cell completes only glycolysis, only 2 molecules of ATP are made per glucose. However, if the cell completes the entire respiration process (glycolysis - Kreb's - oxidative phosphorylation), about 36 molecules of ATP are created, giving it much more energy to use.
IN CANCER CELL:
Unlike healthy cells that "burn" the entire molecule of sugar to capture a large amount of energy as ATP, cancer cells are wasteful.
Cancer cells only partially break down sugar molecules. They overuse the first step of respiration, glycolysis. They frequently do not complete the second step, oxidative phosphorylation.
This results in only 2 molecules of ATP per each glucose molecule instead of the 36 or so ATPs healthy cells gain. As a result, cancer cells need to use a lot more sugar molecules to get enough energy to survive.
introduction to WARBERG PHENOMENA:
WARBURG EFFECT Usually, cancer cells are highly glycolytic (glucose addiction) and take up more glucose than do normal cells from outside.
Otto Heinrich Warburg (; 8 October 1883 – 1 August 1970) In 1931 was awarded the Nobel Prize in Physiology for his "discovery of the nature and mode of action of the respiratory enzyme.
WARNBURG EFFECT : cancer cells under aerobic (well-oxygenated) conditions to metabolize glucose to lactate (aerobic glycolysis) is known as the Warburg effect. Warburg made the observation that tumor slices consume glucose and secrete lactate at a higher rate than normal tissues.
Slide 1: Title Slide
Extrachromosomal Inheritance
Slide 2: Introduction to Extrachromosomal Inheritance
Definition: Extrachromosomal inheritance refers to the transmission of genetic material that is not found within the nucleus.
Key Components: Involves genes located in mitochondria, chloroplasts, and plasmids.
Slide 3: Mitochondrial Inheritance
Mitochondria: Organelles responsible for energy production.
Mitochondrial DNA (mtDNA): Circular DNA molecule found in mitochondria.
Inheritance Pattern: Maternally inherited, meaning it is passed from mothers to all their offspring.
Diseases: Examples include Leber’s hereditary optic neuropathy (LHON) and mitochondrial myopathy.
Slide 4: Chloroplast Inheritance
Chloroplasts: Organelles responsible for photosynthesis in plants.
Chloroplast DNA (cpDNA): Circular DNA molecule found in chloroplasts.
Inheritance Pattern: Often maternally inherited in most plants, but can vary in some species.
Examples: Variegation in plants, where leaf color patterns are determined by chloroplast DNA.
Slide 5: Plasmid Inheritance
Plasmids: Small, circular DNA molecules found in bacteria and some eukaryotes.
Features: Can carry antibiotic resistance genes and can be transferred between cells through processes like conjugation.
Significance: Important in biotechnology for gene cloning and genetic engineering.
Slide 6: Mechanisms of Extrachromosomal Inheritance
Non-Mendelian Patterns: Do not follow Mendel’s laws of inheritance.
Cytoplasmic Segregation: During cell division, organelles like mitochondria and chloroplasts are randomly distributed to daughter cells.
Heteroplasmy: Presence of more than one type of organellar genome within a cell, leading to variation in expression.
Slide 7: Examples of Extrachromosomal Inheritance
Four O’clock Plant (Mirabilis jalapa): Shows variegated leaves due to different cpDNA in leaf cells.
Petite Mutants in Yeast: Result from mutations in mitochondrial DNA affecting respiration.
Slide 8: Importance of Extrachromosomal Inheritance
Evolution: Provides insight into the evolution of eukaryotic cells.
Medicine: Understanding mitochondrial inheritance helps in diagnosing and treating mitochondrial diseases.
Agriculture: Chloroplast inheritance can be used in plant breeding and genetic modification.
Slide 9: Recent Research and Advances
Gene Editing: Techniques like CRISPR-Cas9 are being used to edit mitochondrial and chloroplast DNA.
Therapies: Development of mitochondrial replacement therapy (MRT) for preventing mitochondrial diseases.
Slide 10: Conclusion
Summary: Extrachromosomal inheritance involves the transmission of genetic material outside the nucleus and plays a crucial role in genetics, medicine, and biotechnology.
Future Directions: Continued research and technological advancements hold promise for new treatments and applications.
Slide 11: Questions and Discussion
Invite Audience: Open the floor for any questions or further discussion on the topic.
(May 29th, 2024) Advancements in Intravital Microscopy- Insights for Preclini...Scintica Instrumentation
Intravital microscopy (IVM) is a powerful tool utilized to study cellular behavior over time and space in vivo. Much of our understanding of cell biology has been accomplished using various in vitro and ex vivo methods; however, these studies do not necessarily reflect the natural dynamics of biological processes. Unlike traditional cell culture or fixed tissue imaging, IVM allows for the ultra-fast high-resolution imaging of cellular processes over time and space and were studied in its natural environment. Real-time visualization of biological processes in the context of an intact organism helps maintain physiological relevance and provide insights into the progression of disease, response to treatments or developmental processes.
In this webinar we give an overview of advanced applications of the IVM system in preclinical research. IVIM technology is a provider of all-in-one intravital microscopy systems and solutions optimized for in vivo imaging of live animal models at sub-micron resolution. The system’s unique features and user-friendly software enables researchers to probe fast dynamic biological processes such as immune cell tracking, cell-cell interaction as well as vascularization and tumor metastasis with exceptional detail. This webinar will also give an overview of IVM being utilized in drug development, offering a view into the intricate interaction between drugs/nanoparticles and tissues in vivo and allows for the evaluation of therapeutic intervention in a variety of tissues and organs. This interdisciplinary collaboration continues to drive the advancements of novel therapeutic strategies.
Nutraceutical market, scope and growth: Herbal drug technologyLokesh Patil
As consumer awareness of health and wellness rises, the nutraceutical market—which includes goods like functional meals, drinks, and dietary supplements that provide health advantages beyond basic nutrition—is growing significantly. As healthcare expenses rise, the population ages, and people want natural and preventative health solutions more and more, this industry is increasing quickly. Further driving market expansion are product formulation innovations and the use of cutting-edge technology for customized nutrition. With its worldwide reach, the nutraceutical industry is expected to keep growing and provide significant chances for research and investment in a number of categories, including vitamins, minerals, probiotics, and herbal supplements.
Professional air quality monitoring systems provide immediate, on-site data for analysis, compliance, and decision-making.
Monitor common gases, weather parameters, particulates.
What is greenhouse gasses and how many gasses are there to affect the Earth.moosaasad1975
What are greenhouse gasses how they affect the earth and its environment what is the future of the environment and earth how the weather and the climate effects.
Multi-source connectivity as the driver of solar wind variability in the heli...Sérgio Sacani
The ambient solar wind that flls the heliosphere originates from multiple
sources in the solar corona and is highly structured. It is often described
as high-speed, relatively homogeneous, plasma streams from coronal
holes and slow-speed, highly variable, streams whose source regions are
under debate. A key goal of ESA/NASA’s Solar Orbiter mission is to identify
solar wind sources and understand what drives the complexity seen in the
heliosphere. By combining magnetic feld modelling and spectroscopic
techniques with high-resolution observations and measurements, we show
that the solar wind variability detected in situ by Solar Orbiter in March
2022 is driven by spatio-temporal changes in the magnetic connectivity to
multiple sources in the solar atmosphere. The magnetic feld footpoints
connected to the spacecraft moved from the boundaries of a coronal hole
to one active region (12961) and then across to another region (12957). This
is refected in the in situ measurements, which show the transition from fast
to highly Alfvénic then to slow solar wind that is disrupted by the arrival of
a coronal mass ejection. Our results describe solar wind variability at 0.5 au
but are applicable to near-Earth observatories.
Multi-source connectivity as the driver of solar wind variability in the heli...
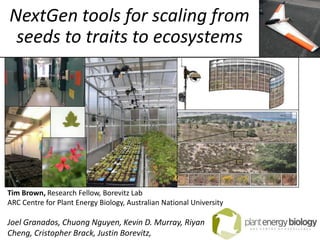
2015-08-13 ESA: NextGen tools for scaling from seeds to traits to ecosystems
1. NextGen tools for scaling from
seeds to traits to ecosystems
Tim Brown, Research Fellow, Borevitz Lab
ARC Centre for Plant Energy Biology, Australian National University
Joel Granados, Chuong Nguyen, Kevin D. Murray, Riyan
Cheng, Cristopher Brack, Justin Borevitz,
2. In the next 100 years we will face challenges of
unprecedented scale and complexity
3. Humans are causing a 6th mass extinction
Since 1500, ~30 -90% species declines globally 1,2
1) Dirzo, Rodolfo, et al. 2014. DOI: 10.1126/science.1251817
2) http://worldoceanreview.com/en/wor-2/fisheries/state-of-fisheries-worldwide/
4. More than 7 billion people
on the planet for the next 100 years
• >10 billion people on the planet by 2050
5. Feeding 10 billion people will be very hard
• We must grow more food in the next 75 years than all the food
produced in human history 1
• Requires a 38% greater yield increase over historical gains, every year
for the next 40 years2
1) “Seeds of Doubt” New Yorker, Aug 25, 2014
2) Tester & LeGrange. 2010. Science:327(818)
6. Terraforming
“To alter the environment of a planet to make it capable
of supporting terrestrial life forms.”
We are currently unterraforming the earth at an exceptionally fast rate
To meet the challenges of the coming century we need to restore and
re-engineer the environment to support >7 billion people for the next
100 years in the face of climate change, while maintaining biodiversity
and ecosystem services
These ecological challenges are too hard to be solved
with existing data and methods
8. Research focus
How can we use new technology to quantify environmental
processes in high resolution for scientists (and the public) in a
format that they can use?
(1) Lab phenomics
• “Phenotype” (plant behaviors) + “Genomics” (plant genomes)
• Identifying the genetic basis of plant growth and development
(2) Field ecology
• High resolution monitoring of ecosystems
9. Genotype x Environment = Phenotype
Phenotype (and ecosystem function) emerges as a cross-scale
interaction between genotypes and the environment they experience.
The degree to which we can measure all three components is the
degree to which we can understand ecosystem function
Requires LOTS of complex data!
10. The challenge – Measure everything all the time
How do we go from doing the science at
the scale of one point per forest to
multilayer data cubes for every tree or
leaf?
10/
20
11. This isn’t impossible
• Google didn’t exit 17 yrs ago and now it indexes 30 trillion
web pages
• You can now ASK google almost anything and get a pretty
good answer
• 1.8 billion (mostly geolocated) images are uploaded to
social media every day (2014; was 500m in 2013)1
We need this level of resolution (and google-like tools) for
ecological knowledge
1. Meeker, 2013, 2014
12. Lab vs field phenotyping
Lab: High precision measurement and control but low realism
youtu.be/d3vUwCbpDk0
13. Lab vs field phenotyping
Field: Realistic environment but low precision measurements
In the field we have real environments but the complexity (and bad lighting!) reduces
our ability to measure things with precision
youtu.be/gFnXXT1d_7s
14. Lab phenotyping
Normal lab growth conditions aren’t very “natural”
Kulheim, Agren, and Jansson 2002
Real World
Growth Chamber
16. Growth cabinets with dynamic “semi-realistic” environmental &
lighting conditions
• 8 & 10-band controllable LED lights to control light spectra, intensity
• Python scripts control chamber Temp/Humidity in 5 min intervals
• Grow plants in simulated regional/seasonal conditions & simulate climate
• E.g. coastal vs inland | Late Spring or Early Fall
• Expose “cryptic” phenotypes
• Repeat environmental conditions
• Between studies and collaborators
• Simulate live field site climate
SpectralPhenoClimatron (SPC)
Spectral response of Heliospectra LEDs. (L4A s20: 10-band)
17. Real-time monitoring, analysis and data visualization
• Phenotype 2,000 plants in real-time 24/7
• 2 DSLR cameras / chamber * 7 chambers
• JPG + RAW imaging every 10 minutes processing server
• Automated Image analysis pipeline to extract
growth data from 150,000 pot images a day
• Detect color checker
• Correct color and lens distortion
• Detect pots
• Segment each image
• Leaf detection and tracking
Corrected
Segmented
Original
18.
19. Goal: High Throughput Phenotyping for the masses
Most high throughput phenotyping systems cost millions of $$
Our system:
• Low cost:
• Off the shelf cameras controlled by $35 linux pc’s (<$5K/chamber)
• Online project management, visualization and analysis tool
• Open source, cloud-based analysis & bioinformatics pipelines
• “Develop once and everyone can use it”
20. NextGen Field Ecology – Where’s my PCR?
• Field ecology is like genetics before PCR and high throughput
sequencing
• Back in the ’80s & early 90s people would get a PhD just sequencing
a single gene.
• Humane Genome Project cost $2.7billion USD and took 13 years
• Now (20 years in) we buy sequencing machines on eBay and light
sequence whole genomes for <$50 a plant in just a few weeks
21. Genetics -> Genomics -> Phenomics
20 years of technical advances have turned genetics into genomics into
phenomics and yielded the ability to address fundamental and very
complex questions
Now state of the art phenomics is pretty high resolution
• Precision environmental controls
• 3D time-lapse models of every plant growing with each pixel in all
spectra mapped to the 3D “data cube” model of each plant
• Genome sequence for every plant
• Automated bioinformatics pipeline for trait extraction
22. The real world is way more complex than plants in the lab
We need equally complex datasets and models to
understand real world ecosystems
• The questions we ask have often been defined more by what data
we can get than by what the best question would be
23. So how do we measure everything all the time?
• Persistent 3D, time-series multi data-layer ecosystem
models tracking every tree
24. “NextGen” field monitoring
Within 5-10 years we will have similar data to lab phenomics
• Automated time-series (weekly/daily) aerial (UAV) scans measure
• RGB; Hyperspectral; Thermal; LiDAR
• Centimeter resolution 3D model of every tree on field site
• Gigapixel imaging to track phenology in every tree/plant, hourly
• Automated computer visions analysis for change detection
• LIDAR (laser) scanning
• DWEL / Zebedee – high resolution ground-based 3D scans
• Dense point clouds of 3D structure
• Microclimate sensor networks
• PAR
• Temp, Humidity
• Soil moisture @ multiple depths
• mm resolution dendrometers
• Full genome for every tree on site (<$5/tree)
Environment
Phenotype
Genetics
25. National Arboretum Phenomic & Environmental Sensor Array
National Arboretum, Canberra, Australia
ANU Major Equipment Grant, 2014
Collaboration with:
• Cris Brack and Albert Van Dijk (ANU Fenner school) ; Borevitz Lab
26. National Arboretum Phenomic & Environmental Sensor Array
• Ideal location
• 5km from ANU (64 Mbps wifi) and near many research institutions
• Forest is only ~4 yrs old
• Chance to monitor it from birth into the future!
• Great site for testing experimental monitoring systems prior to
more remote deployments
26/
20
27. National Arboretum Sensor Array
• 20-node Wireless mesh sensor network (10min sample interval)
• Temp, Humidity
• Sunlight (PAR)
• Soil Temp and moisture @ 20cm depth
• uM resolution denrometers on 20 trees
• Two Gigapixel timelapse cameras:
• Leaf/growth phenology for > 1,000 trees
• Campbell weather stations (baseline data for verification)
• All data live online in realtime
• LIDAR: DWEL / Zebedee
• UAV overflights (bi-weekly/monthly)
• Georectified image layers
• High resolution DEM
• 3D point cloud of site in time-series
Total Cost ~<$250K AUD
33. Low cost sequencing let’s us genotype every individual tree and identify genetic loci that correlate
with observed phenotypic differences between trees.
We can do this for all trees at the arboretum within view of the camera.
Fall Color change shows differing rates of fall senescence in trees
Late fall
34. UAV’s (drones) for monitoring
• $2-4K airframe (DJI, Aeronavics) + 10-20MP digital
camera (~1kg payload)
• Processing software $700 - 2,000 USD (Agisoft; Pix4D)
• 3D models of field site (cm resolutions are possible)
• Orthorectified image and map layers
• LAS / point cloud data
• Automated pipeline: Flight -> tree data
• Tree Height; Volume, foliage density
• RGB color
• GPS location
• DEM of site
34/
20
View 3D model online:
http://bit.ly/ARB3Dv1
35. Software outputs DEM and point cloud data
• Processing script for tree data:
• GPS, Height, 3D volume, top-down area, RGB phenology data
• Straight to google maps online
36. Ultra-high resolution ground-based laser
• DWEL (CSIRO); Echidna (handheld; $25K LiDAR)
• Multiband Lidar with full point returns
• ~30 million points in a 50m2 area (vs 5-10 pts/m for aerial)
Data: Michael.Schaefer@csiro.au
38. So what do we do with all this data?
The challenge is no longer to gather the data, the challenge is how
we do science with the data once we have it
• A sample is no longer a data point
• Example: Gigavision data
Sample:
• Camera hardware: 900 images (per hour)
• Automate stitching into panoramas (5-20,000 tiled images/pano/hr)
• Need to align time-series images to each other and to the real world
(despite hardware failures, camera upgrades)
• How to visualize a time-series of 22 million images/year?
• Computer vision analysis
• Automated feature detection and phenophase detections
To Data:
• “Phenophase” transition and growth data from 1,000 trees
• And then how do you even analyze that?!
39. Virtual 3D Arboretum Project
• Goal:
• Use modern gaming software to explore new methods for
visualizing time-series environmental data
• Historic and real-time data layers integrated into persistent 3D
model of the national arboretum in the Unreal gaming engine
• Collaboration with
• ANU Computer Science Dept. TechLauncher students
• Stuart Ramsden, ANU VISlab
40.
41. Tips for managing big data
1. This is hard! Don’t feel bad. No one else has much of an idea how
to do it either.
2. Where we are now in dealing with big data is like dealing with
numbers before excel
3. Learn to program; hire computer scientists whenever possible
4. Collaborate but don’t be afraid to make executive decisions:
1. There are many ways to solve the same problem
5. Make a robust data management plan; don’t collect data until you
have a plan to organize it
1. BUT don’t be afraid to jump in and fail. Learning is iterative and there aren’t
actually consensual solutions to most of these problems yet
6. Virtual machines and cloud storage are your friends
1. Don’t manage any hardware you don’t have to
2. Convince your university to invest in computing infrastructure and good IT
support
7. Share code – If you solve a problem give the solution to others!
42. Thanks and Contacts
Justin Borevitz – Lab Leader Lab web page: http://borevitzlab.anu.edu.au
• Funding:
• Arboretum ANU Major Equipment Grant
• ARC Center of Excellence in Planet Energy Biology | ARC Linkage 2014
• Arboretum
• http://bit.ly/PESA2014
• Cris Brack, Albert VanDijk, Justin Borevitz (PESA Project PI’s)
• UAV data: Darrell Burkey, ProUAV
• 3D site modelling:
• Pix4D.com / Zac Hatfield Dodds / ANUVR team
• Dendrometers & site infrastructure
• Darius Culvenor: Environmental Sensing Systems
• Mesh sensors: EnviroStatus, Alberta, CA
• ANUVR Team
• Zena Wolba; Alex Alex Jansons; Isobel Stobo; David Wai
• TraitCapture:
• Chuong Nguyen; Joel Granados; Kevin Murray; Gareth Dunstone; Jiri Fajkus
• Pip Wilson; Keng Rugrat; Borevitz Lab
• Contact me:
• tim.brown@anu.edu.au
• http://bit.ly/Tim_ANU
http://github.com/borevitzlab