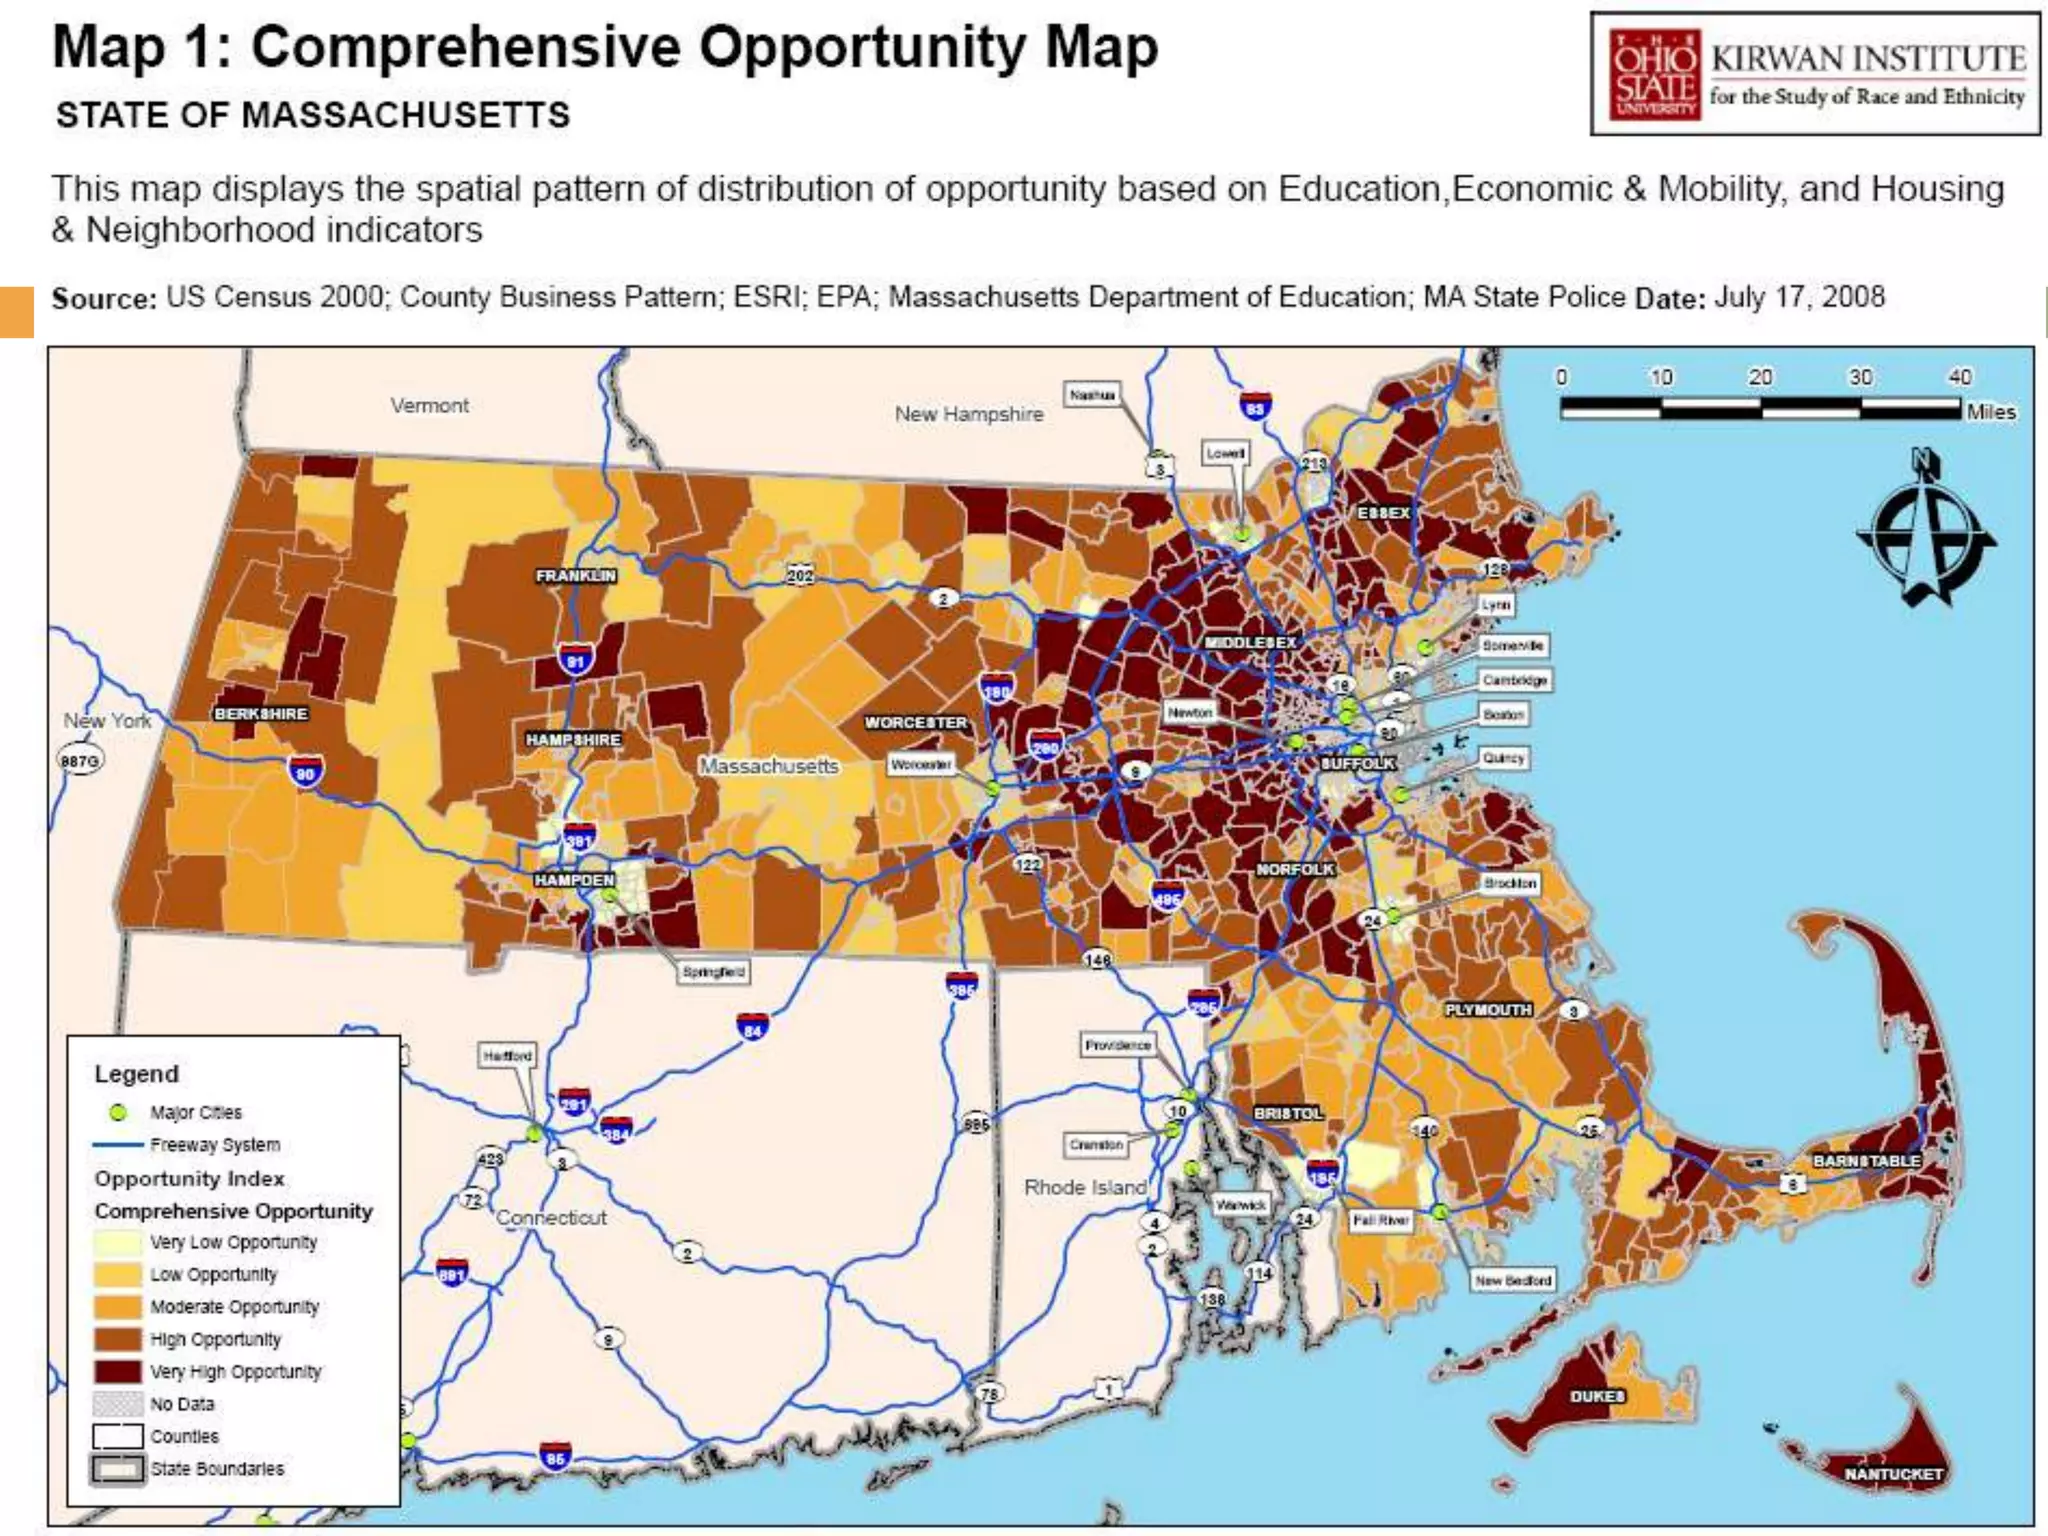
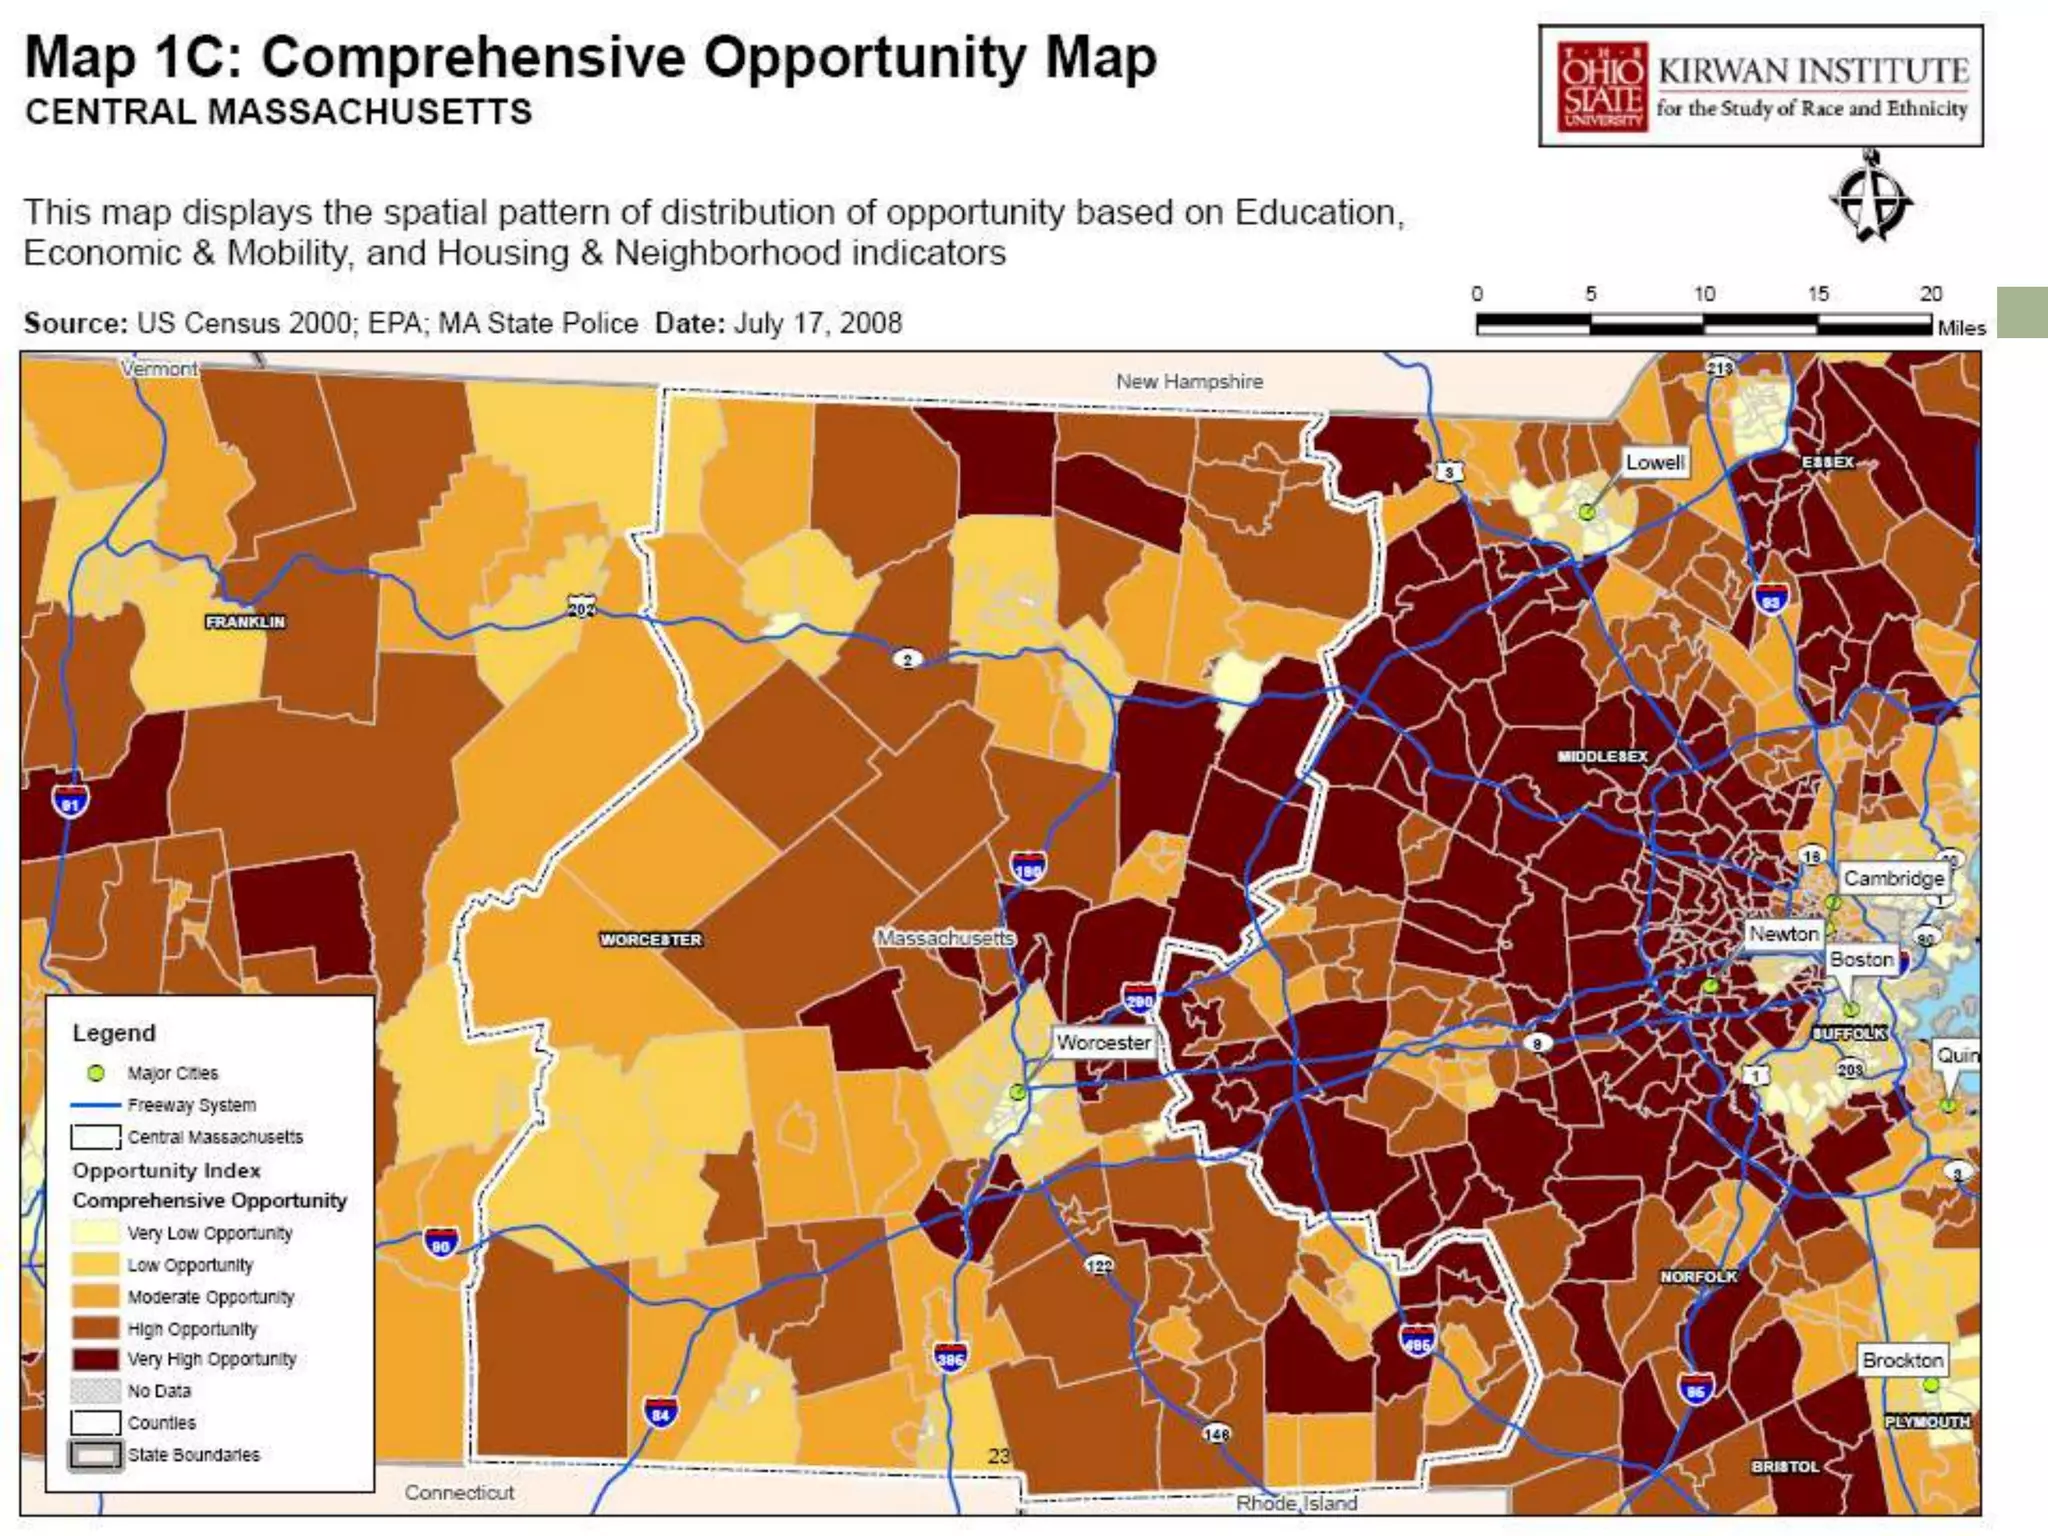
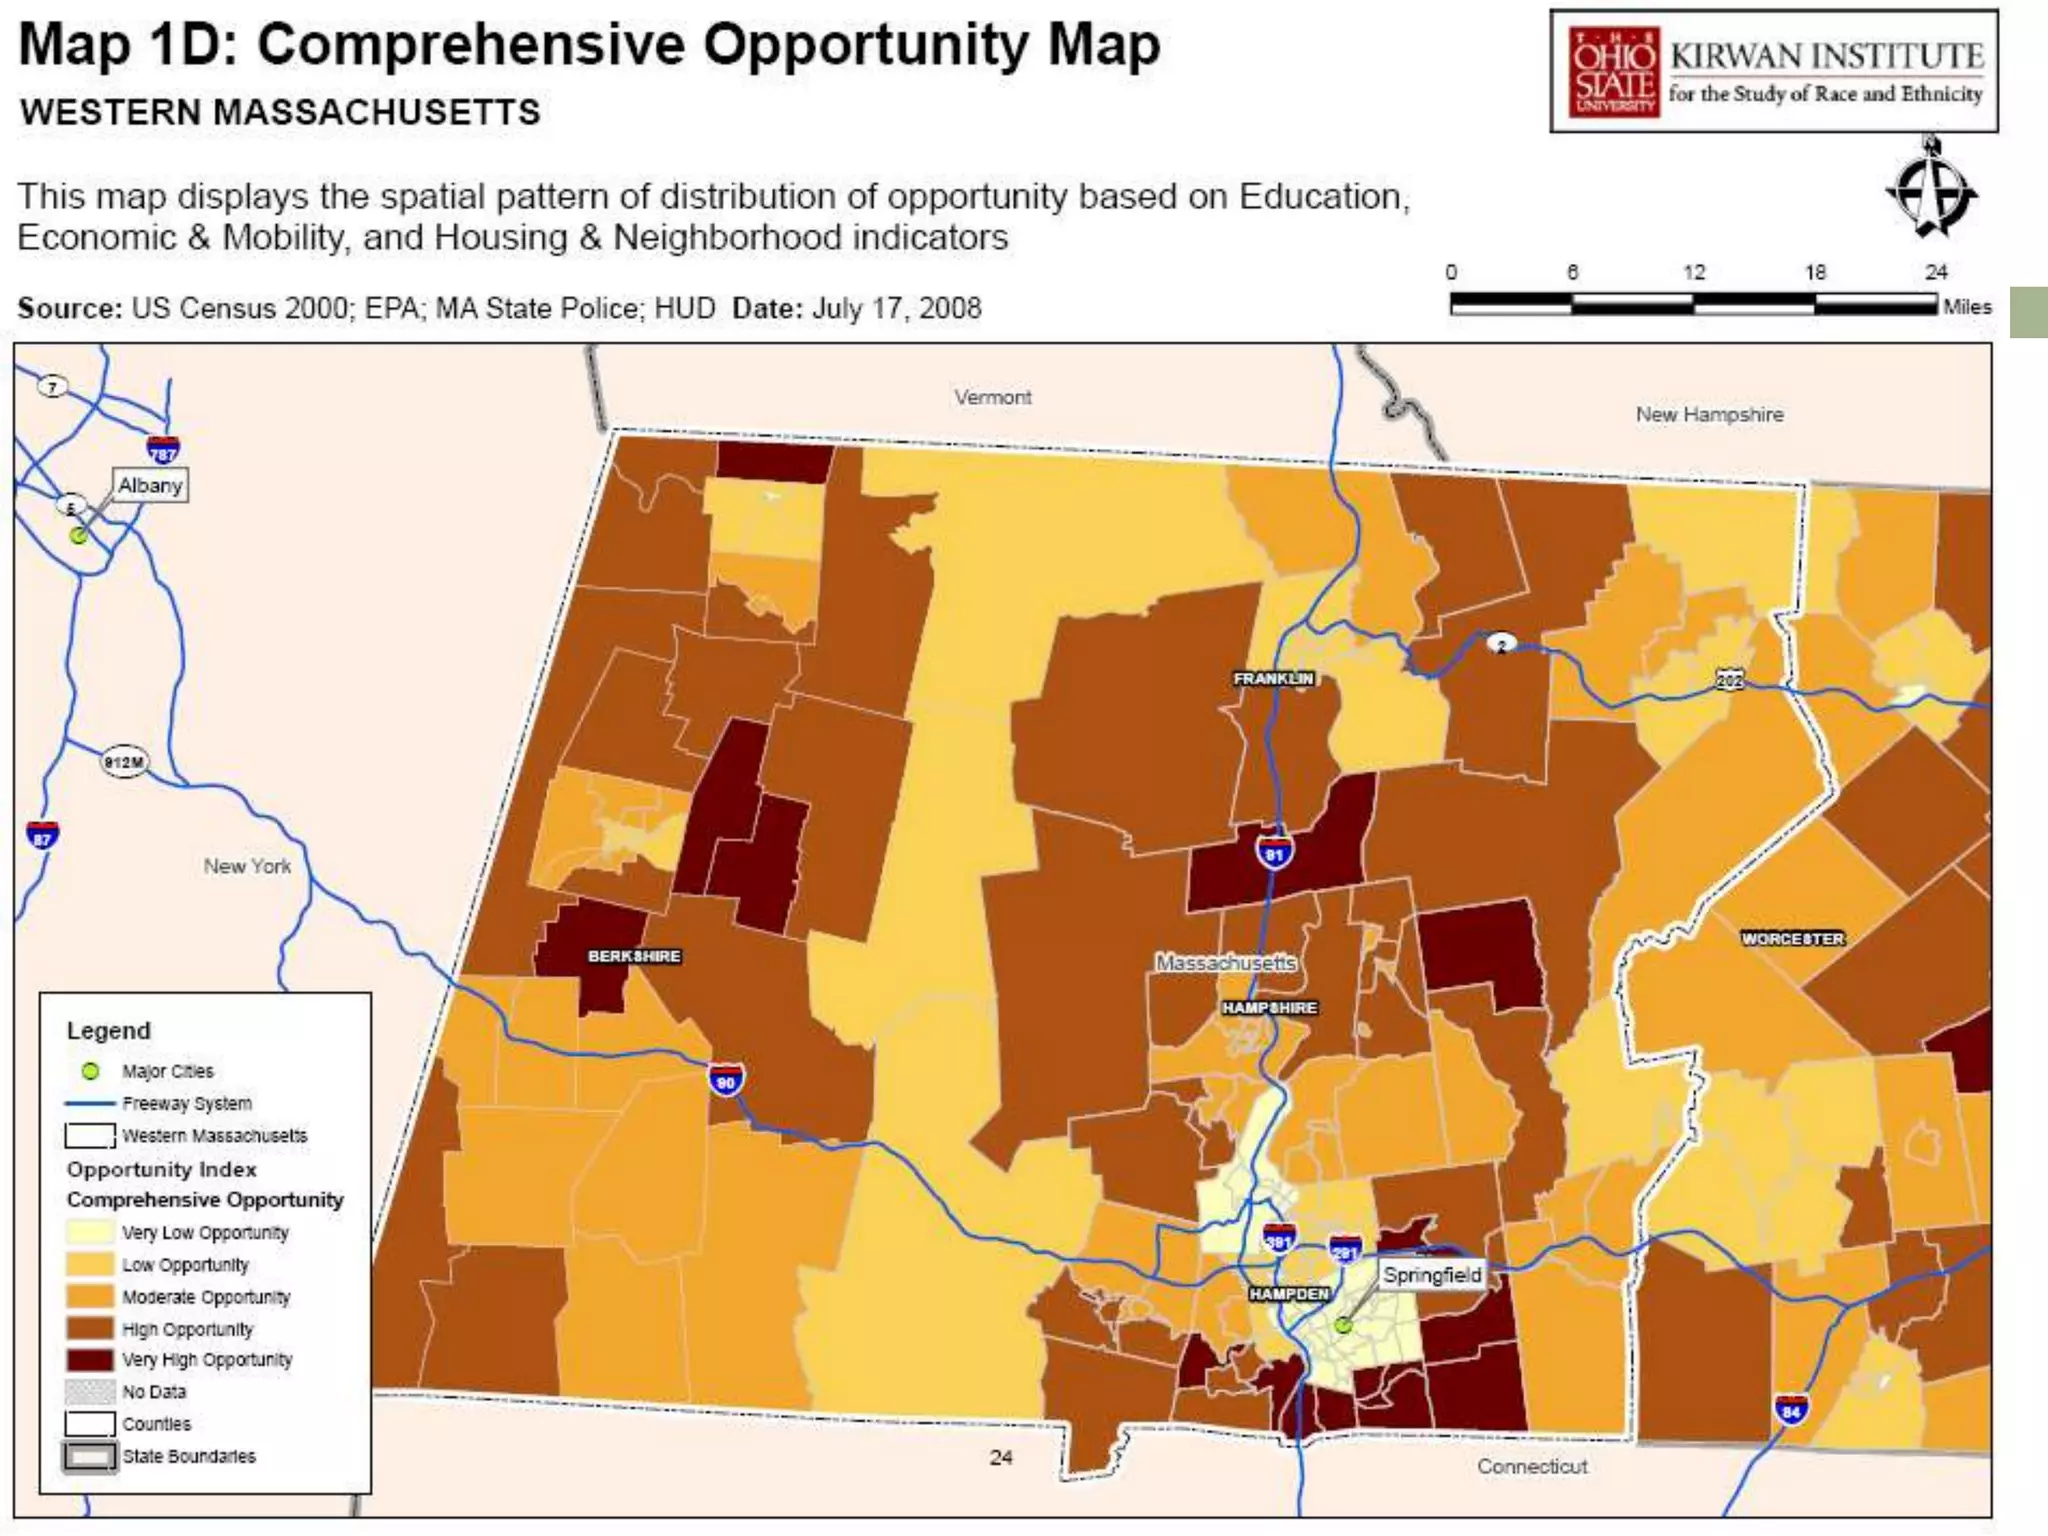
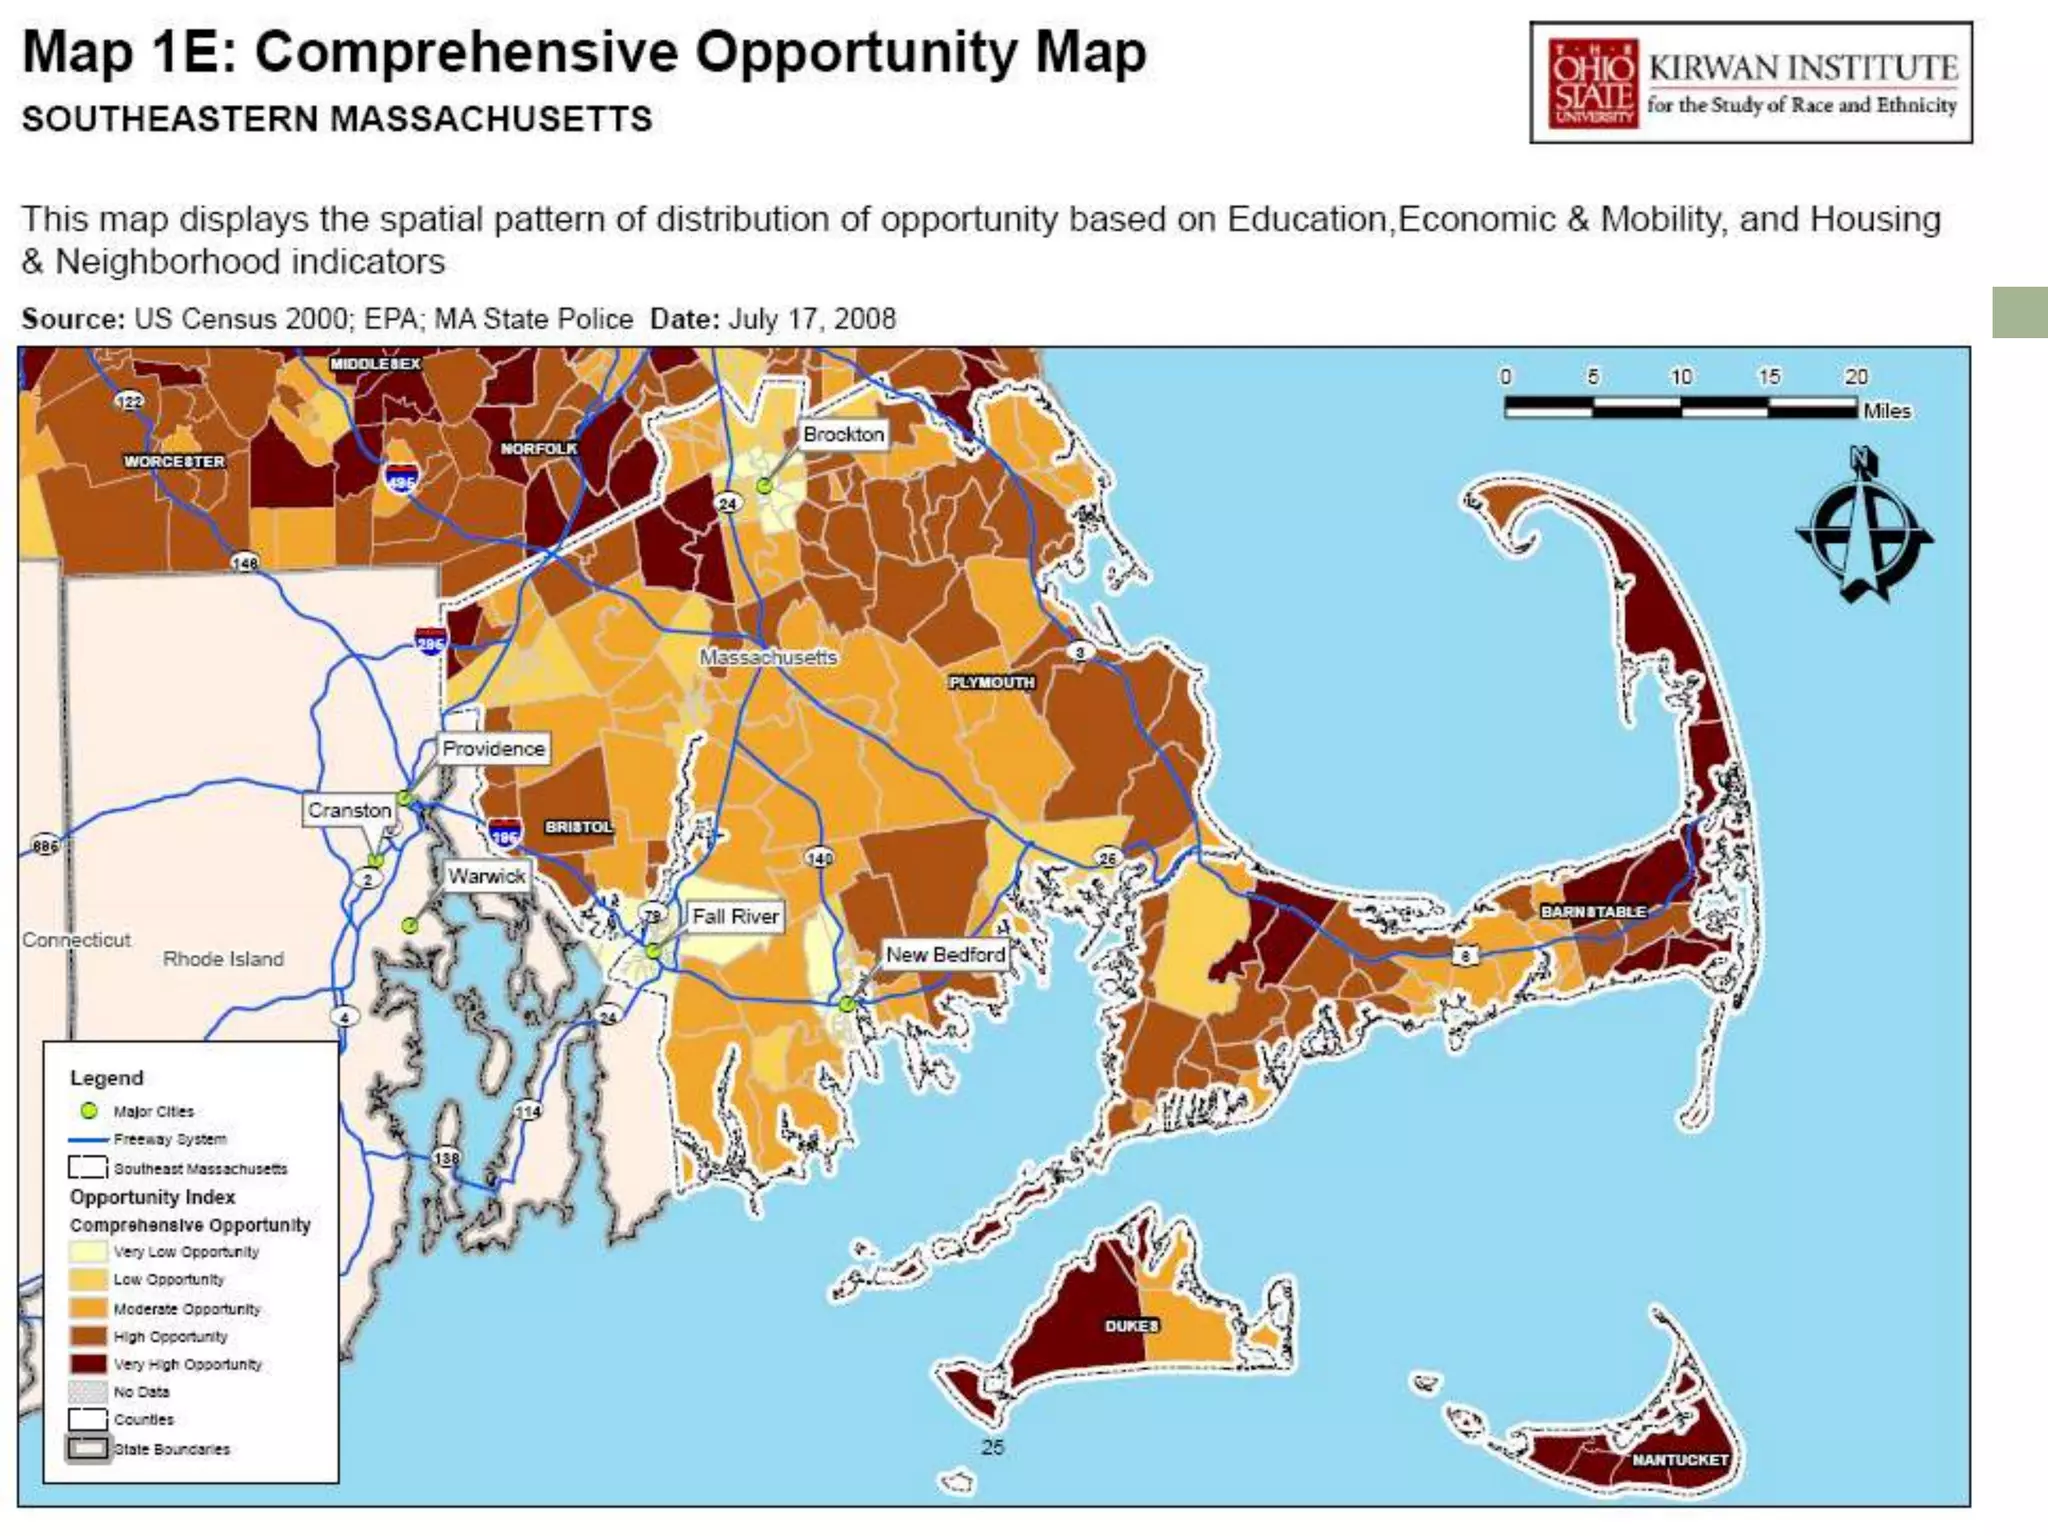
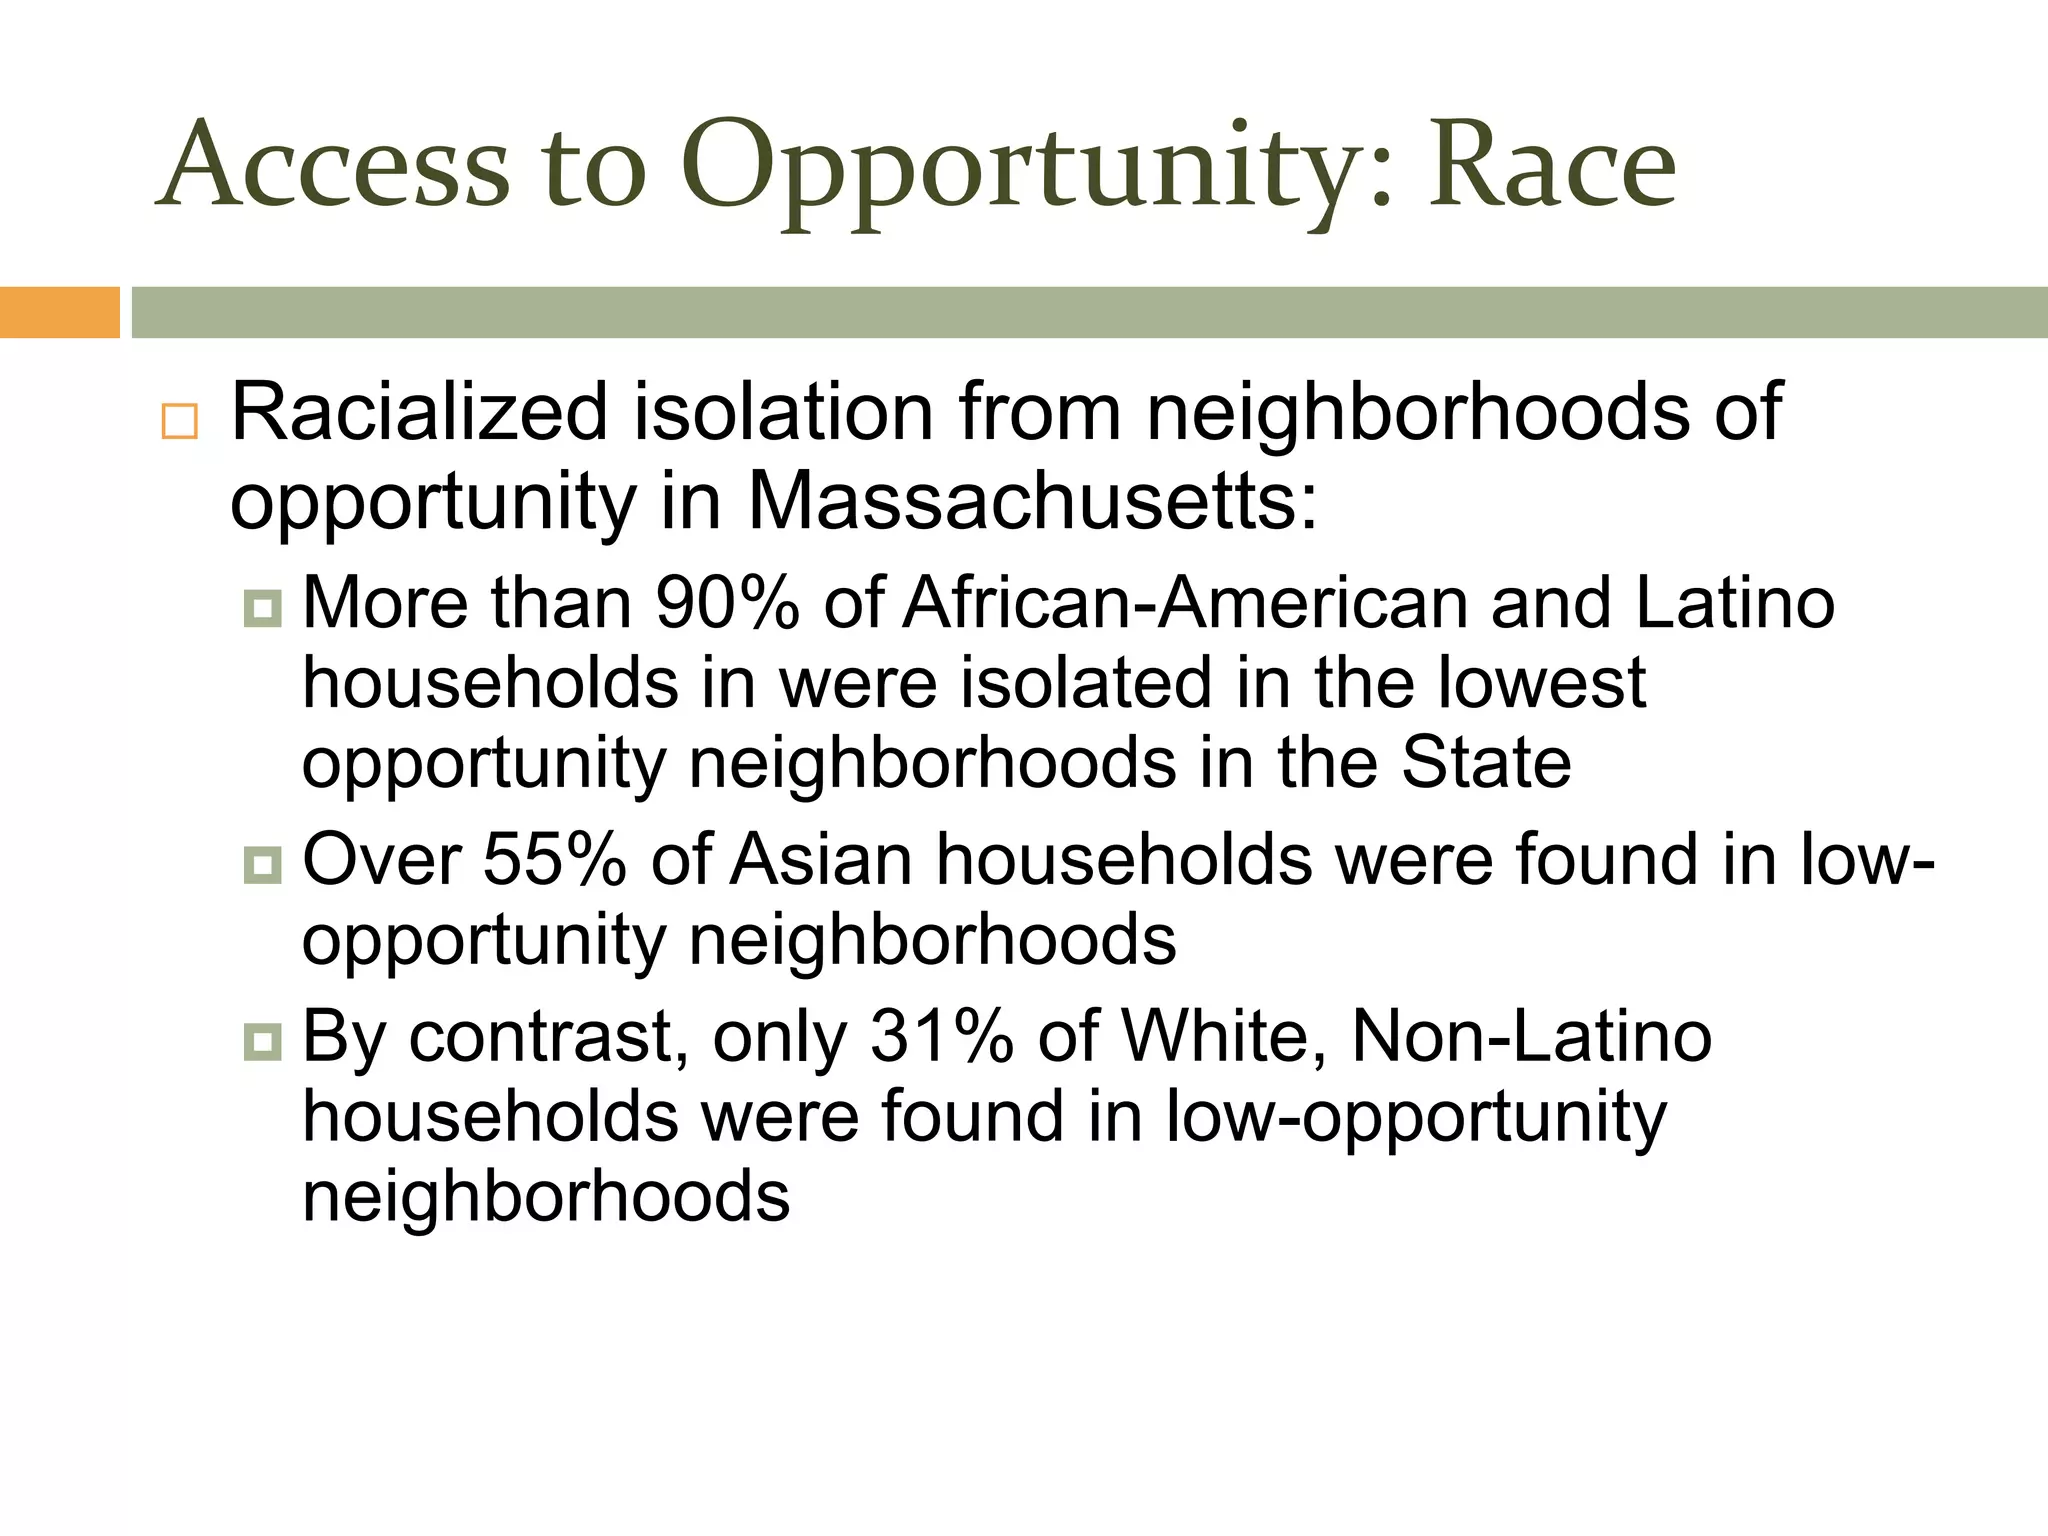
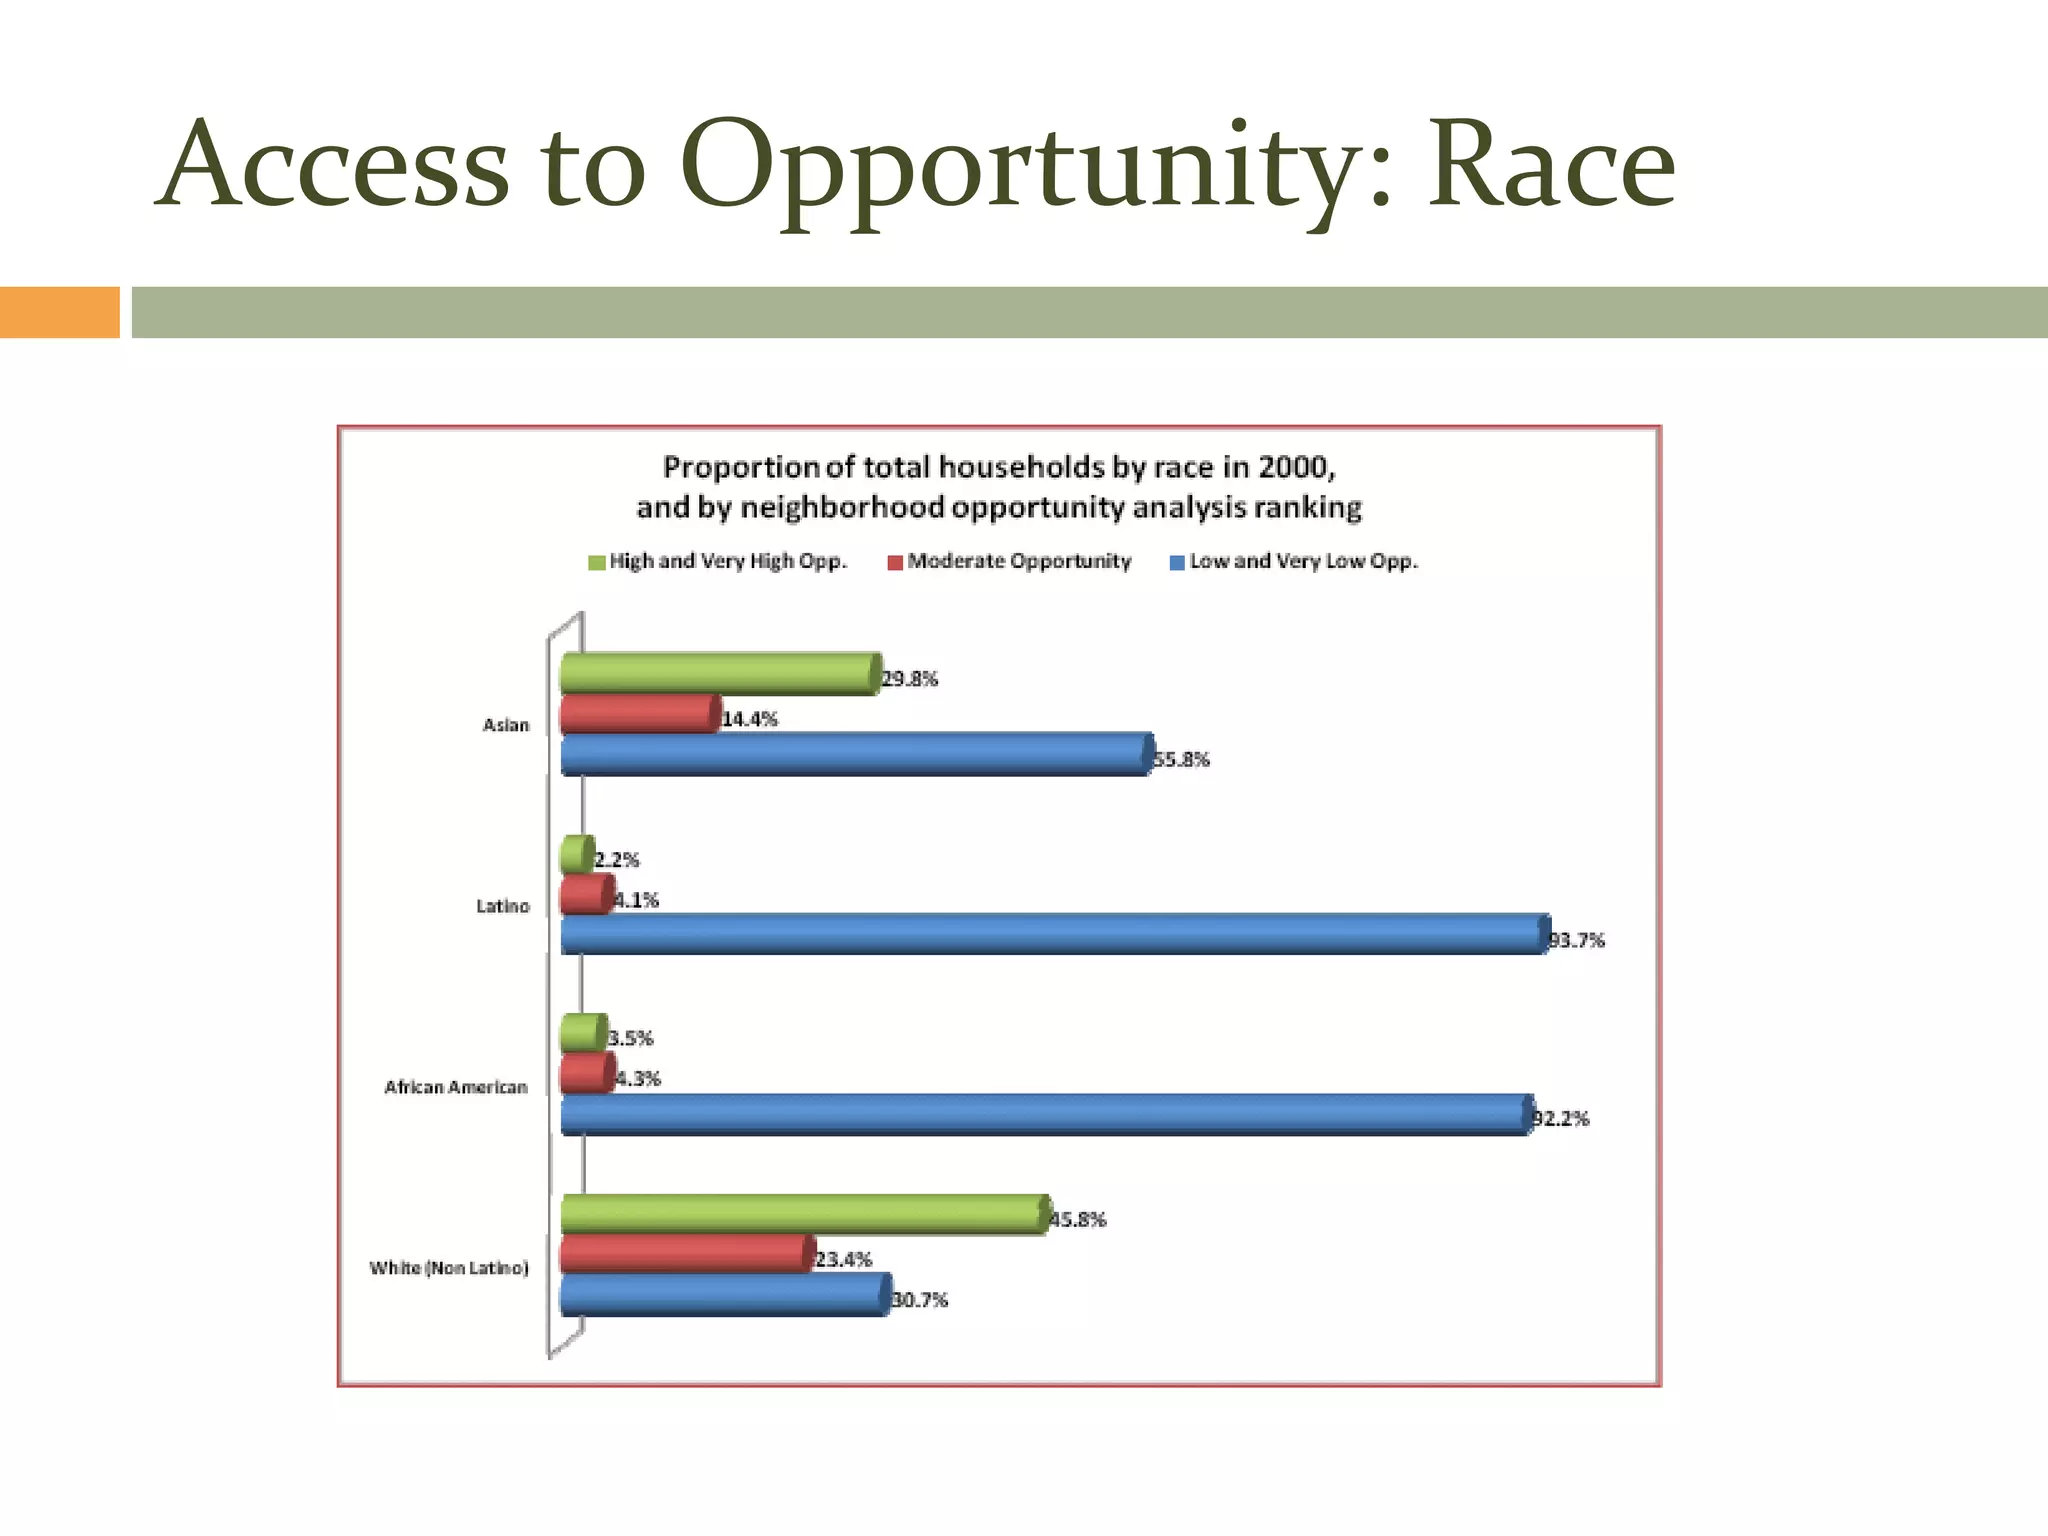
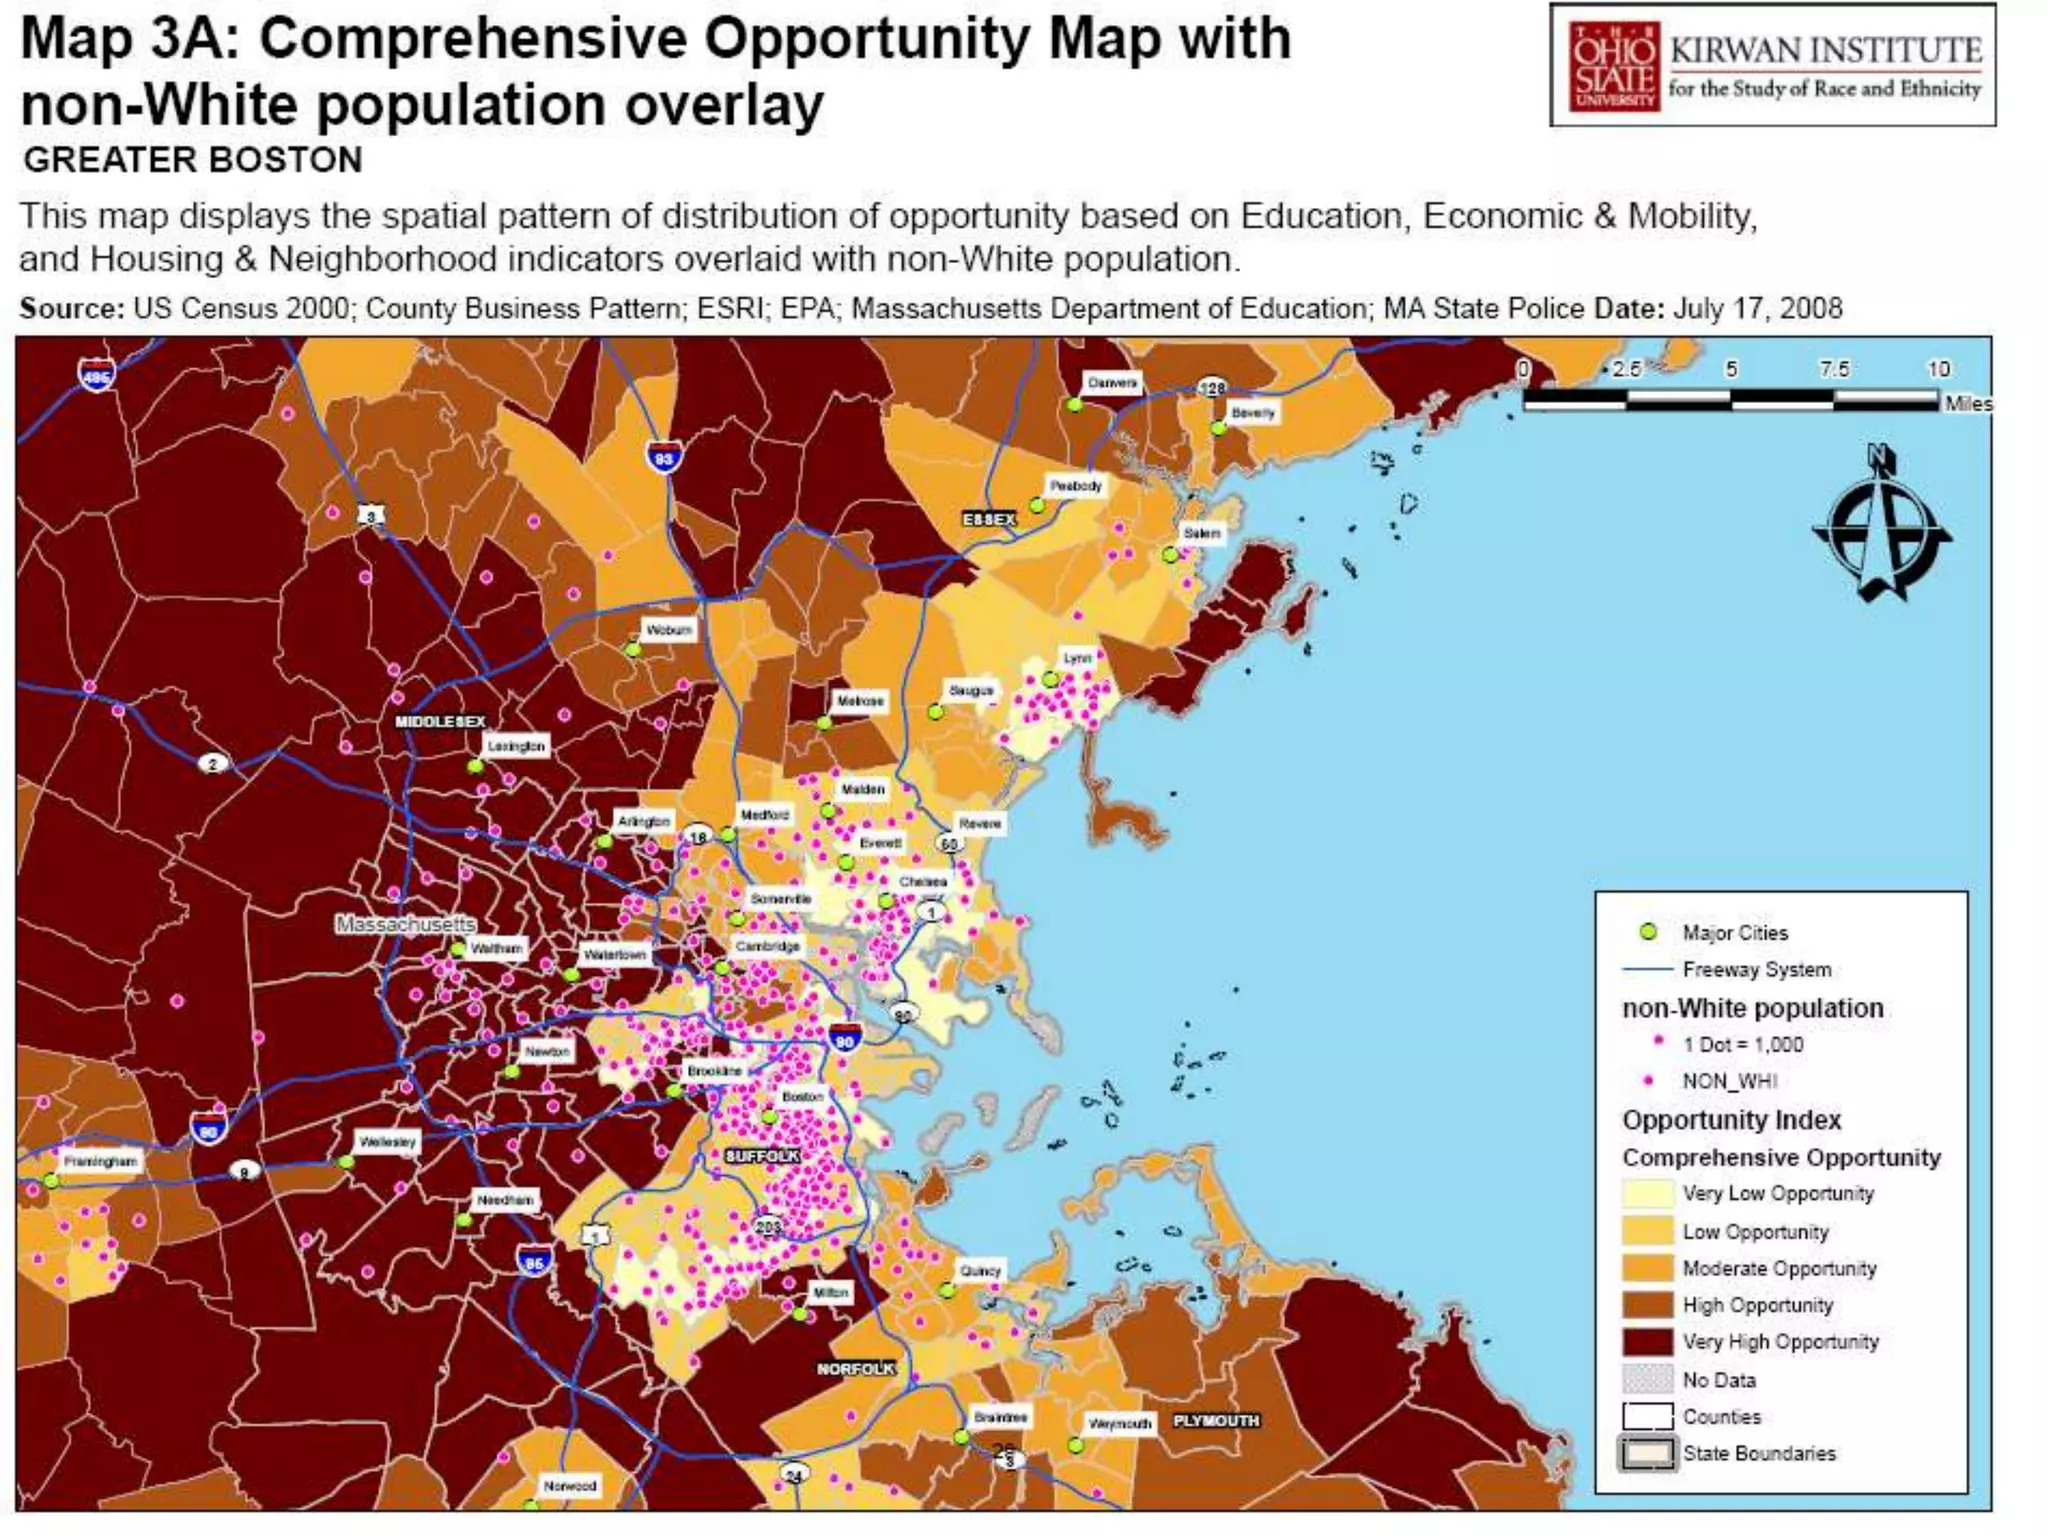
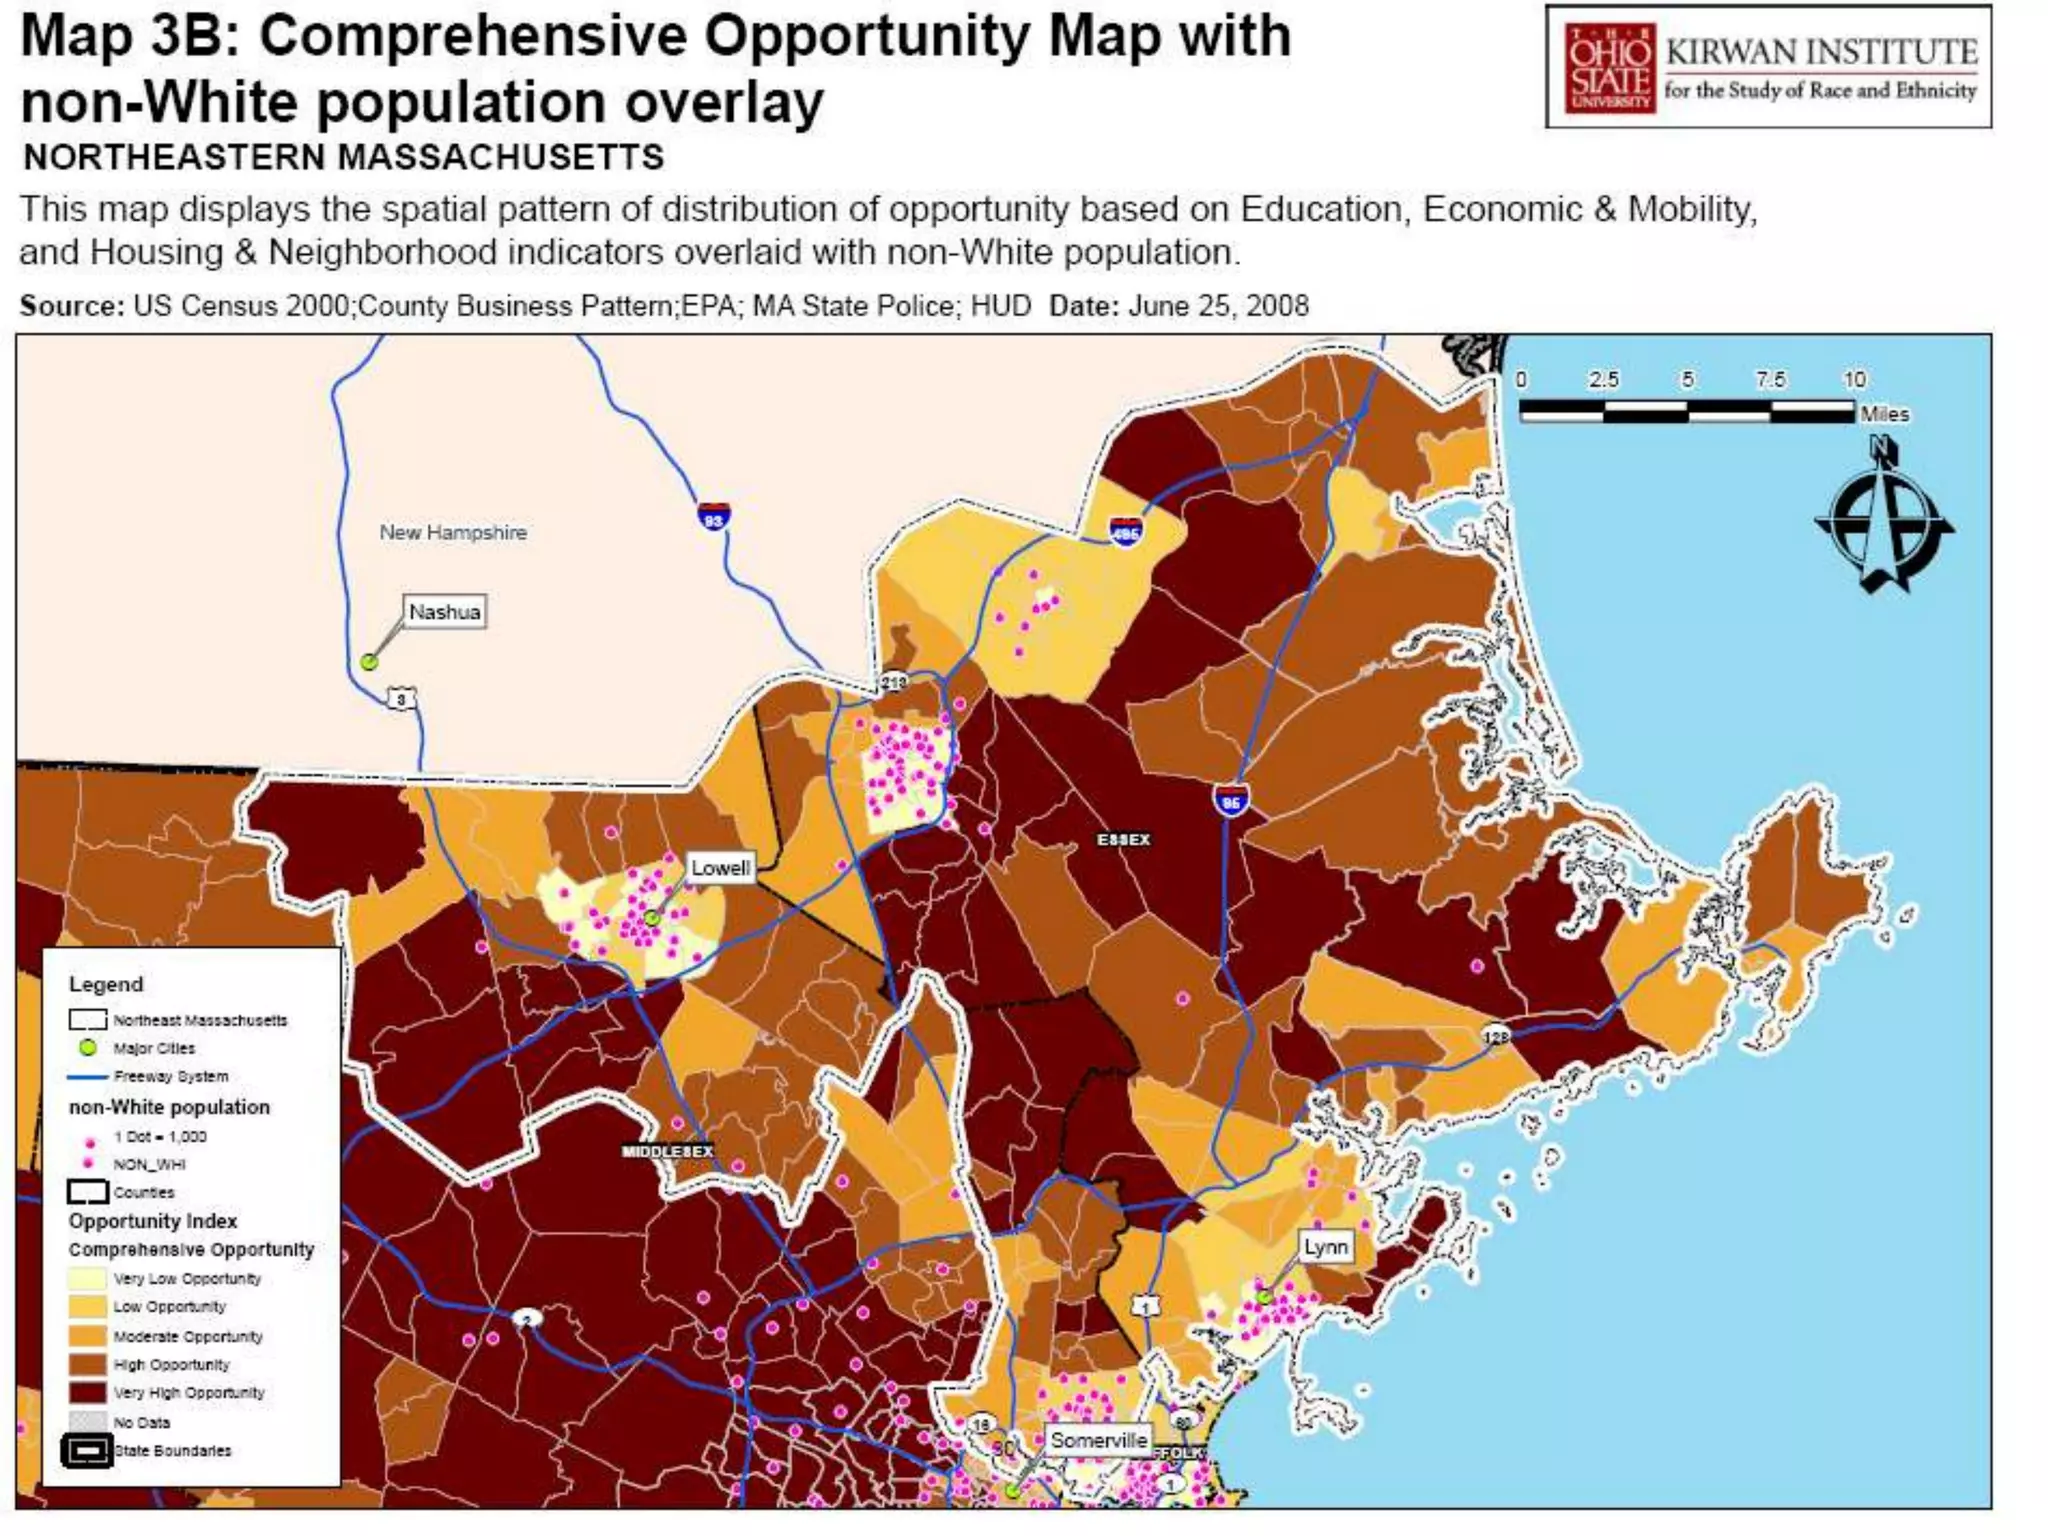
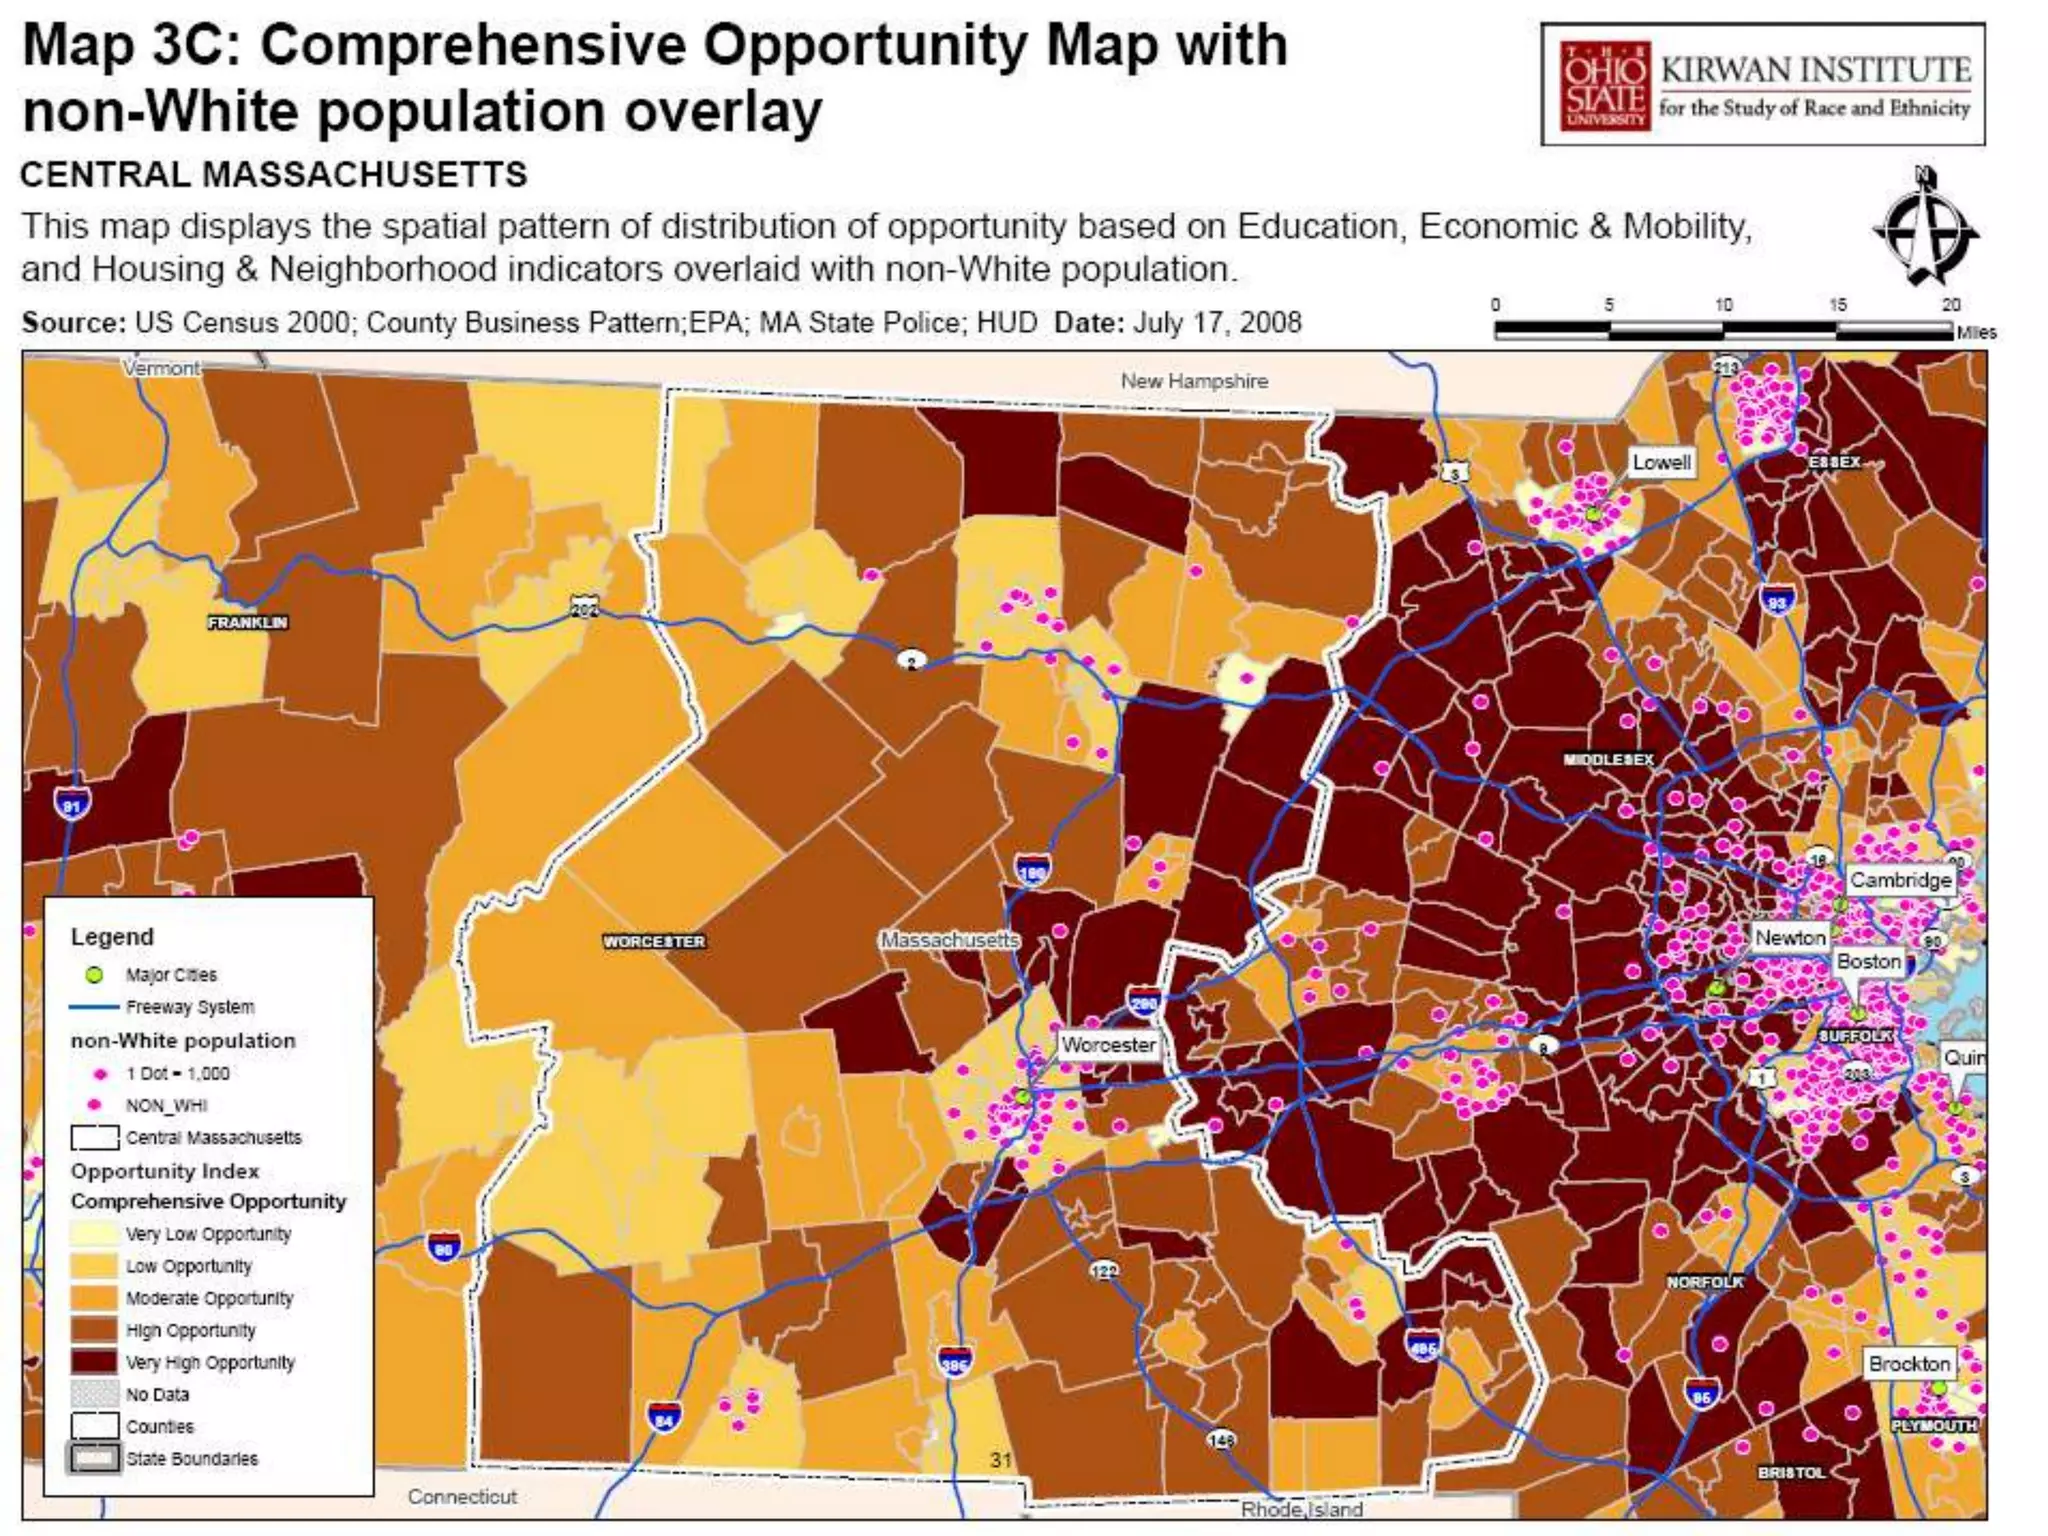
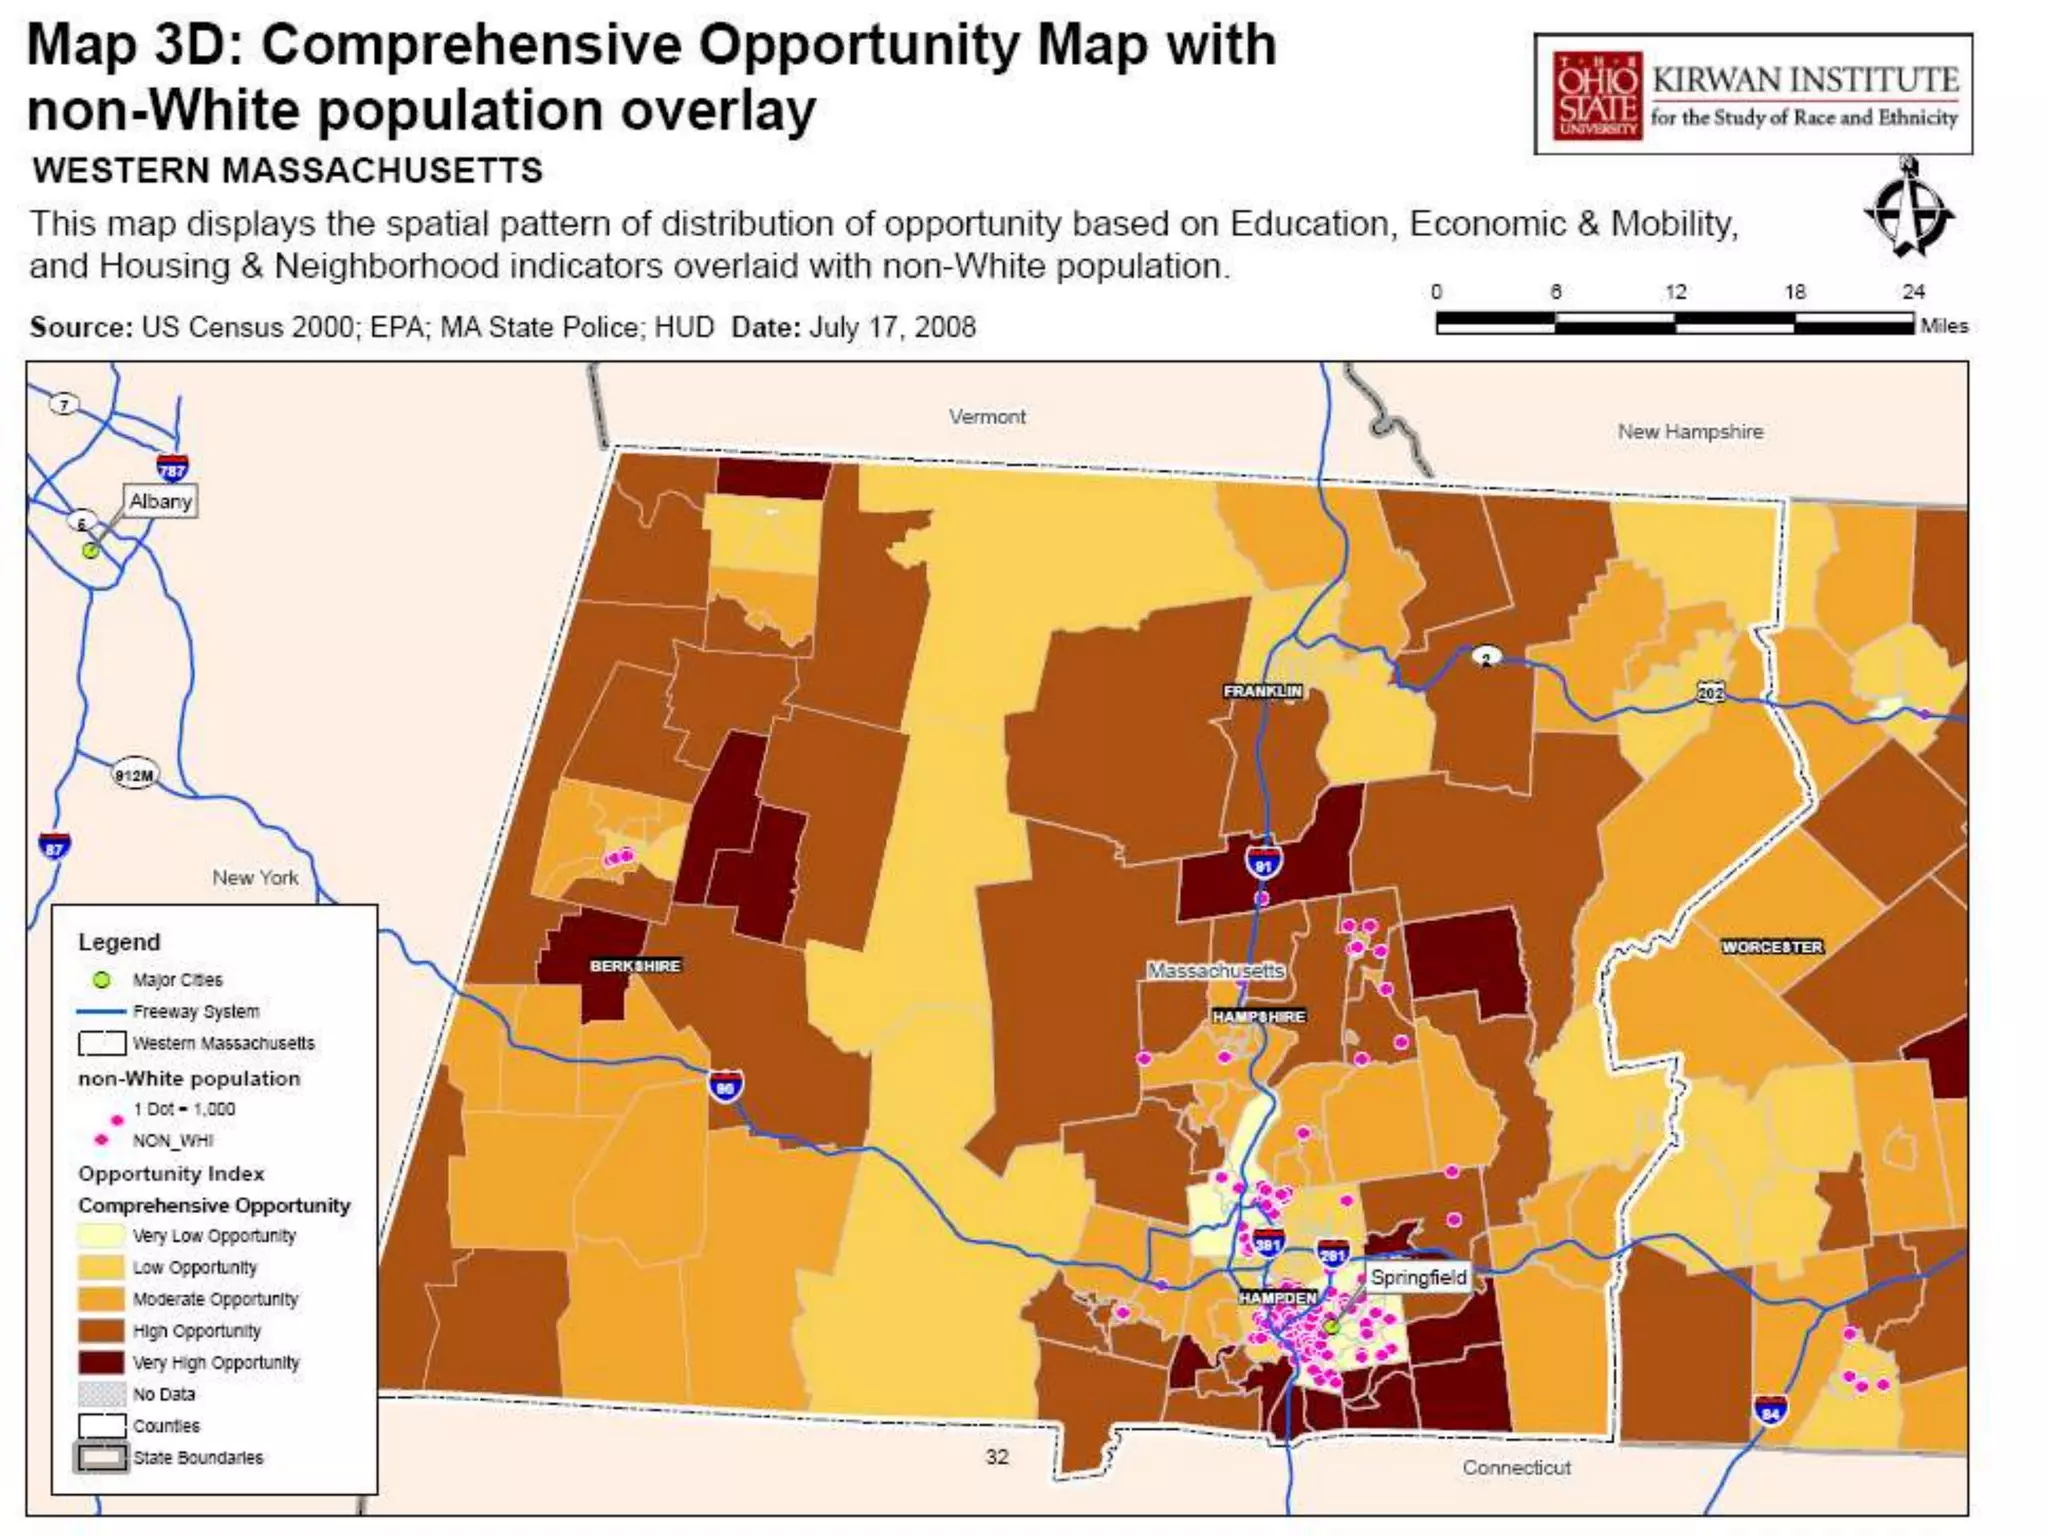
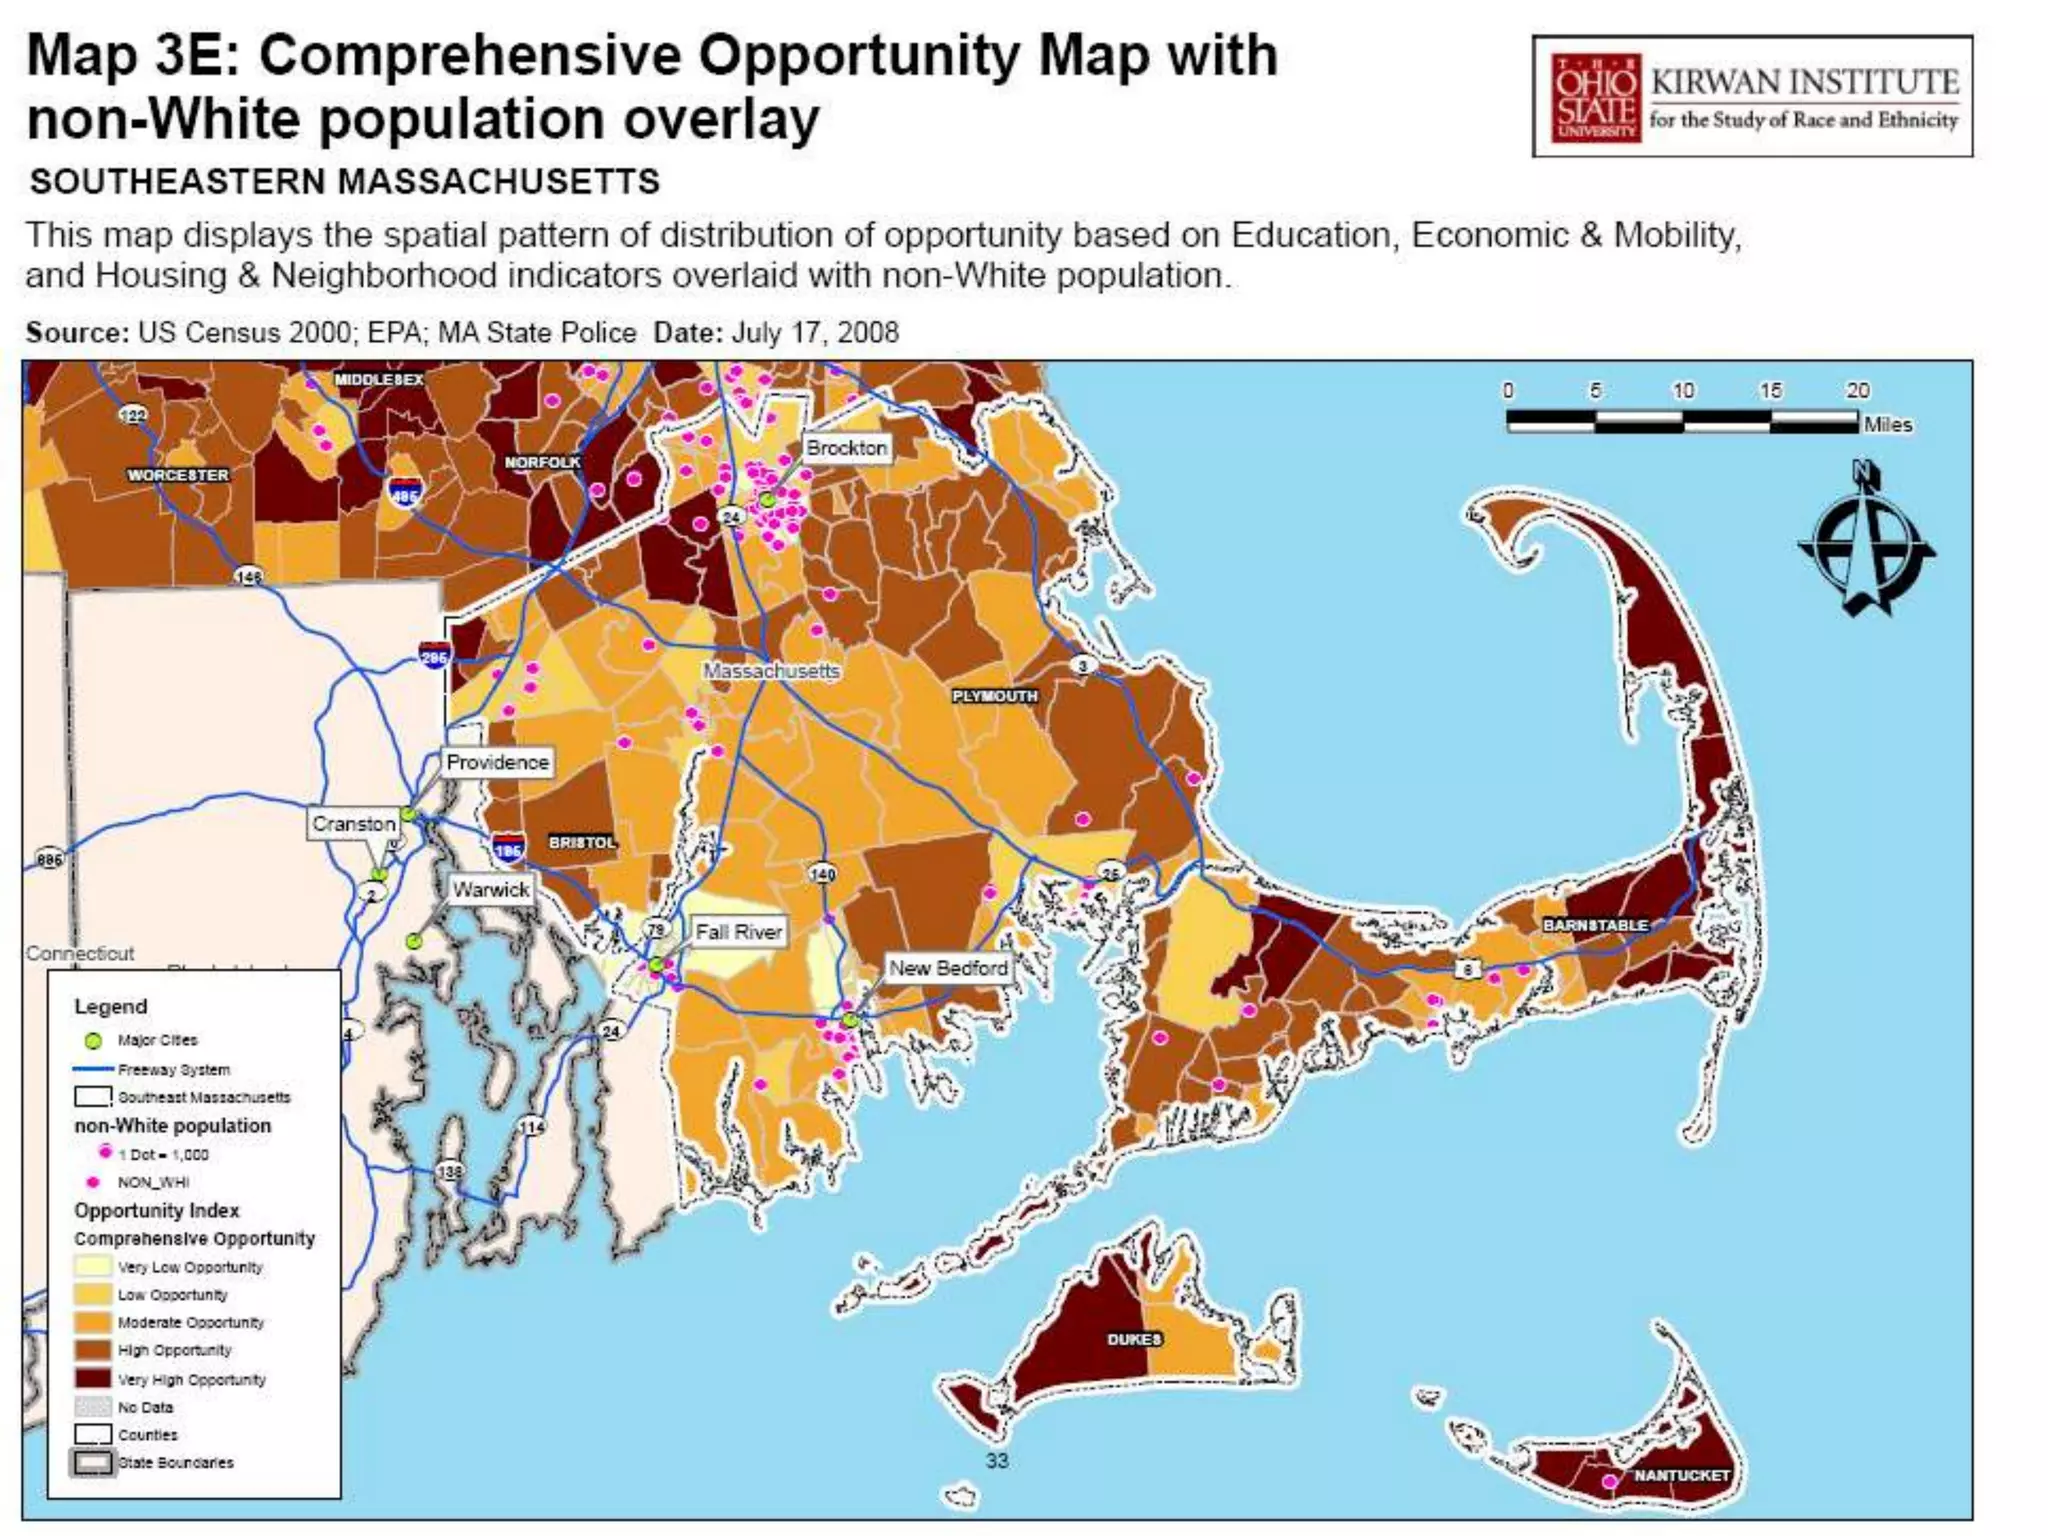
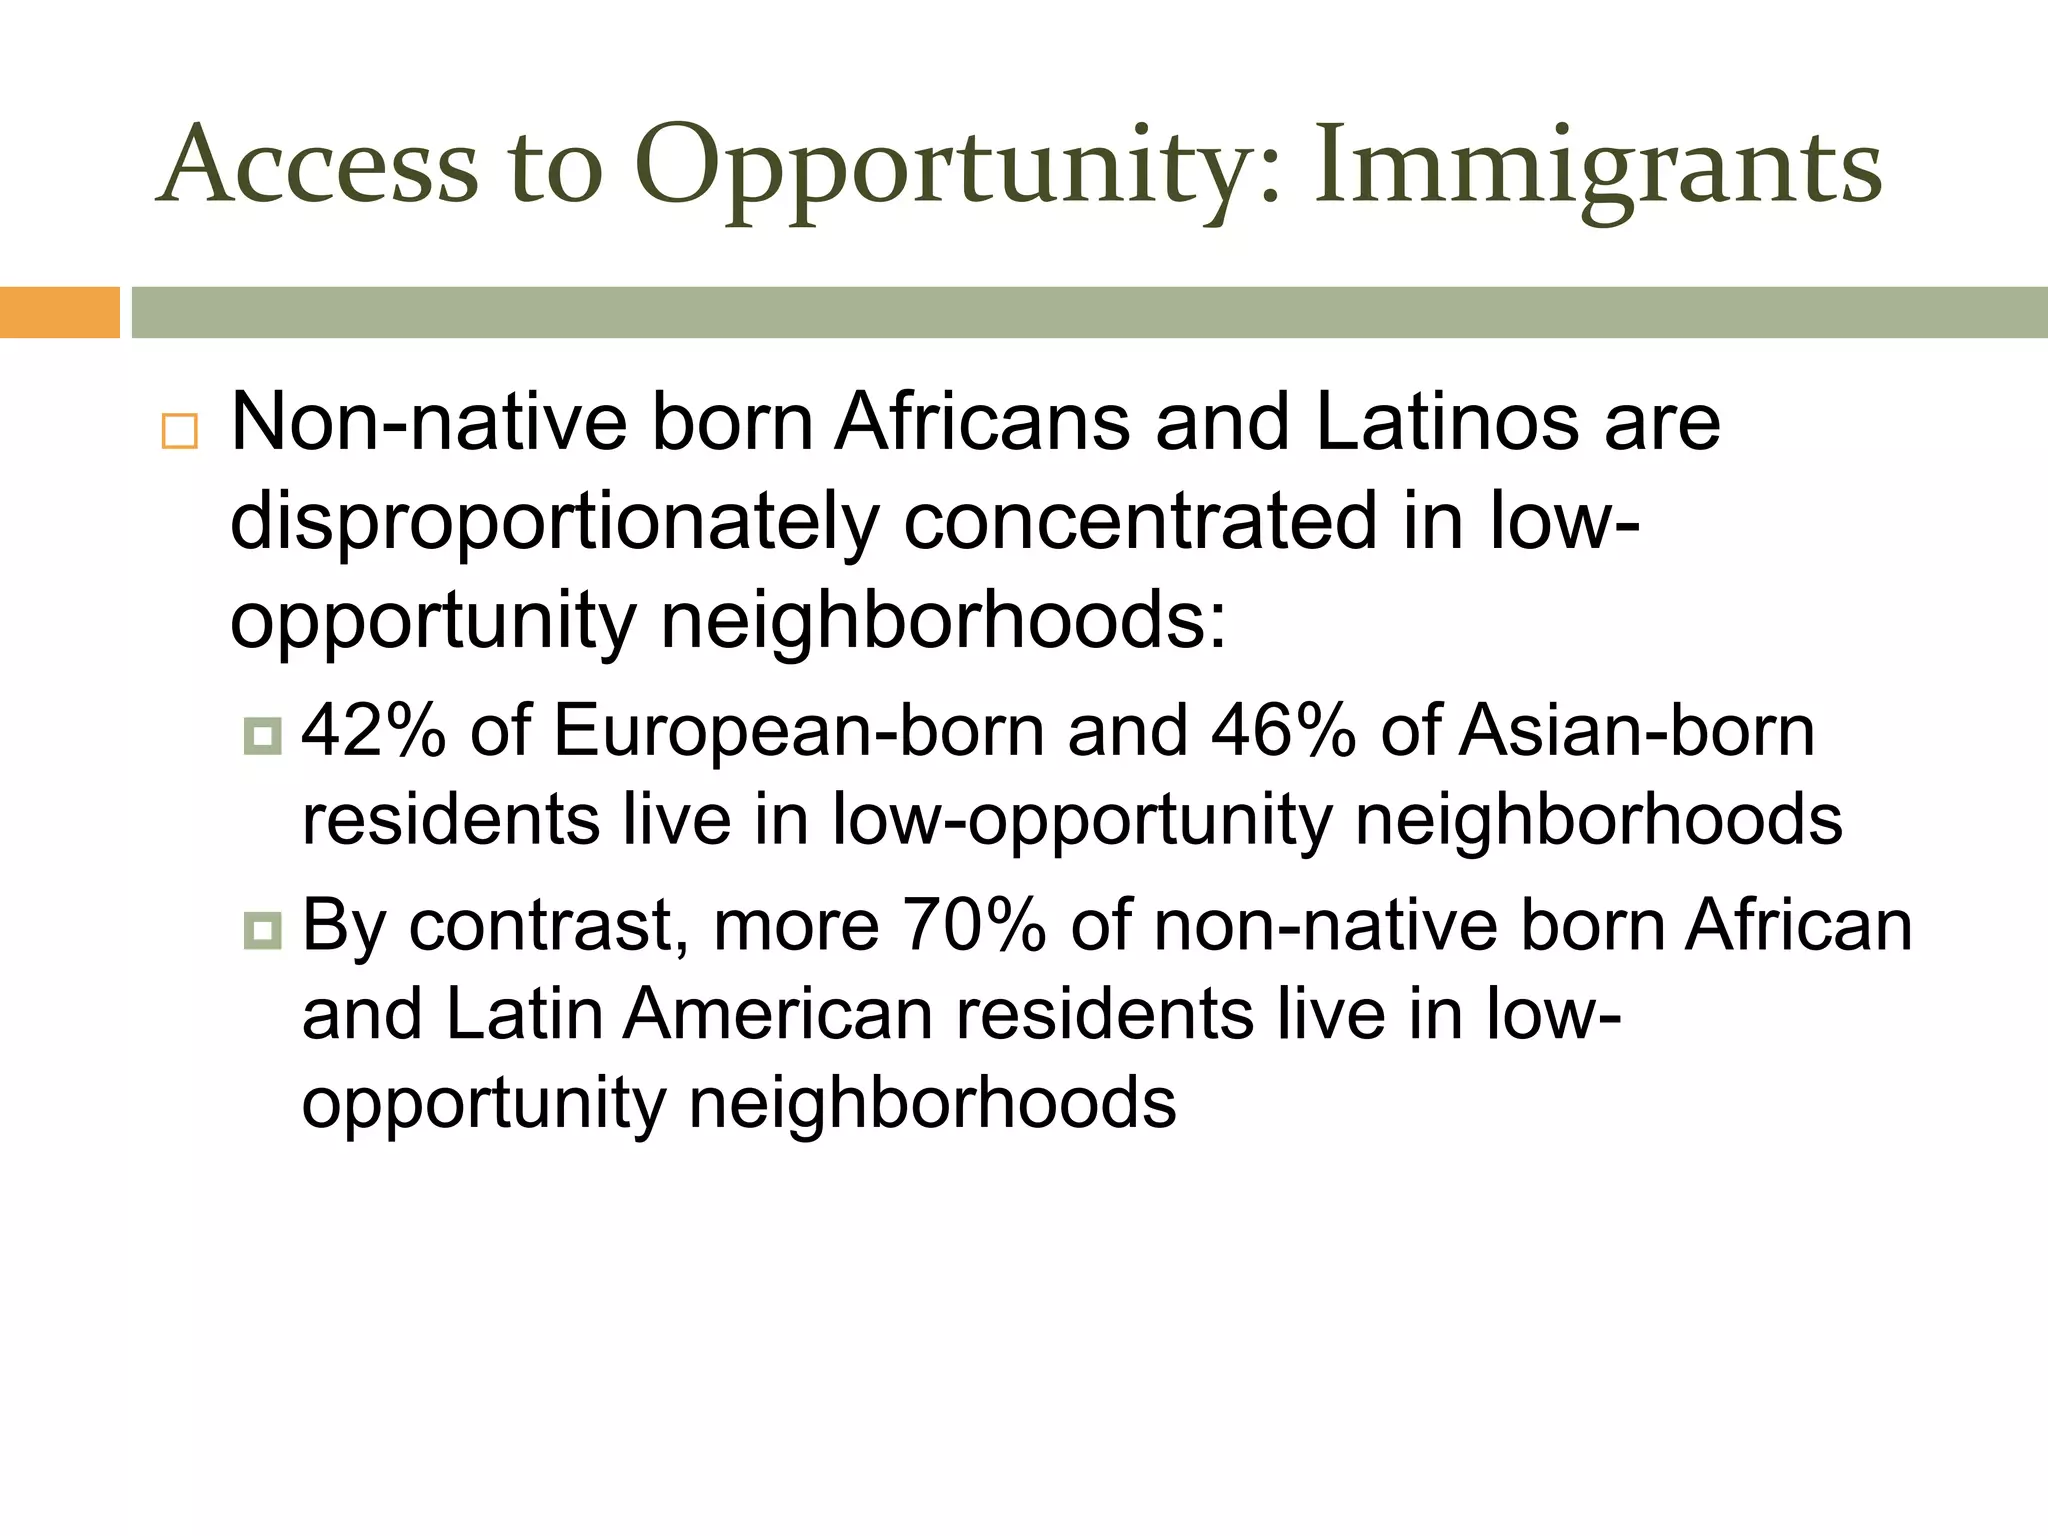
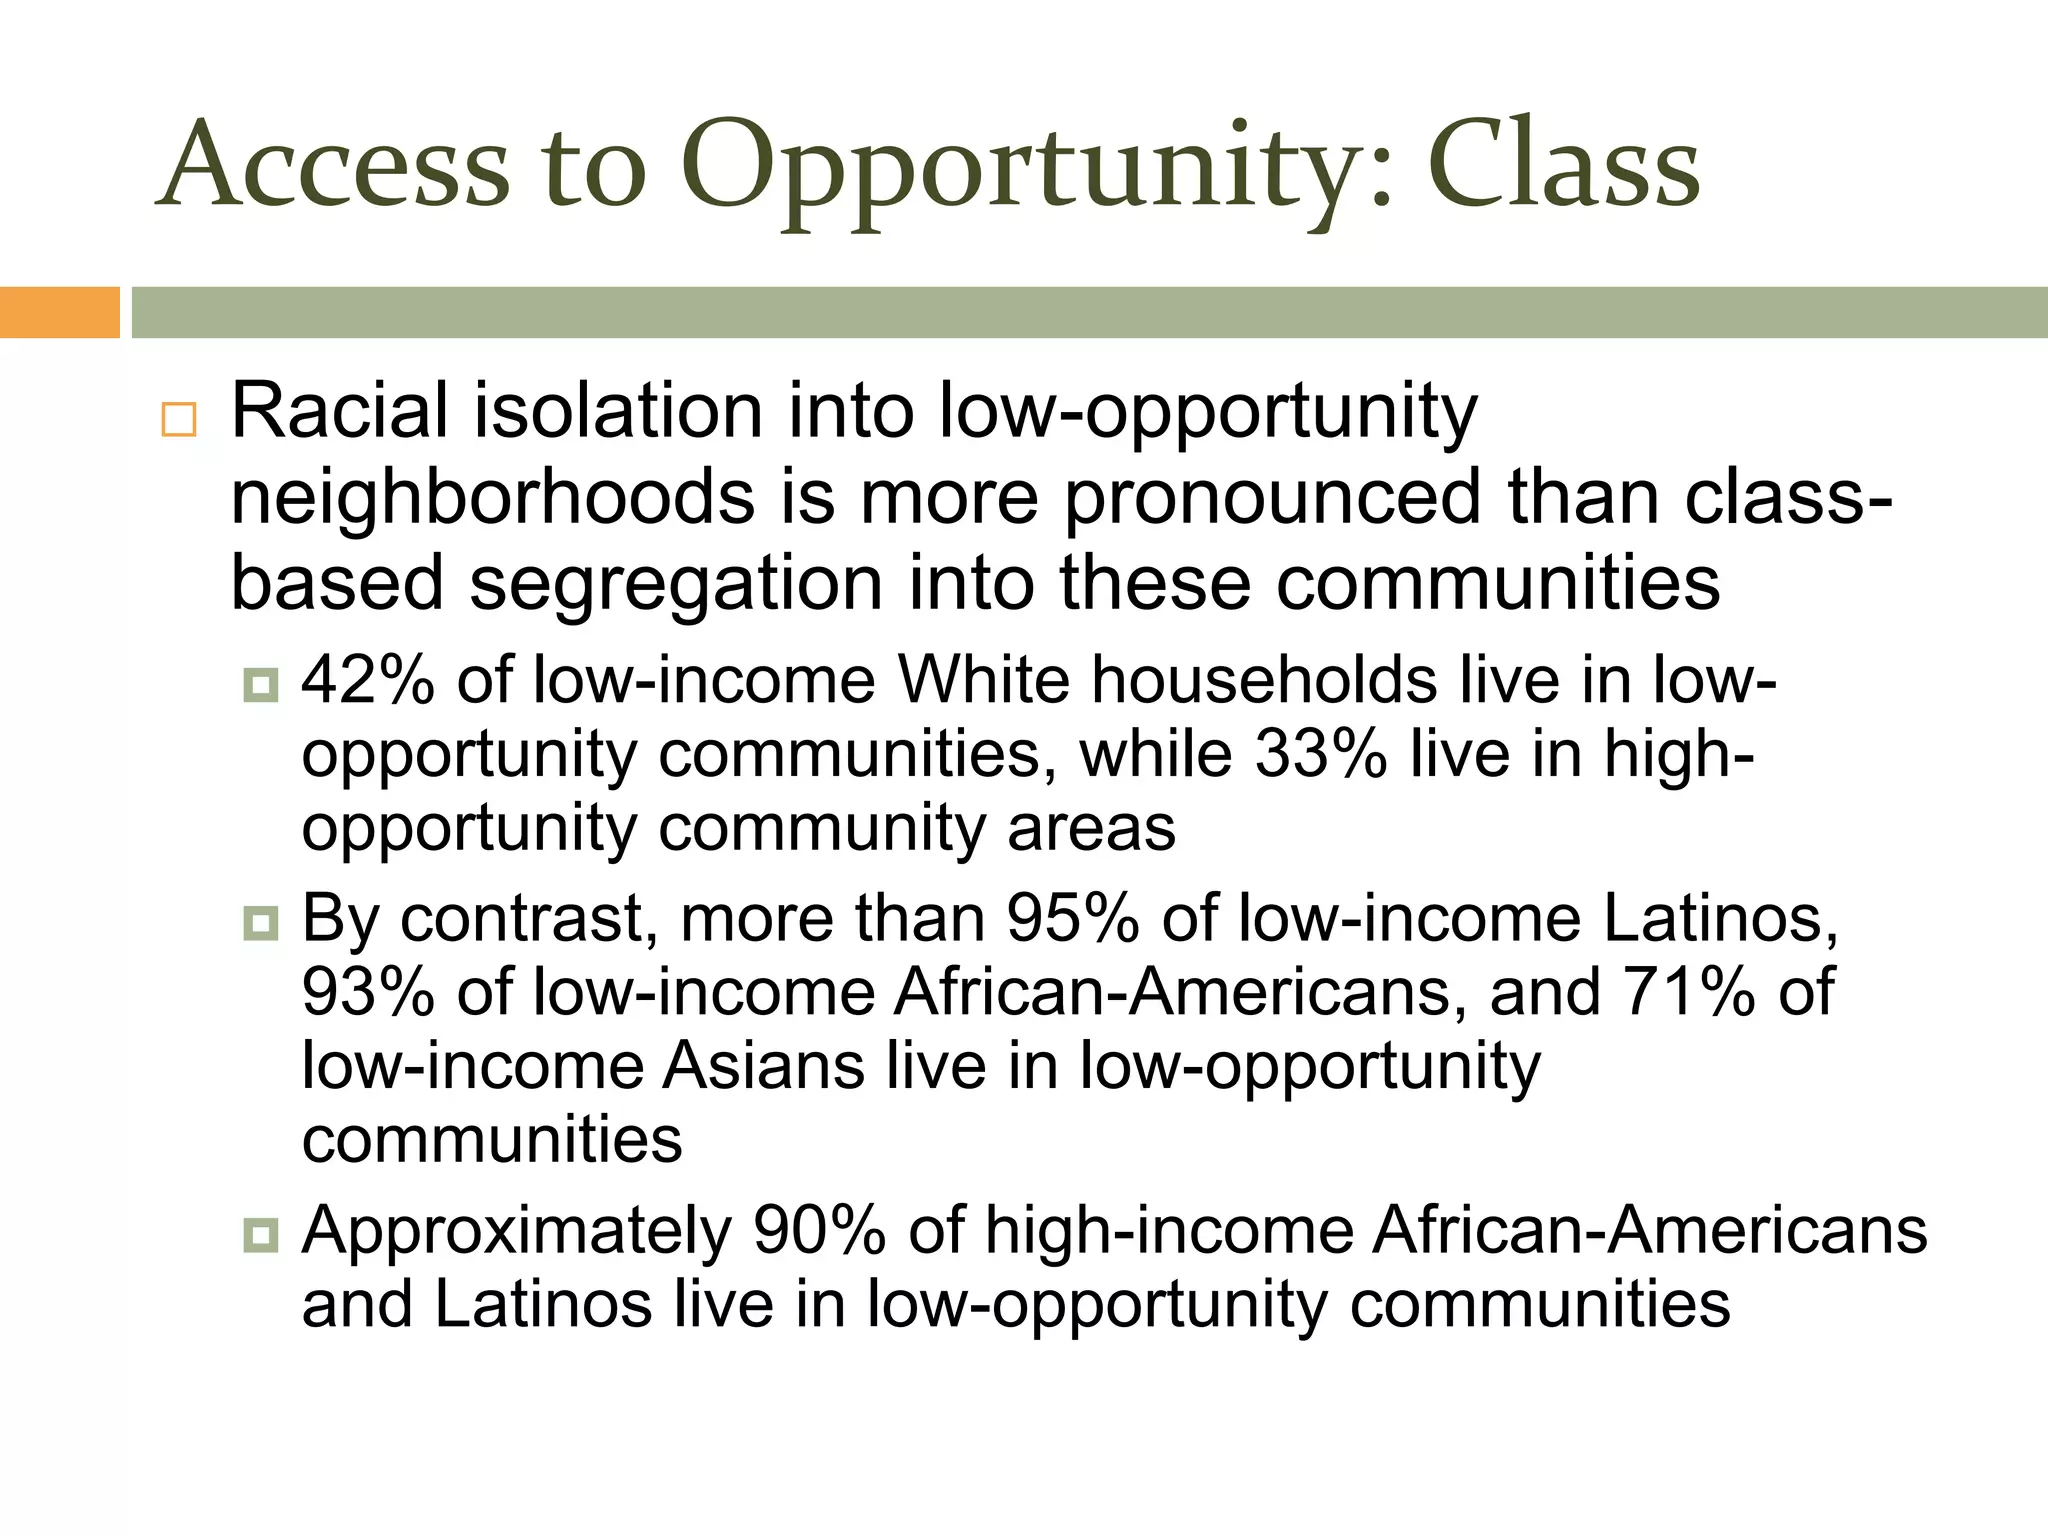
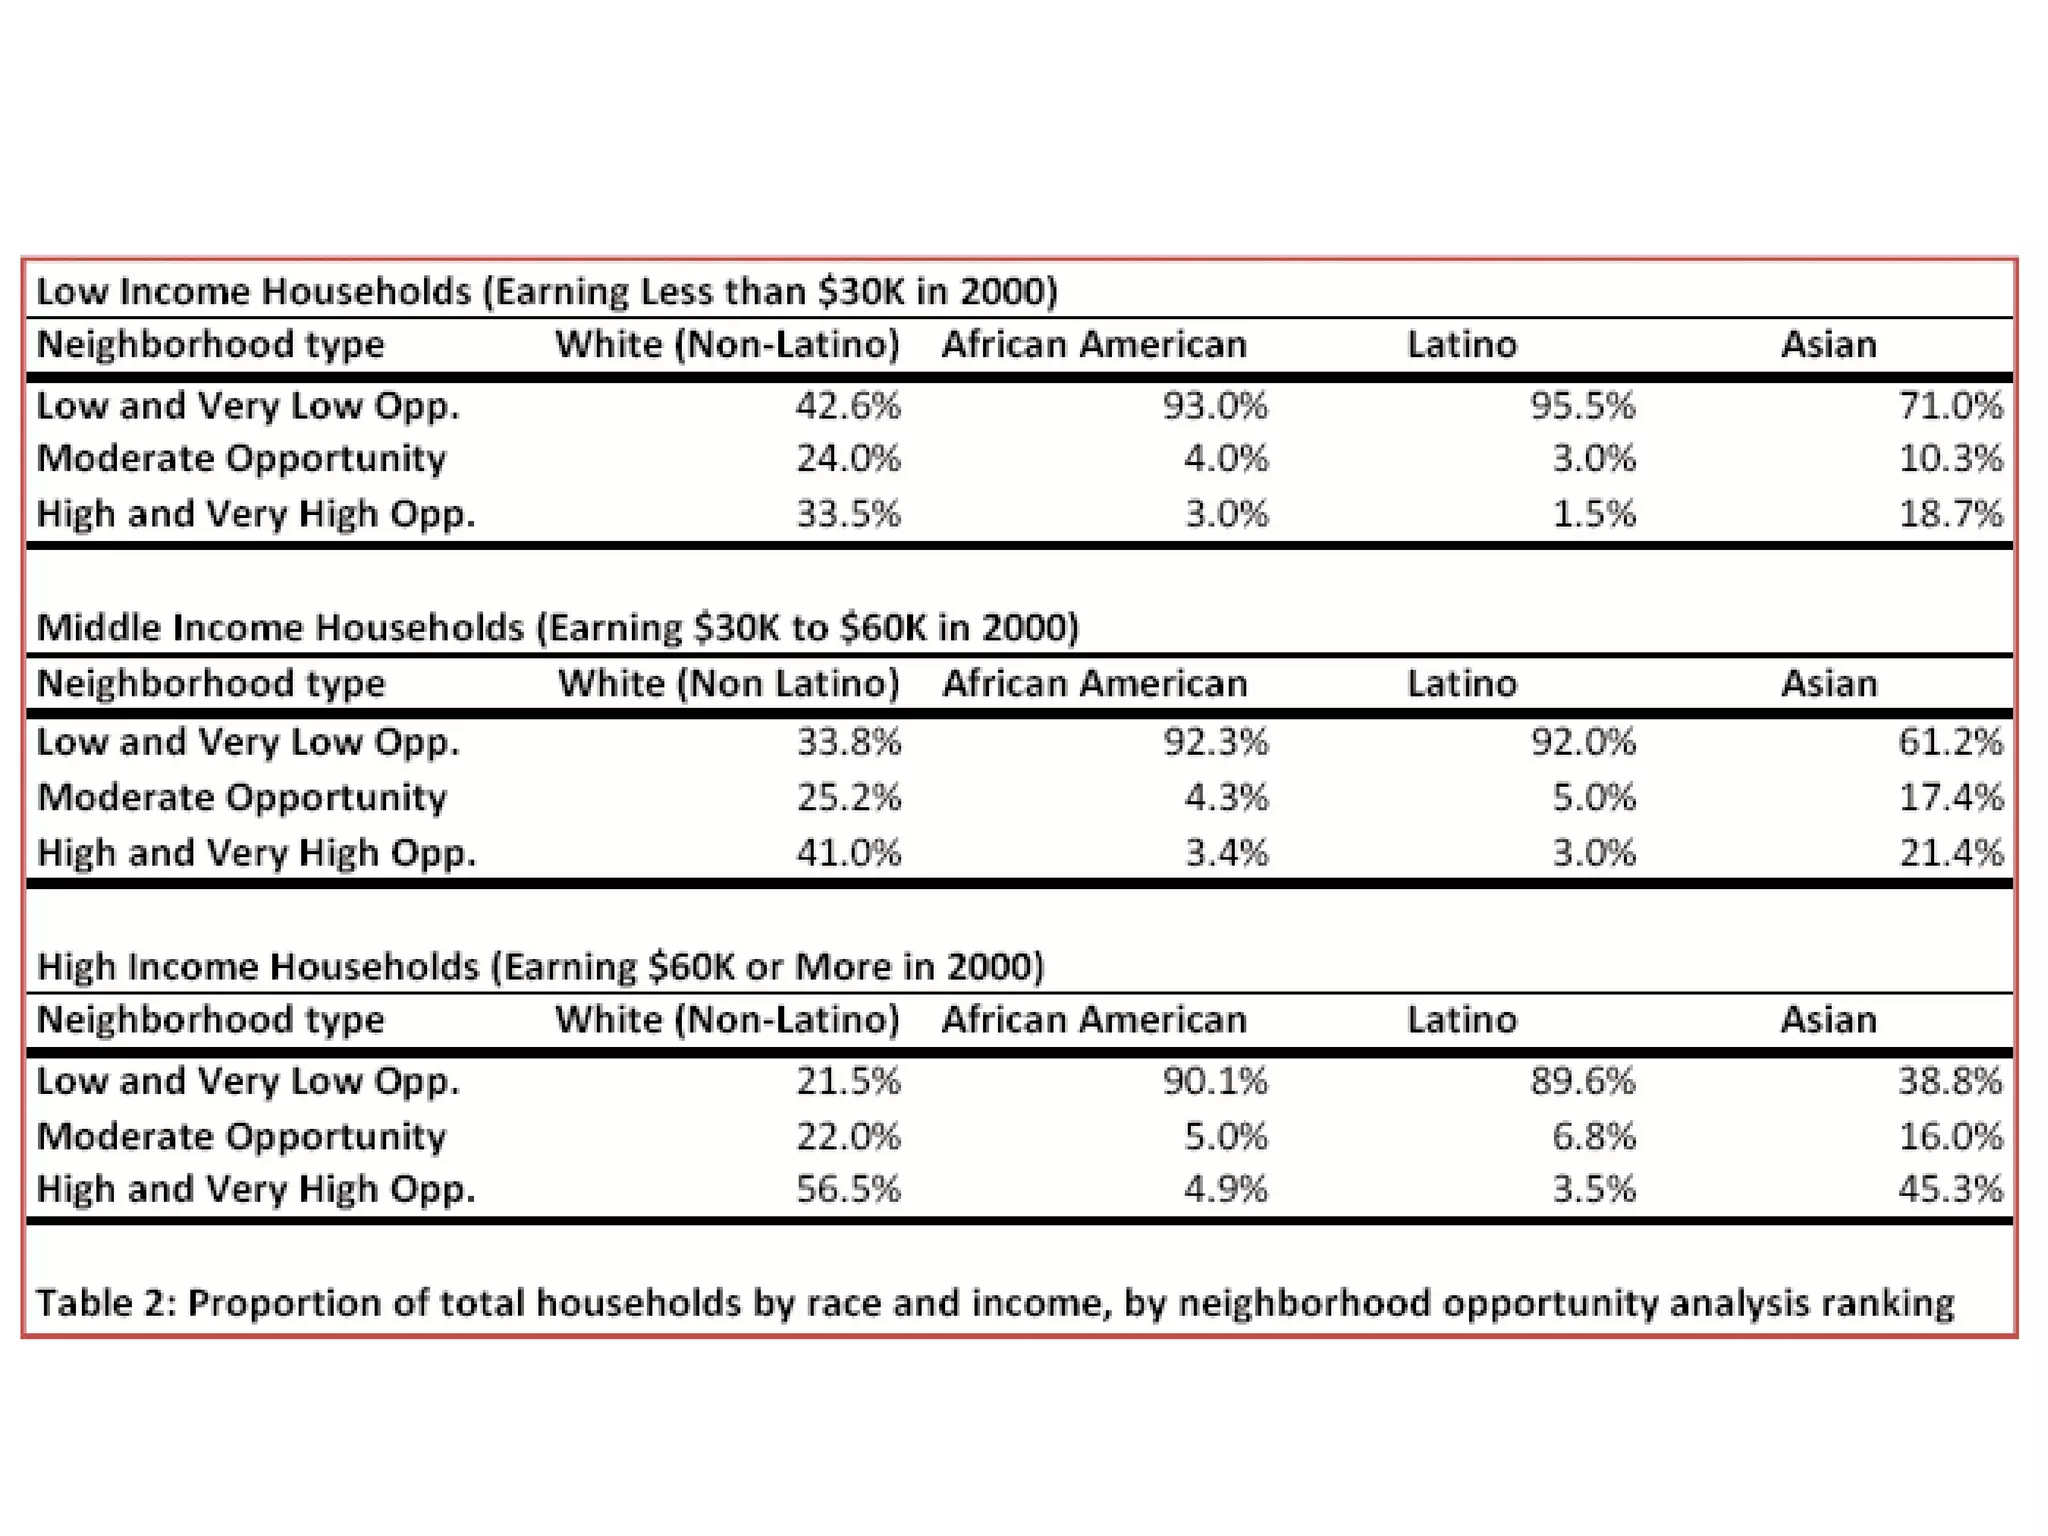
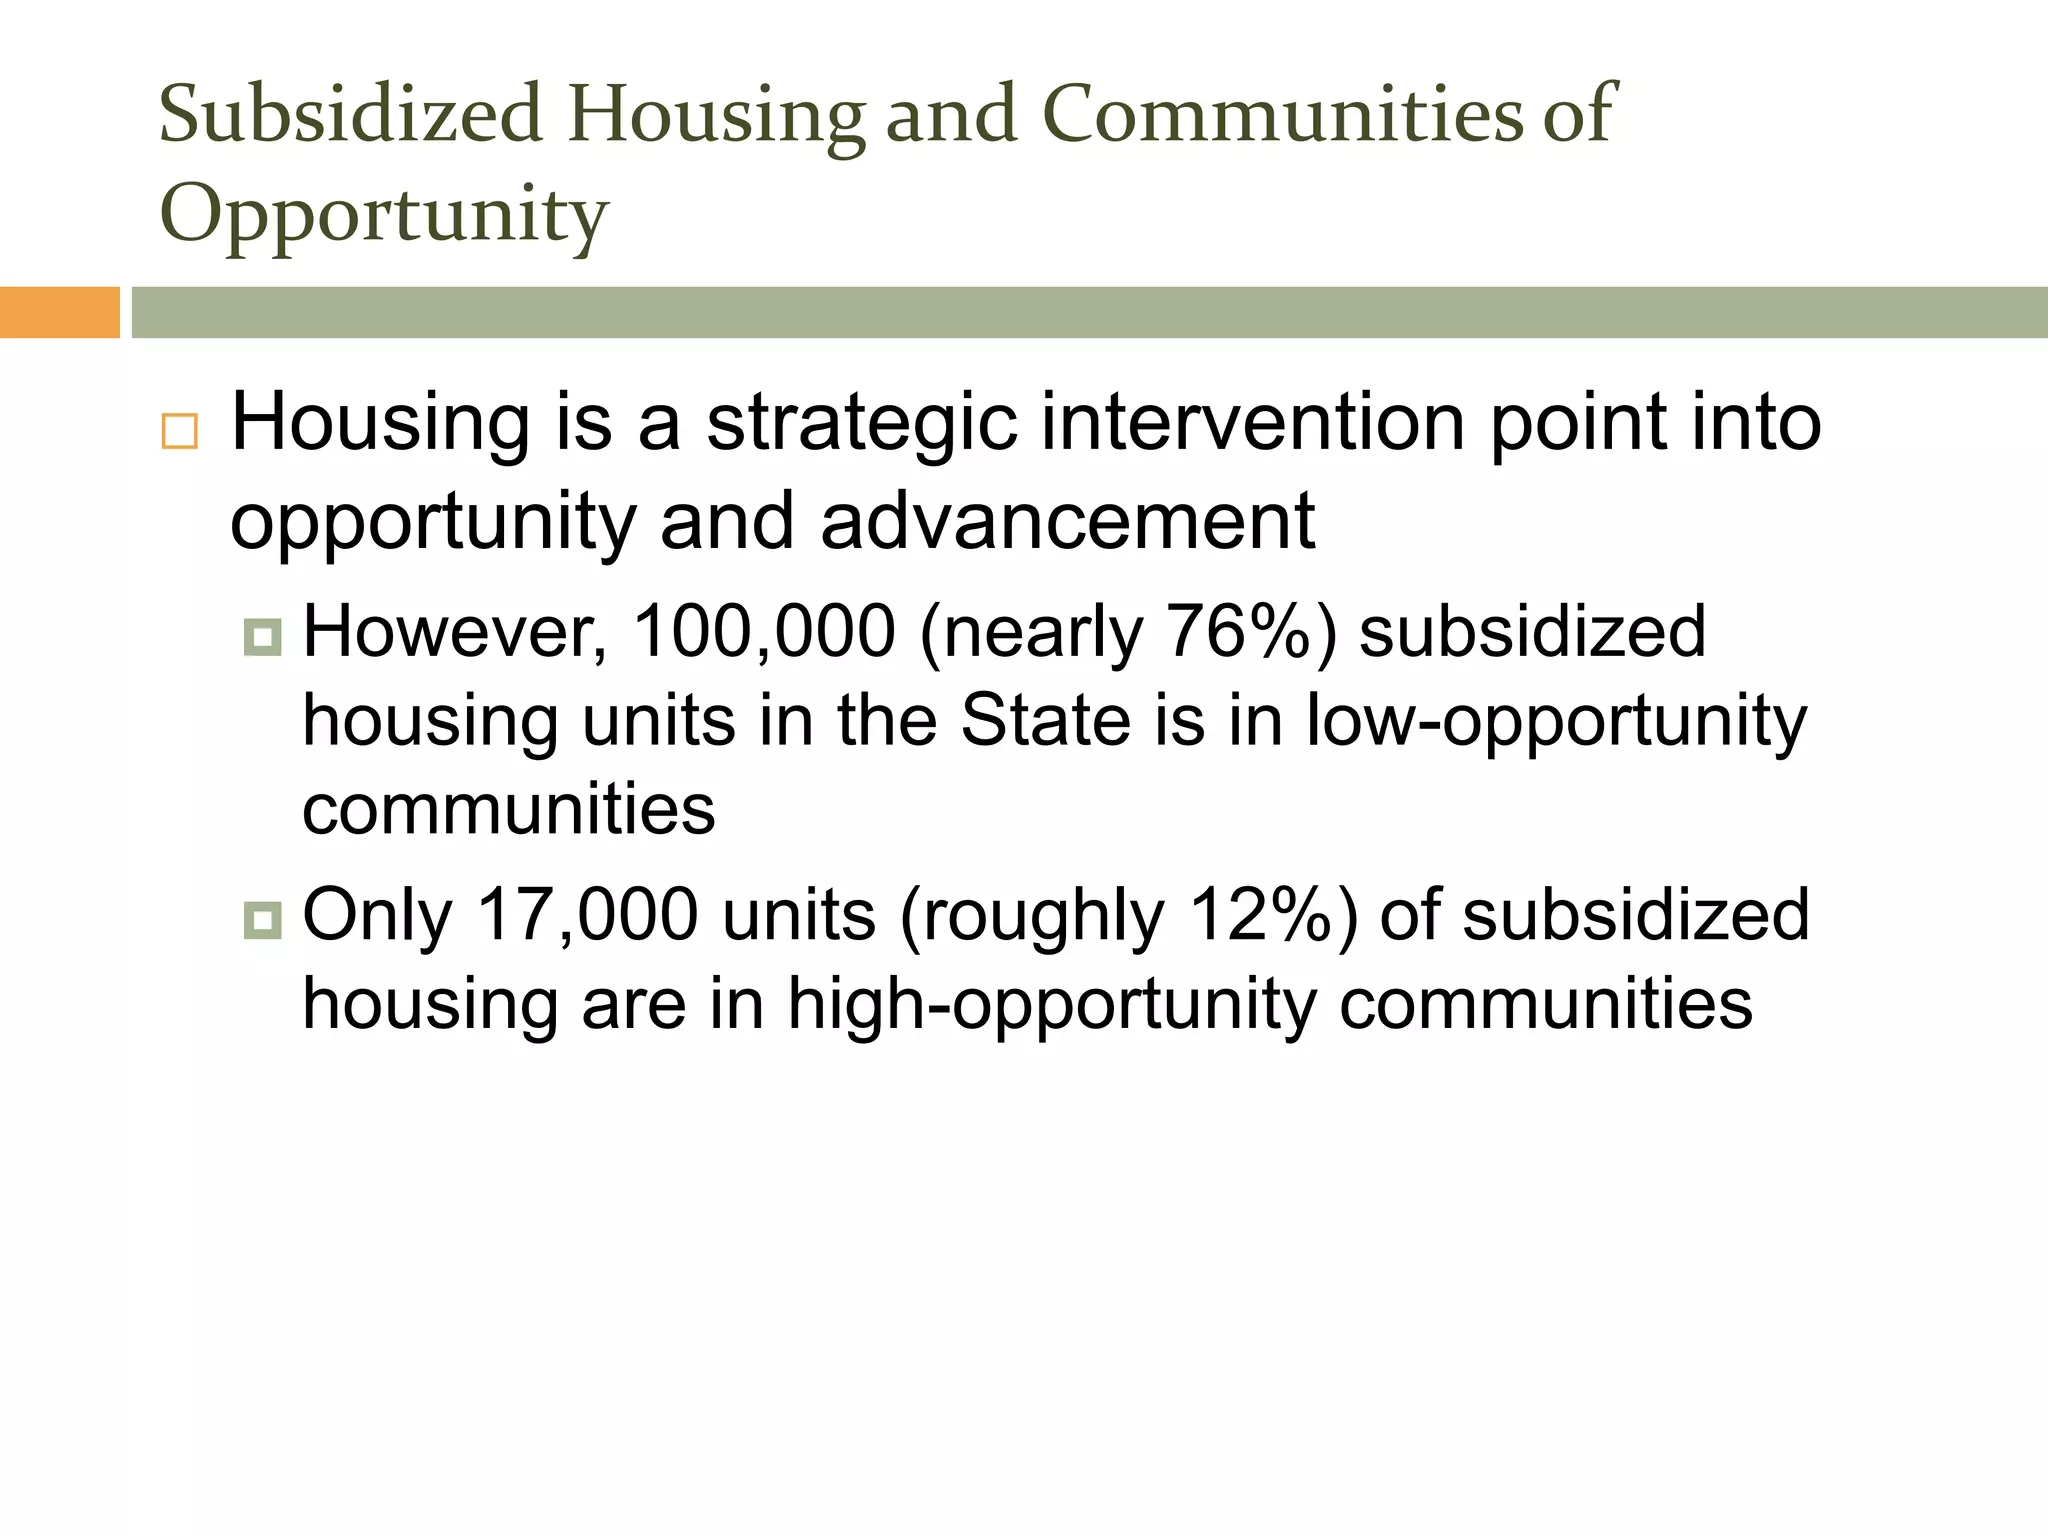
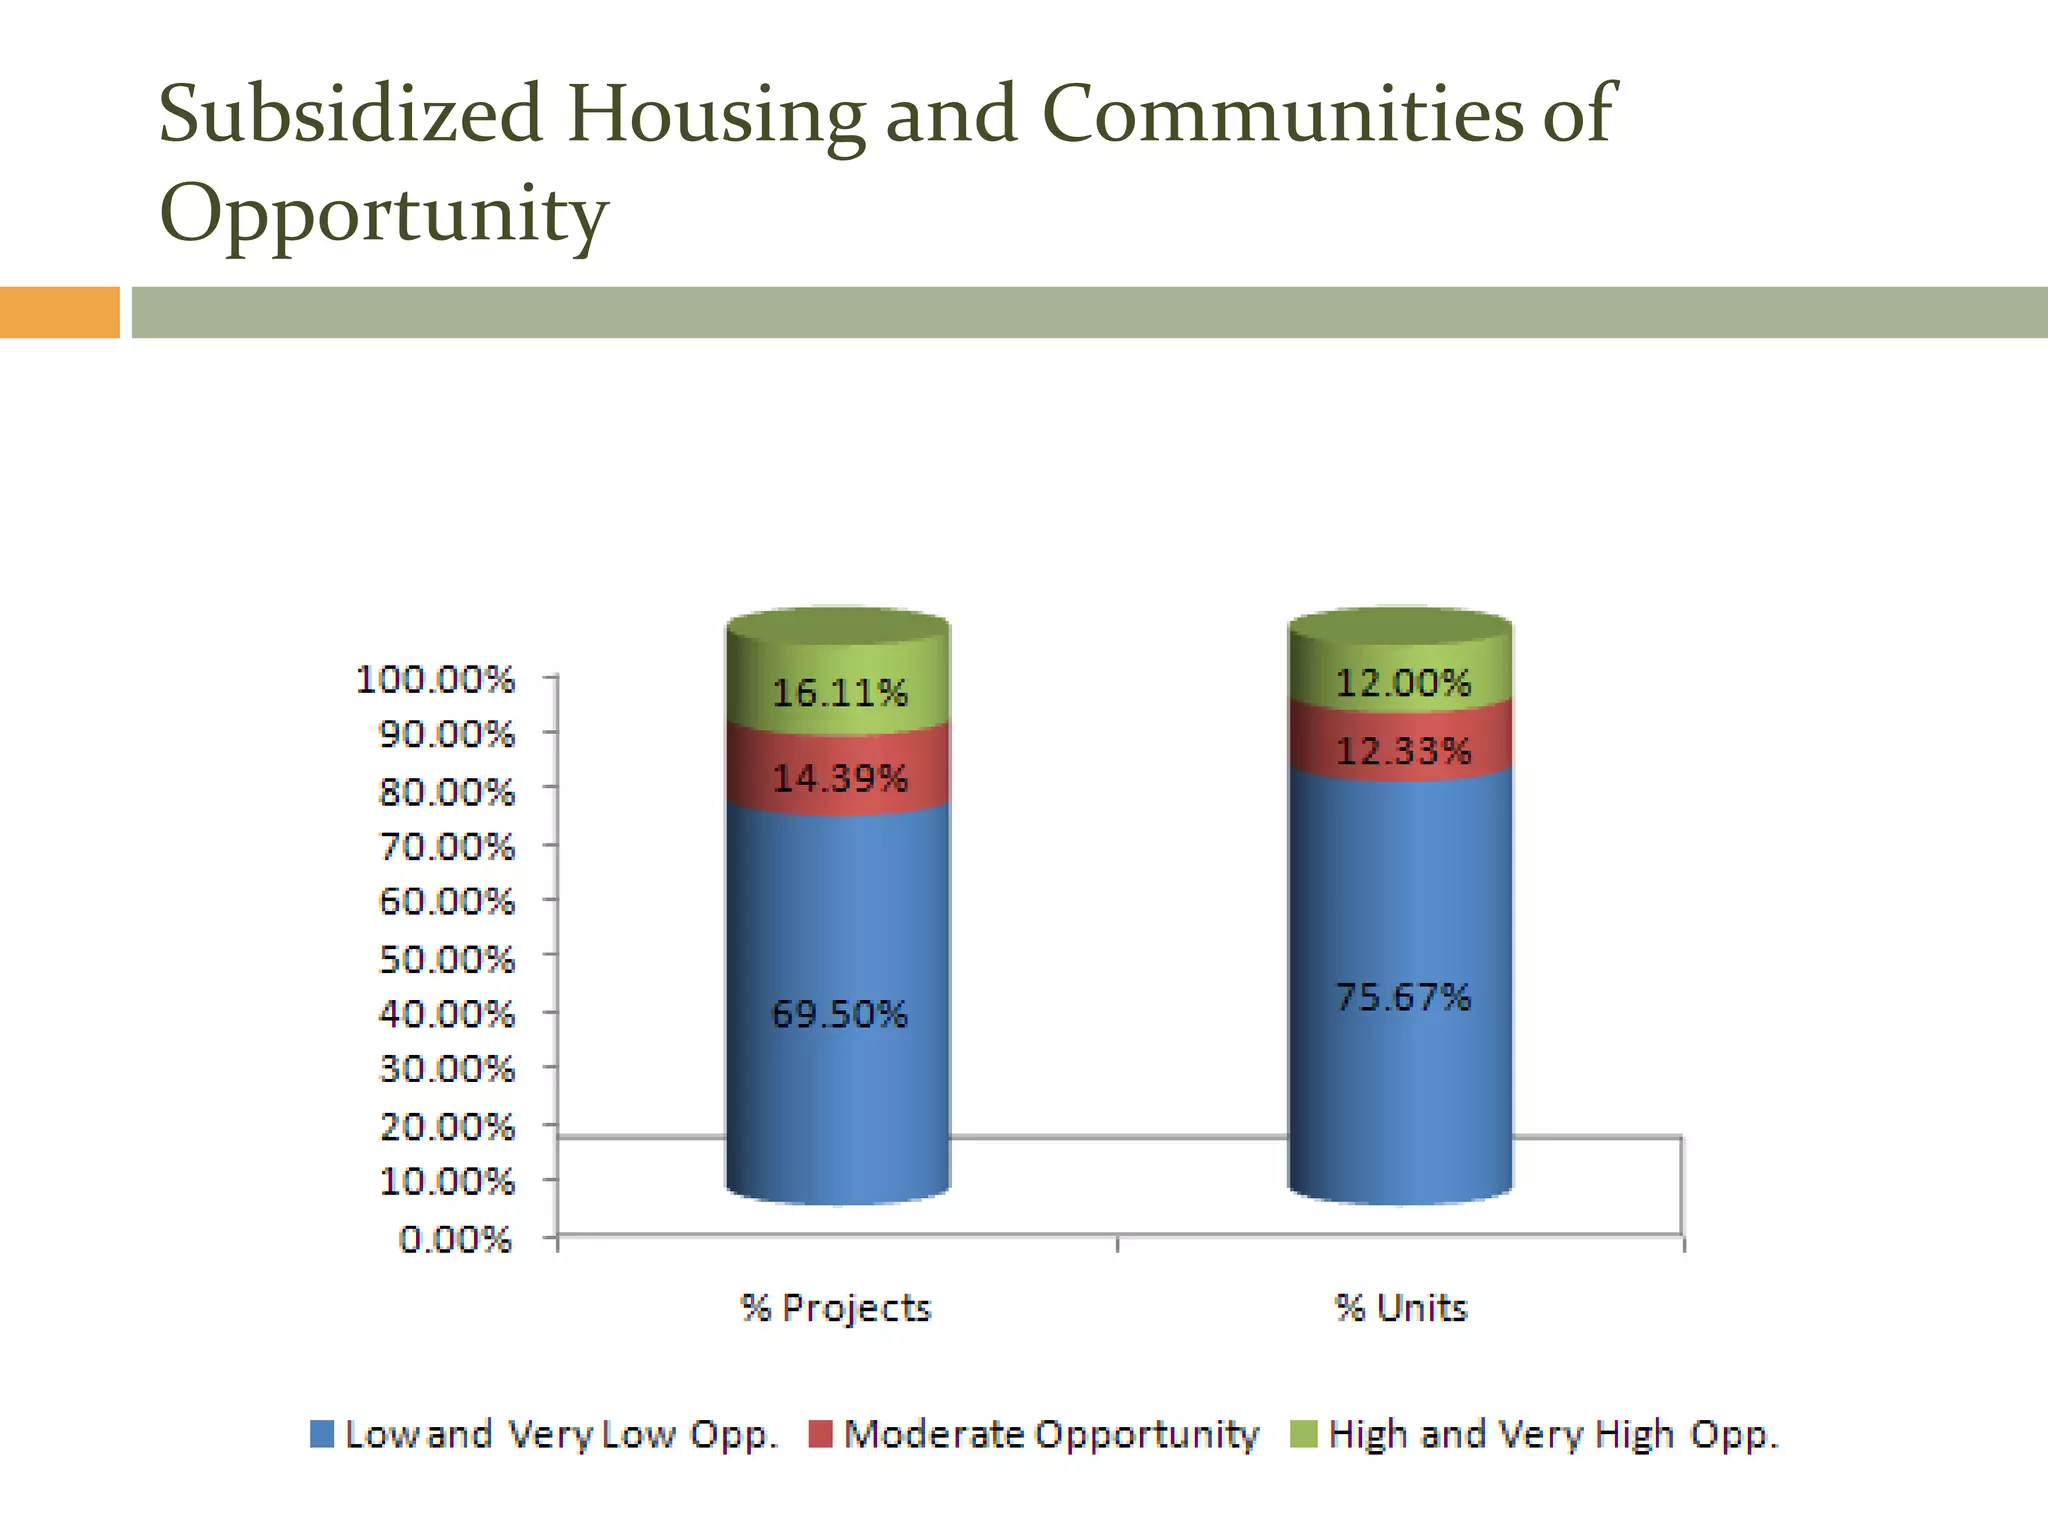
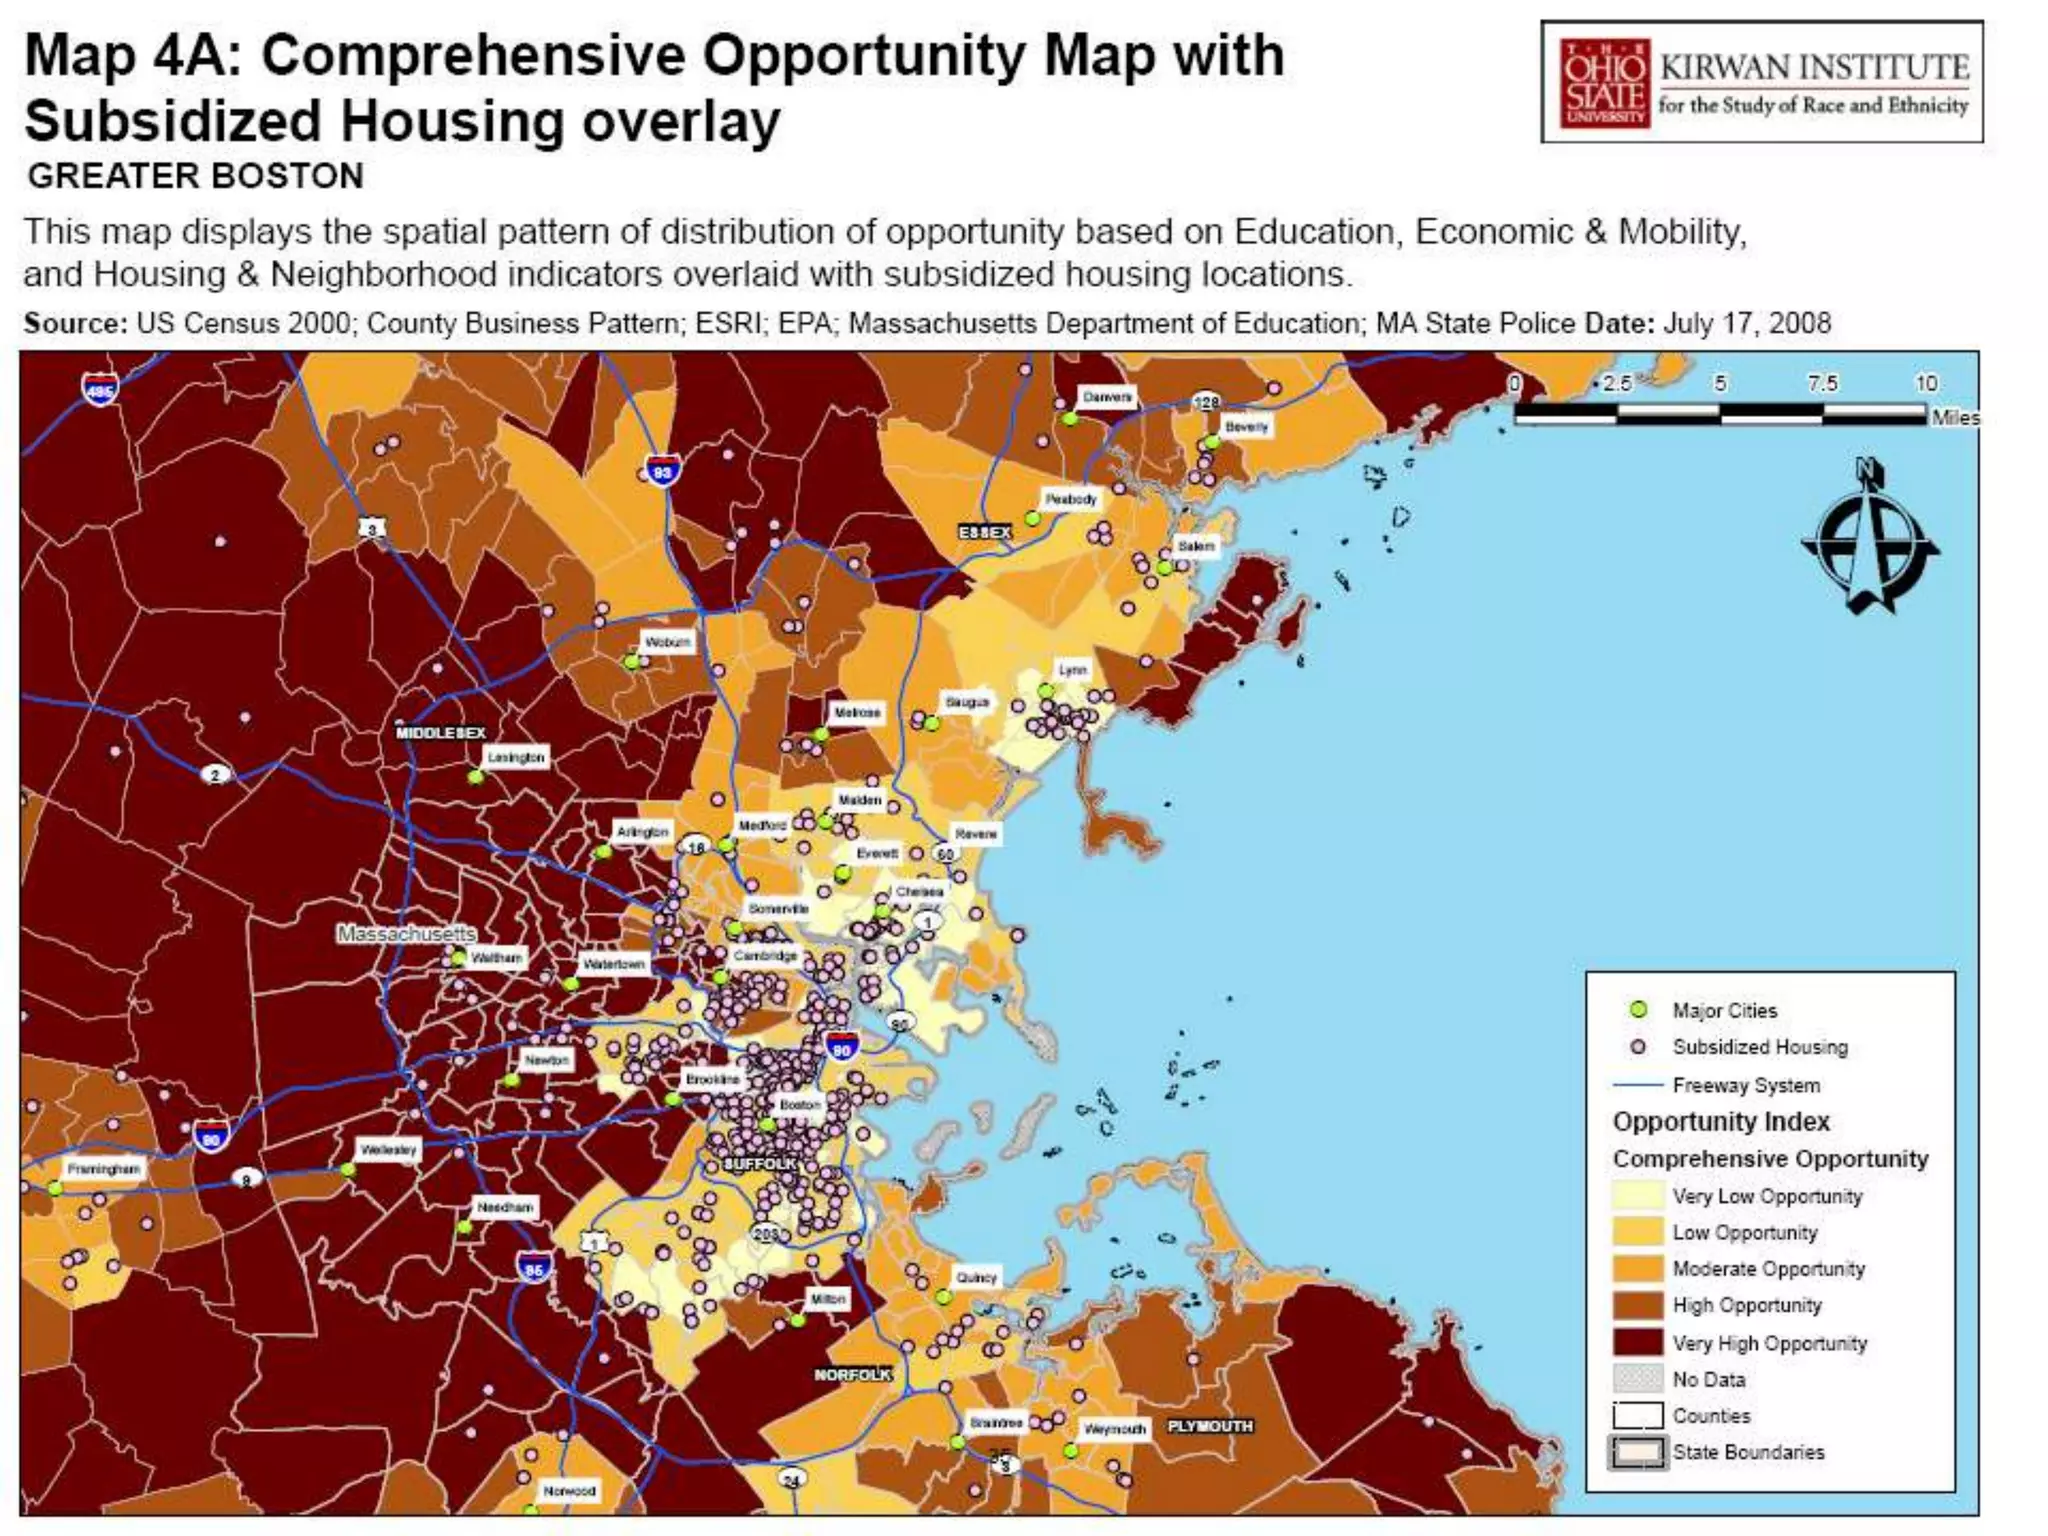
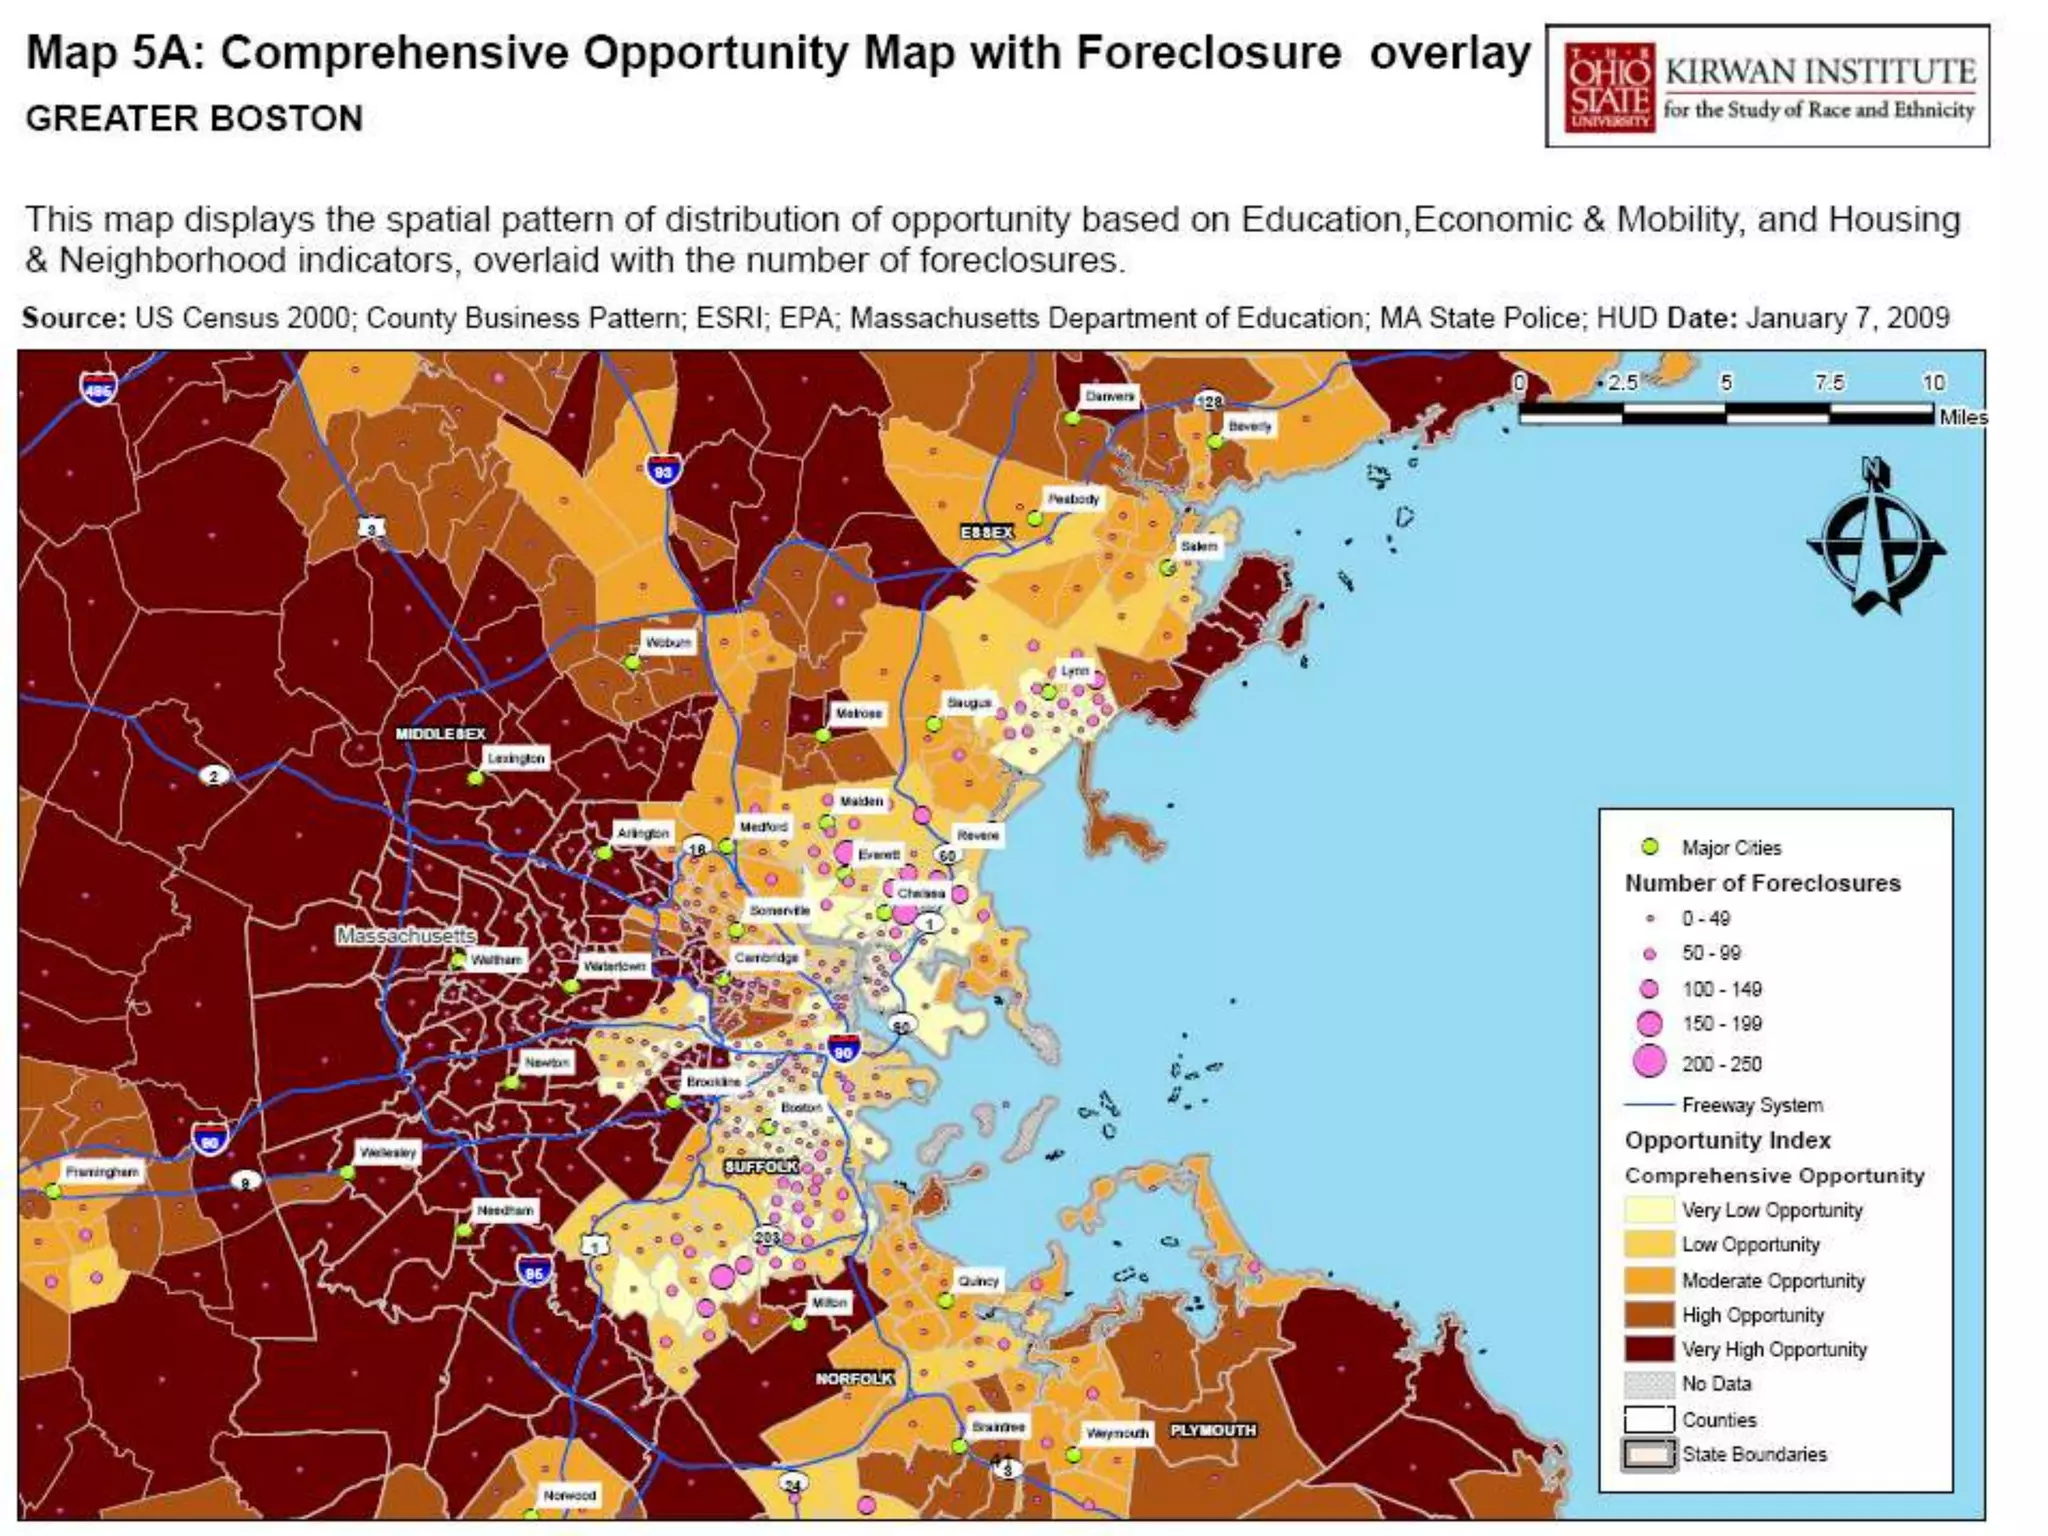
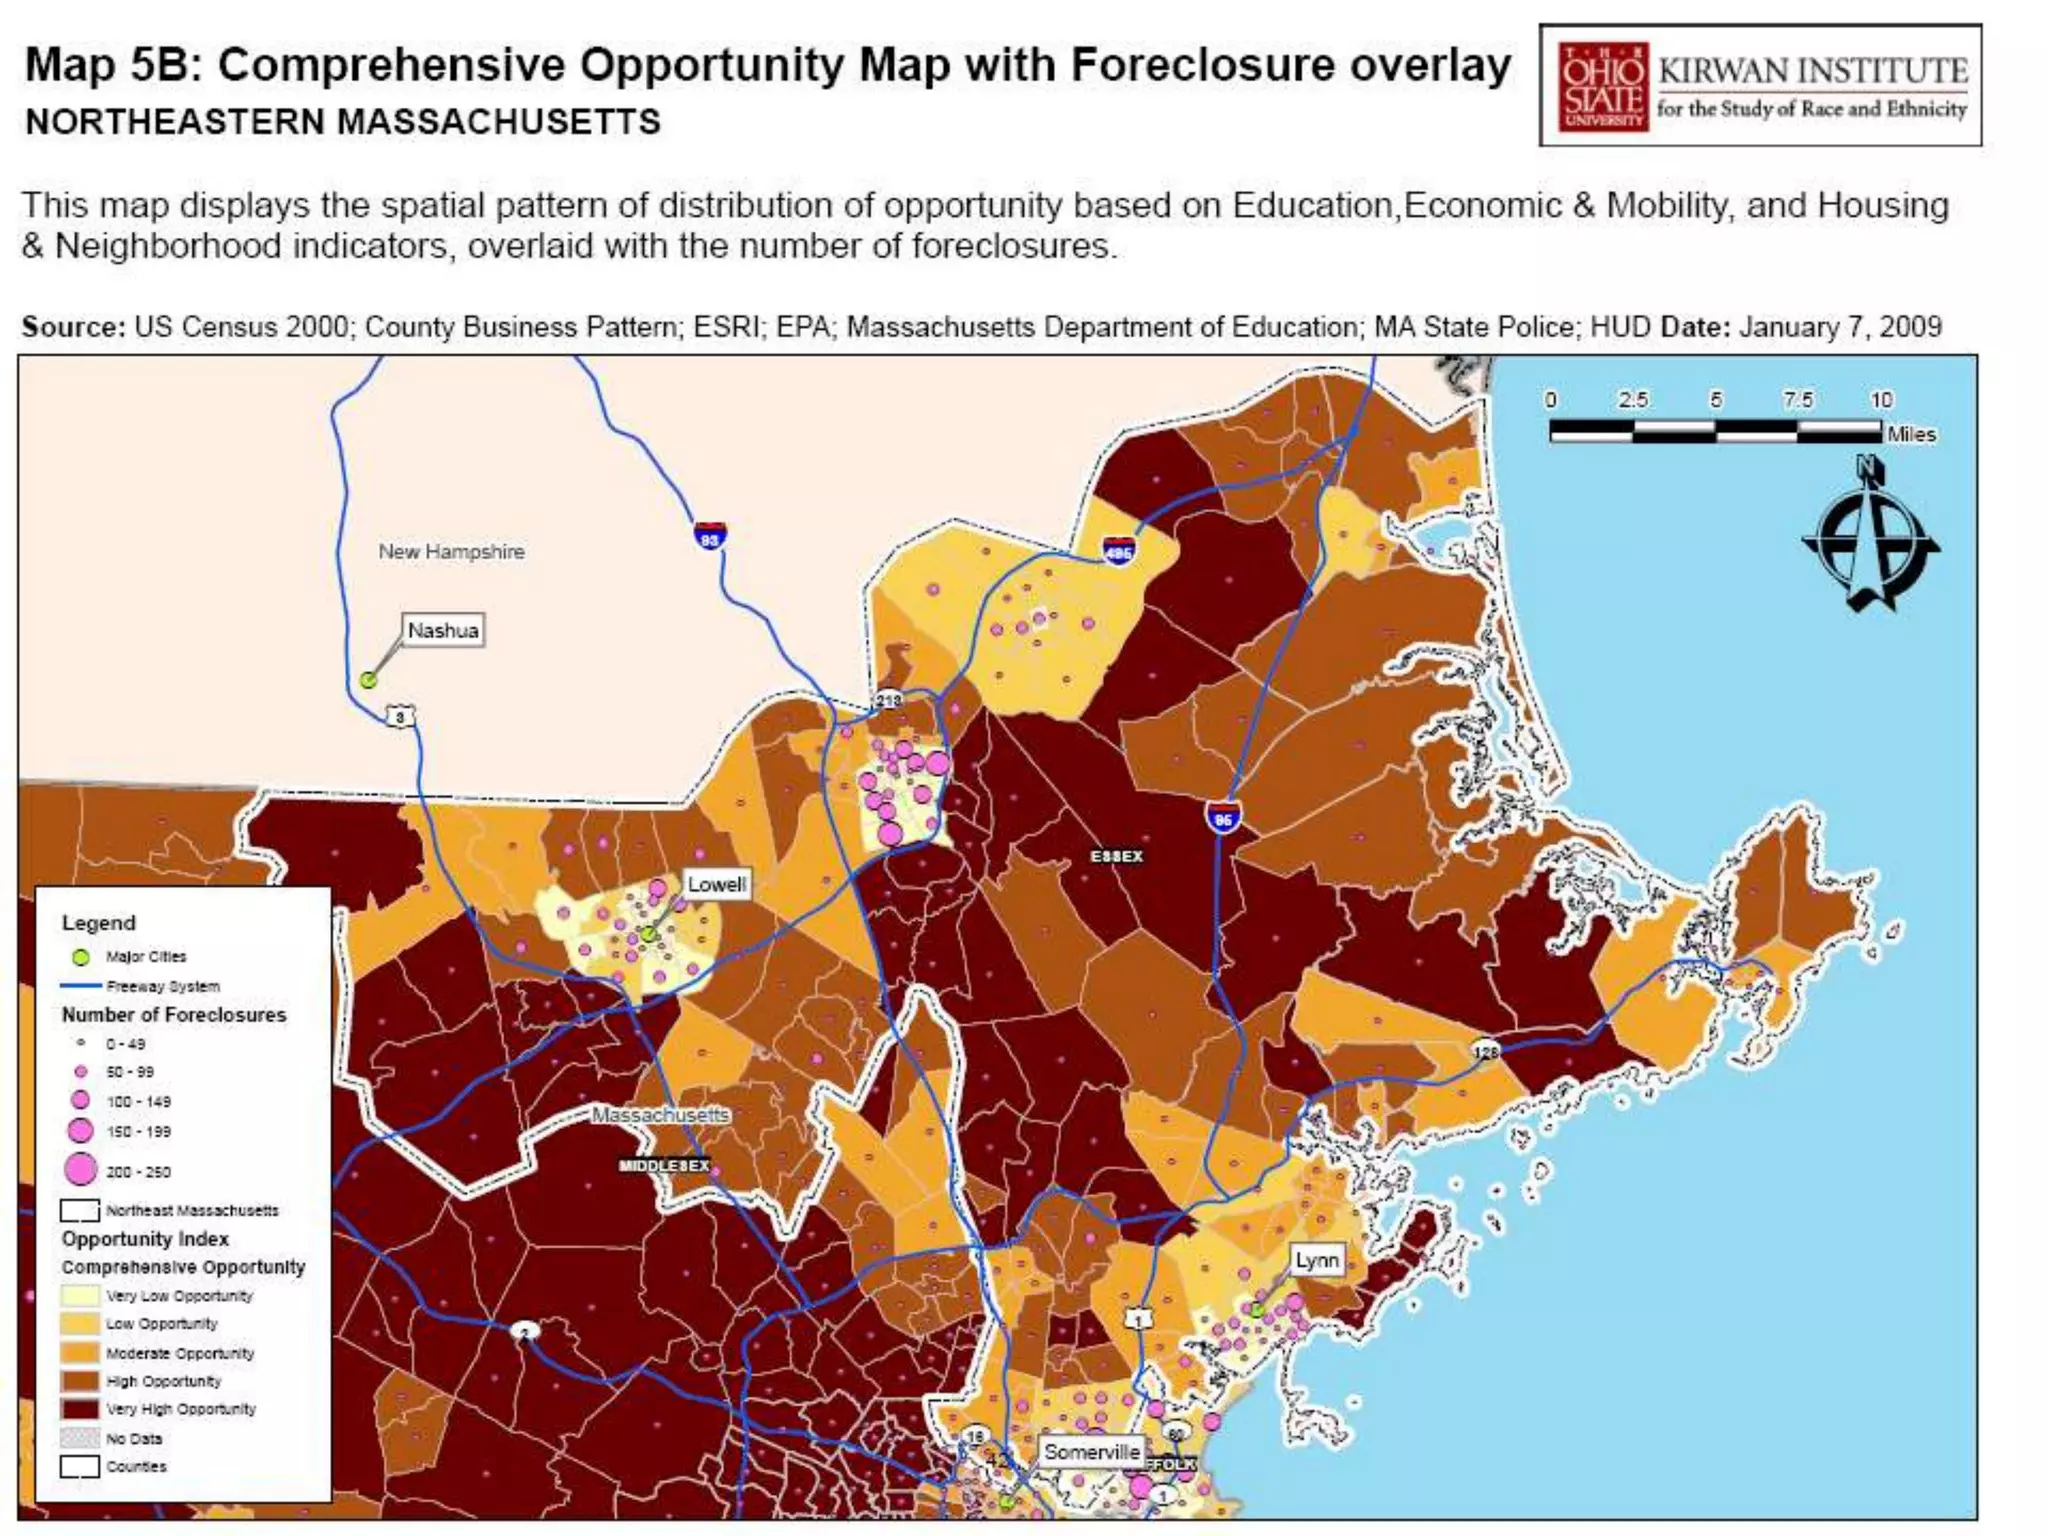
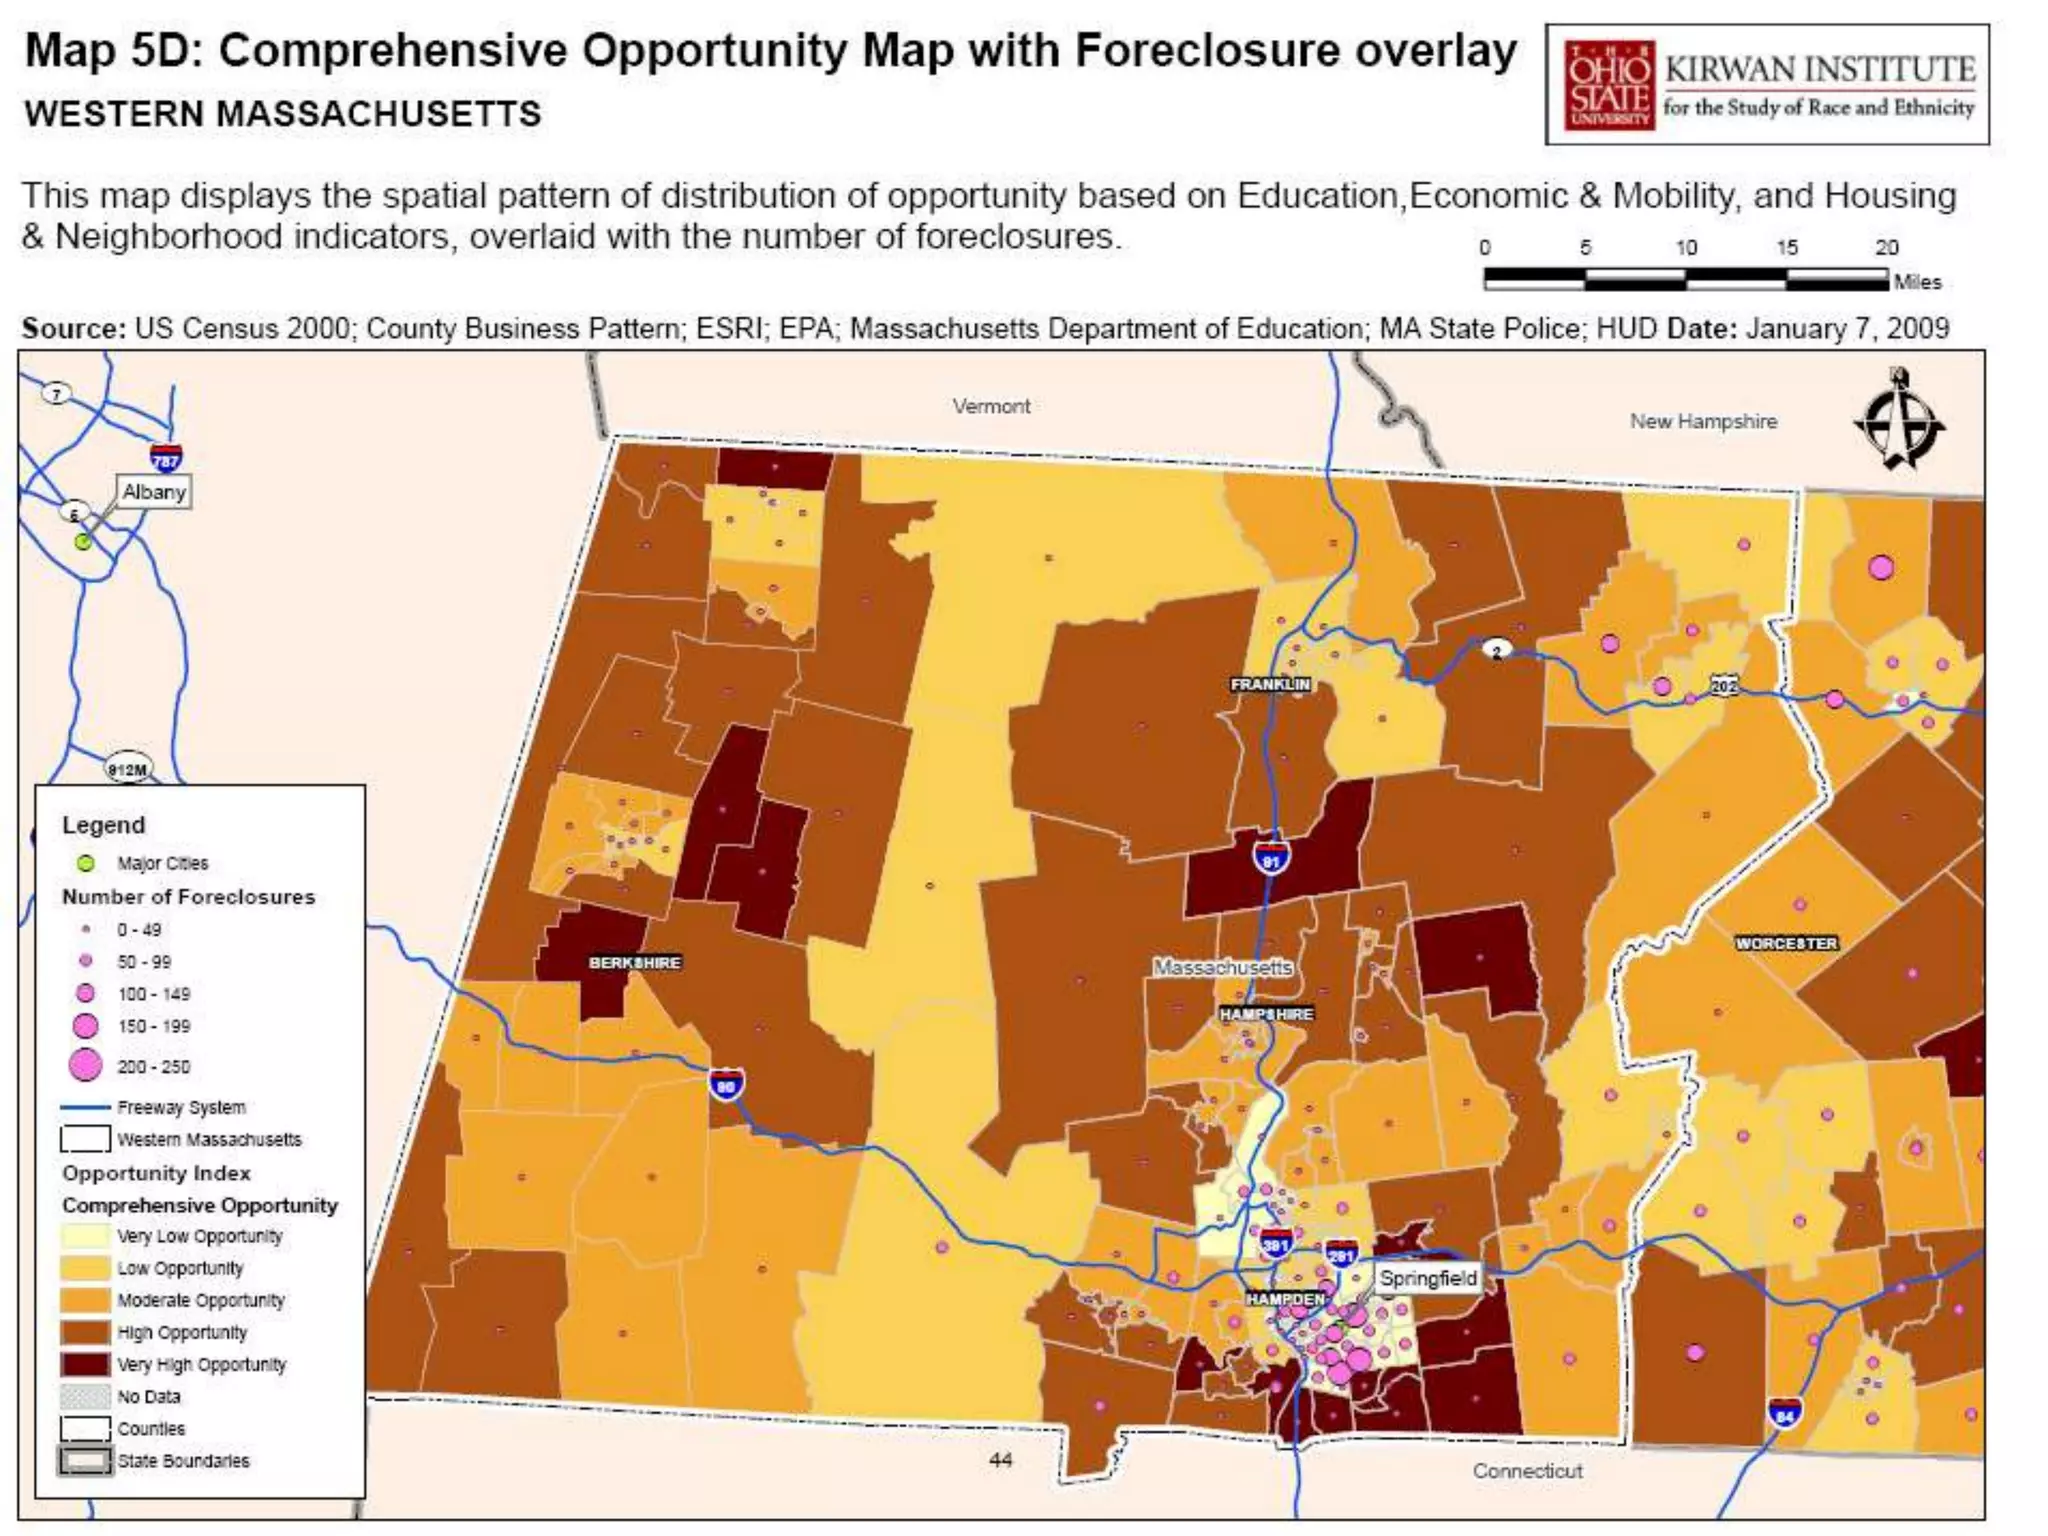
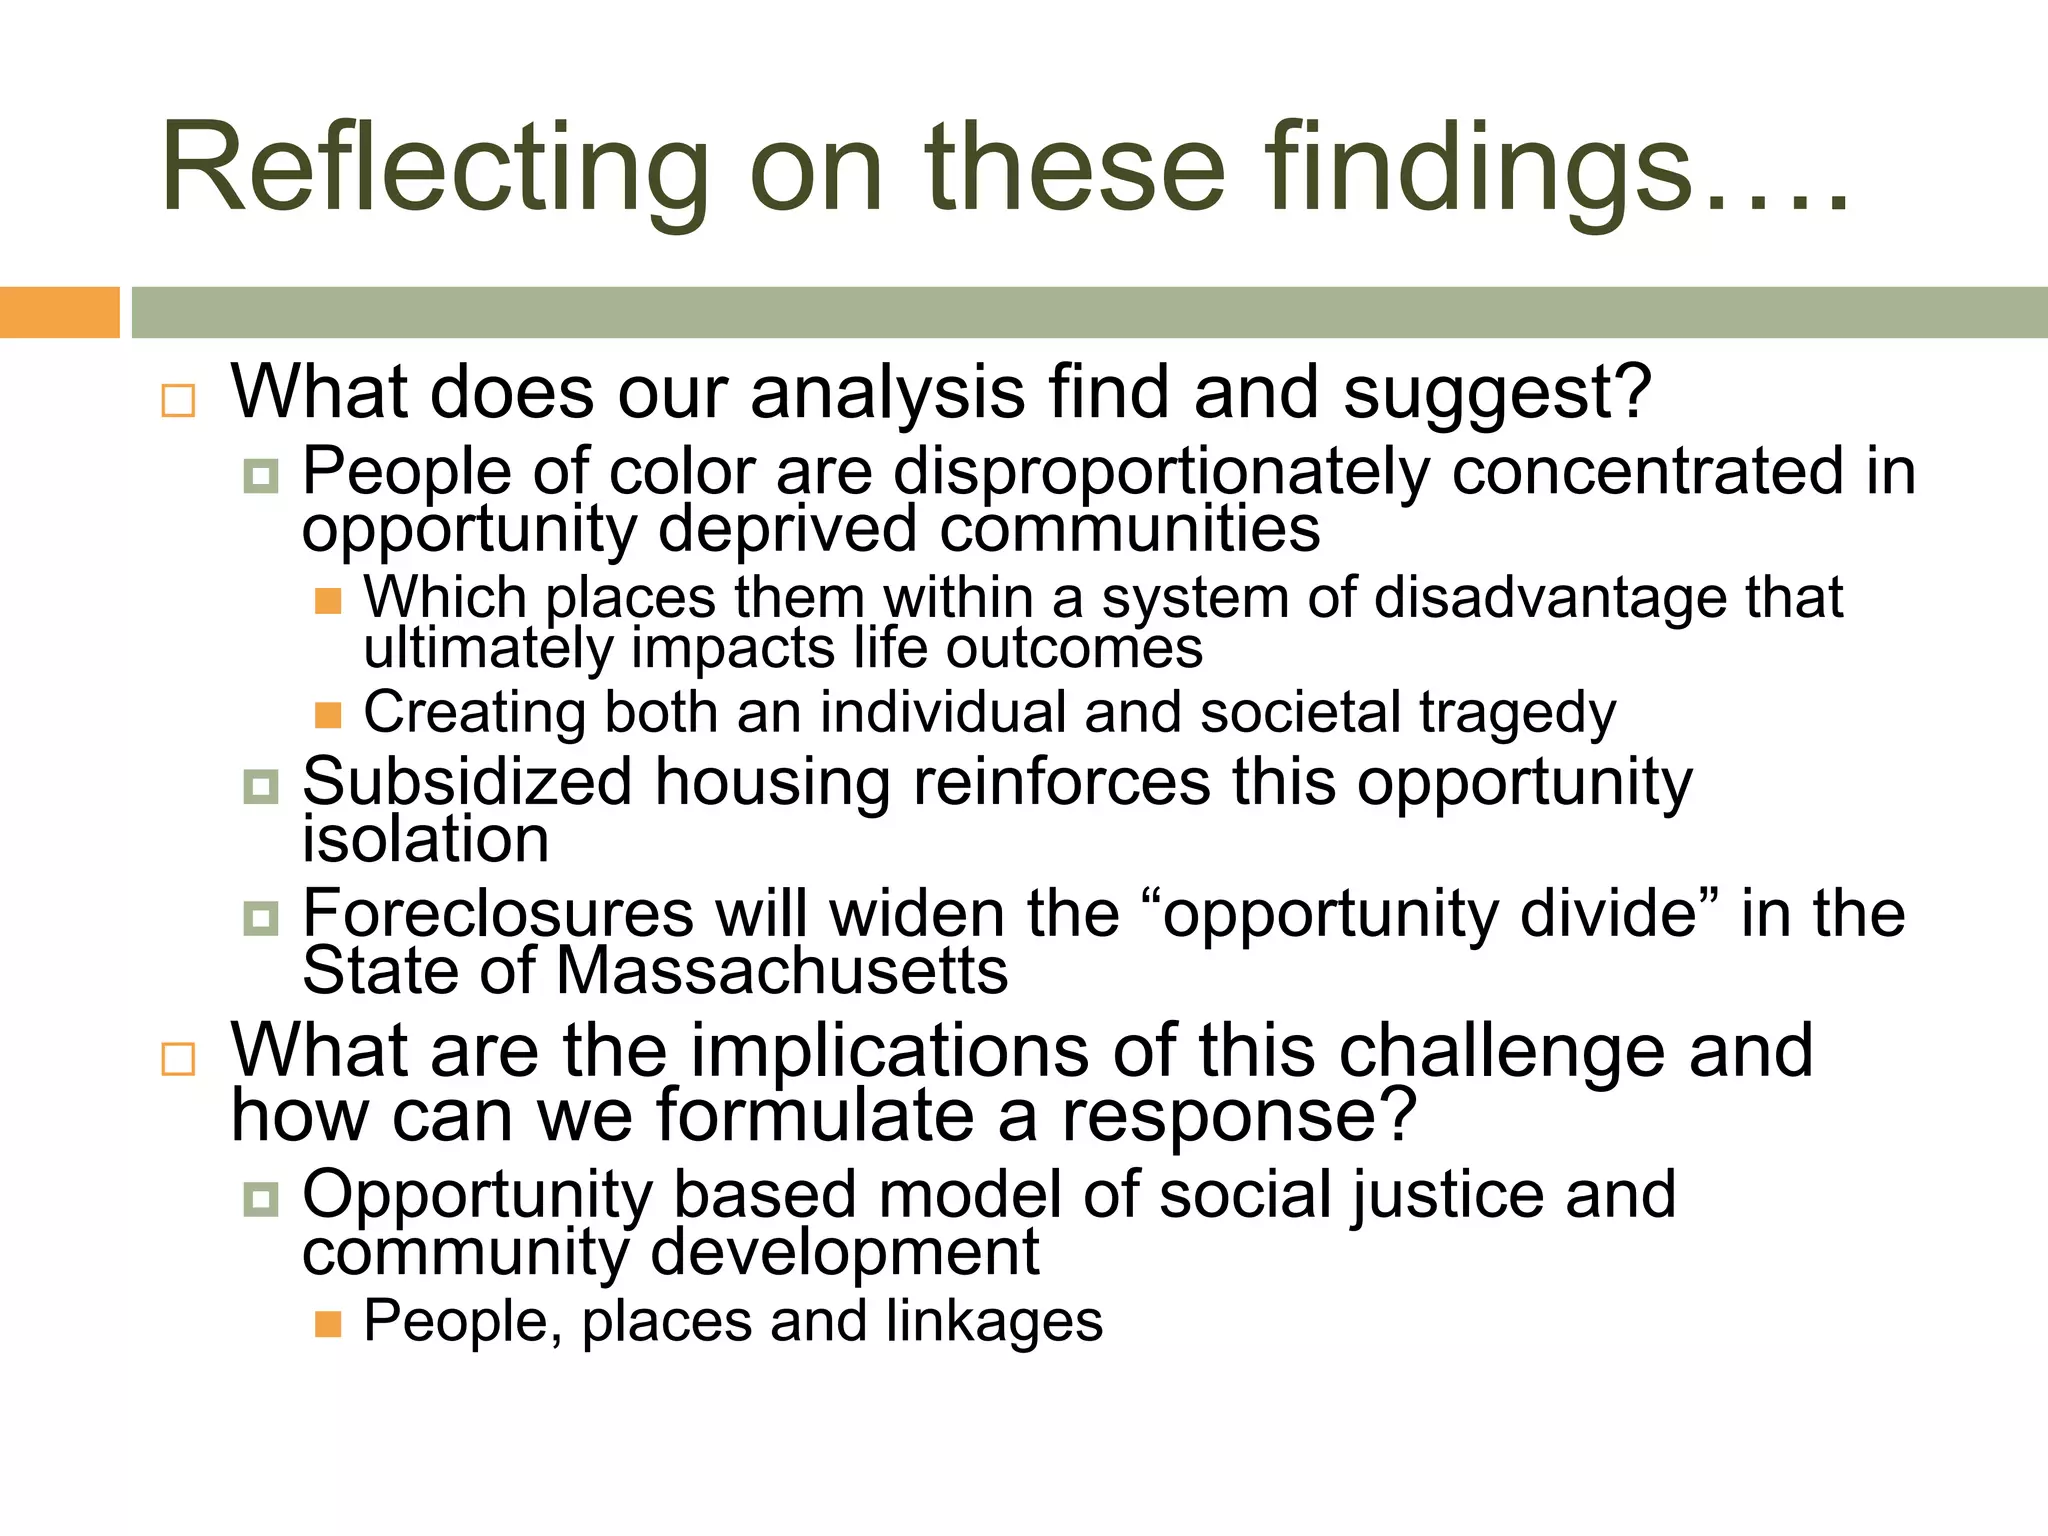
THE GEOGRAPHY OF
                        OPPORTUNITY

                        Building Communities of
                        Opportunity in Massachusetts
                        February 26, 2009
                        Harvard Law School
                        Cambridge, MA


                        Jason Reece, AICP
                        Senior Researcher
                        The Kirwan Institute for the Study of Race & Ethnicity
                        The Ohio State University
                        Reece.35@osu.edu


Presented by The Boston Lawyer Chapter of the American Constitution
Society and the Racial Justice Program of the American Civil Liberties Union
Section 1

Introduction
   Background on this project
     Origins (SR symposium)
     KI mapping and legal
      services
   Today’s discussion
     Opportunity matters
     Mapping opportunity
           Why and how…
       Opportunity mapping in MA
           Results
                 The intersection of
                  opportunity race and class
                 Opportunity, housing and the
                  foreclosure crisis
Section 2
Opportunity Matters: Space, Place, and Life
Outcomes

   “Opportunity” is a situation or condition that places individuals in a
    position to be more likely to succeed or excel.
   Opportunity structures are critical to opening pathways to success:
      High-quality education

      Healthy and safe environment

      Stable housing

      Sustainable employment

      Political empowerment

      Outlets for wealth-building

      Positive social networks
Opportunity Matters:
         Neighborhoods & Access to Opportunity

   Five decades of research
    indicate that your environment
    has a profound impact on your
    access to opportunity and
    likelihood of success
   High poverty areas with poor
    employment, underperforming
    schools, distressed housing and
    public health/safety risks
    depress life outcomes
       A system of disadvantage
       Many manifestations
           Urban, rural, suburban
   People of color are far more
    likely to live in opportunity
    deprived neighborhoods and
    communities
                                                 4
Which community would you choose?
To be safe and have positive health outcomes? For your kids to receive a quality
education? Which community would be better for employment and have a more
sustainable tax base?
What are the implications of
opportunity isolation?
   Individual
       Poor economic outcomes, lower educational outcomes,
        degraded asset development
       Poor health conditions, higher exposure and risk from
        crime
       Psychological distress, weak social and professional
        networks
   Community/Economy
       High social costs, distressed and stressed communities,
        fiscal challenges
       Weakened civic engagement and democratic participation
       Underdeveloped human capital, poor labor outlook, poor
        economic development prospects
Section 3
Mapping Opportunity: Why and How

Inequality has a geographic footprint

Maps can visually track the history and presence of
 discriminatory and exclusionary policies that spatially
 segregate people

Identifying places with gaps in opportunity can help direct
  future investment and identify structures which impede
  access to opportunity
Mapping Opportunity: Why and How

   The Kirwan Institute has
    conducted “opportunity
    mapping” for states and
    metropolitan regions across
    the US
   Why identify the “State of
    Opportunity”
       How are low-income groups
        situated in the State?
       How are racial and ethnic groups
        situated?
       What can be done to improve the
        opportunity landscape?
Opportunity Mapping in Litigation:
Thompson v. HUD (Remedial
Proposal)
  Submitted expert reports in
   both the liability and the
   remedy phases of the
   litigation, on behalf of
   plaintiffs
  Used GIS to analyze
   current conditions of
   segregated public housing
   (liability phase) and frame
   solutions for desegregation
   (remedy phase) in a
   regional context
Mapping Communities of Opportunity: Methods
and Indicators

   How do you map opportunity?
      Data representing community conditions was
       gathered for neighborhood (census tracts)
       across the state
            Data for all indicators of community conditions
             was aggregated to the Census Tract level and
             analyzed to create a comprehensive opportunity
             index for the census tracts (neighborhoods)
             throughout the state
       The opportunity index is then mapped and
        census tracts are broken into quintiles based
        on their opportunity score
            Very Low, Low, Moderate, High, Very High
Mapping Communities of Opportunity: Methods
    and Indicators


   Three areas of
    opportunity were
    analyzed using GIS
    mapping capability:
       Education Quality and
        Opportunity
       Economic Health and
        Transportation
       Neighborhood Stability and
        Health
Opportunity Mapping
   Education Quality and Opportunity
       Student Expenditures
       Student Poverty Rate
       Test Scores for Schools
       Graduation and Dropout Rates
       Teacher Qualifications
Opportunity Mapping
   Economic Health and Transportation
       Unemployment Rates
       Population on Public Assistance
       Proximity to Employment
       Employment Change: 2000-2005
       Mean Commute Time
Opportunity Mapping
   Neighborhood Stability and Health
       Home Values
       Neighborhood Vacancy Rates
       Crime
       Neighborhood Poverty
       Home Ownership Rate
       Proximity to Toxic Waste Sites
       Superfund Sites
Comprehensive Opportunity Map
Comprehensive Opportunity Map: Greater Boston
Comprehensive Opportunity Map: Northeastern Massachusetts
Access to Opportunity:
Race, Ethnicity, and Class

   Racialized isolation from neighborhoods of
    opportunity is stunning in Massachusetts

   Immigrants from Africa and Latin America were
    found to be disproportionately concentrated in
    low-opportunity neighborhoods

   Racial isolation into low-opportunity
    neighborhoods is more pronounced than
    class-based segregation into these
    communities
Access to Opportunity: Race
   Racialized isolation from neighborhoods of
    opportunity in Massachusetts:
     More than 90% of African-American and Latino
      households in were isolated in the lowest
      opportunity neighborhoods in the State
     Over 55% of Asian households were found in low-
      opportunity neighborhoods
     By contrast, only 31% of White, Non-Latino
      households were found in low-opportunity
      neighborhoods
Access to Opportunity: Race
Access to Opportunity: Immigrants

   Non-native born Africans and Latinos are
    disproportionately concentrated in low-
    opportunity neighborhoods:
     42%  of European-born and 46% of Asian-born
      residents live in low-opportunity neighborhoods
     By contrast, more 70% of non-native born African
      and Latin American residents live in low-
      opportunity neighborhoods
Access to Opportunity: Class
   Racial isolation into low-opportunity
    neighborhoods is more pronounced than class-
    based segregation into these communities
     42% of low-income White households live in low-
      opportunity communities, while 33% live in high-
      opportunity community areas
     By contrast, more than 95% of low-income Latinos,
      93% of low-income African-Americans, and 71% of
      low-income Asians live in low-opportunity
      communities
     Approximately 90% of high-income African-Americans
      and Latinos live in low-opportunity communities
Subsidized Housing and Communities of
Opportunity

   Housing is a strategic intervention point into
    opportunity and advancement
     However, 100,000 (nearly 76%) subsidized
      housing units in the State is in low-opportunity
      communities
     Only 17,000 units (roughly 12%) of subsidized
      housing are in high-opportunity communities
Subsidized Housing and Communities of
Opportunity


       Comprehensive Opportunity Map: Southeastern Massachusetts
Residential Foreclosure and Opportunity

Over half of the State’s estimated amount of high-
 cost HMDA loans, residential foreclosures, and
 90-day residential foreclosures were located in
 low-opportunity neighborhoods

This data shows the strong relationship between
  poor lending practices, foreclosure, and
  vacancy, all of which have been
  disproportionately concentrated in low-
  opportunity neighborhoods
Residential Foreclosure and Opportunity


Distribution of Residential Factors Across the Community Opportunity Spectrum
Reflecting on these findings….
   What does our analysis find and suggest?
       People of color are disproportionately concentrated in
        opportunity deprived communities
         Which places them within a system of disadvantage that
          ultimately impacts life outcomes
         Creating both an individual and societal tragedy
     Subsidized housing reinforces this opportunity
      isolation
     Foreclosures will widen the “opportunity divide” in the
      State of Massachusetts
   What are the implications of this challenge and
    how can we formulate a response?
       Opportunity based model of social justice and
        community development
           People, places and linkages
To access this report and other resources please
visit us on-line at: www.kirwaninstitute.org


                                             41

Building Communities of Opportunity in Massachusetts

  • 1.
    THE GEOGRAPHY OF OPPORTUNITY Building Communities of Opportunity in Massachusetts February 26, 2009 Harvard Law School Cambridge, MA Jason Reece, AICP Senior Researcher The Kirwan Institute for the Study of Race & Ethnicity The Ohio State University Reece.35@osu.edu Presented by The Boston Lawyer Chapter of the American Constitution Society and the Racial Justice Program of the American Civil Liberties Union
  • 2.
    Section 1 Introduction  Background on this project  Origins (SR symposium)  KI mapping and legal services  Today’s discussion  Opportunity matters  Mapping opportunity  Why and how…  Opportunity mapping in MA  Results  The intersection of opportunity race and class  Opportunity, housing and the foreclosure crisis
  • 3.
    Section 2 Opportunity Matters:Space, Place, and Life Outcomes  “Opportunity” is a situation or condition that places individuals in a position to be more likely to succeed or excel.  Opportunity structures are critical to opening pathways to success:  High-quality education  Healthy and safe environment  Stable housing  Sustainable employment  Political empowerment  Outlets for wealth-building  Positive social networks
  • 4.
    Opportunity Matters: Neighborhoods & Access to Opportunity  Five decades of research indicate that your environment has a profound impact on your access to opportunity and likelihood of success  High poverty areas with poor employment, underperforming schools, distressed housing and public health/safety risks depress life outcomes  A system of disadvantage  Many manifestations  Urban, rural, suburban  People of color are far more likely to live in opportunity deprived neighborhoods and communities 4
  • 5.
    Which community wouldyou choose? To be safe and have positive health outcomes? For your kids to receive a quality education? Which community would be better for employment and have a more sustainable tax base?
  • 6.
    What are theimplications of opportunity isolation?  Individual  Poor economic outcomes, lower educational outcomes, degraded asset development  Poor health conditions, higher exposure and risk from crime  Psychological distress, weak social and professional networks  Community/Economy  High social costs, distressed and stressed communities, fiscal challenges  Weakened civic engagement and democratic participation  Underdeveloped human capital, poor labor outlook, poor economic development prospects
  • 7.
    Section 3 Mapping Opportunity:Why and How Inequality has a geographic footprint Maps can visually track the history and presence of discriminatory and exclusionary policies that spatially segregate people Identifying places with gaps in opportunity can help direct future investment and identify structures which impede access to opportunity
  • 8.
    Mapping Opportunity: Whyand How  The Kirwan Institute has conducted “opportunity mapping” for states and metropolitan regions across the US  Why identify the “State of Opportunity”  How are low-income groups situated in the State?  How are racial and ethnic groups situated?  What can be done to improve the opportunity landscape?
  • 9.
    Opportunity Mapping inLitigation: Thompson v. HUD (Remedial Proposal)  Submitted expert reports in both the liability and the remedy phases of the litigation, on behalf of plaintiffs  Used GIS to analyze current conditions of segregated public housing (liability phase) and frame solutions for desegregation (remedy phase) in a regional context
  • 10.
    Mapping Communities ofOpportunity: Methods and Indicators  How do you map opportunity?  Data representing community conditions was gathered for neighborhood (census tracts) across the state  Data for all indicators of community conditions was aggregated to the Census Tract level and analyzed to create a comprehensive opportunity index for the census tracts (neighborhoods) throughout the state  The opportunity index is then mapped and census tracts are broken into quintiles based on their opportunity score  Very Low, Low, Moderate, High, Very High
  • 11.
    Mapping Communities ofOpportunity: Methods and Indicators  Three areas of opportunity were analyzed using GIS mapping capability:  Education Quality and Opportunity  Economic Health and Transportation  Neighborhood Stability and Health
  • 12.
    Opportunity Mapping  Education Quality and Opportunity  Student Expenditures  Student Poverty Rate  Test Scores for Schools  Graduation and Dropout Rates  Teacher Qualifications
  • 13.
    Opportunity Mapping  Economic Health and Transportation  Unemployment Rates  Population on Public Assistance  Proximity to Employment  Employment Change: 2000-2005  Mean Commute Time
  • 14.
    Opportunity Mapping  Neighborhood Stability and Health  Home Values  Neighborhood Vacancy Rates  Crime  Neighborhood Poverty  Home Ownership Rate  Proximity to Toxic Waste Sites  Superfund Sites
  • 15.
  • 16.
  • 17.
    Comprehensive Opportunity Map:Northeastern Massachusetts
  • 21.
    Access to Opportunity: Race,Ethnicity, and Class  Racialized isolation from neighborhoods of opportunity is stunning in Massachusetts  Immigrants from Africa and Latin America were found to be disproportionately concentrated in low-opportunity neighborhoods  Racial isolation into low-opportunity neighborhoods is more pronounced than class-based segregation into these communities
  • 22.
    Access to Opportunity:Race  Racialized isolation from neighborhoods of opportunity in Massachusetts:  More than 90% of African-American and Latino households in were isolated in the lowest opportunity neighborhoods in the State  Over 55% of Asian households were found in low- opportunity neighborhoods  By contrast, only 31% of White, Non-Latino households were found in low-opportunity neighborhoods
  • 23.
  • 29.
    Access to Opportunity:Immigrants  Non-native born Africans and Latinos are disproportionately concentrated in low- opportunity neighborhoods:  42% of European-born and 46% of Asian-born residents live in low-opportunity neighborhoods  By contrast, more 70% of non-native born African and Latin American residents live in low- opportunity neighborhoods
  • 30.
    Access to Opportunity:Class  Racial isolation into low-opportunity neighborhoods is more pronounced than class- based segregation into these communities  42% of low-income White households live in low- opportunity communities, while 33% live in high- opportunity community areas  By contrast, more than 95% of low-income Latinos, 93% of low-income African-Americans, and 71% of low-income Asians live in low-opportunity communities  Approximately 90% of high-income African-Americans and Latinos live in low-opportunity communities
  • 32.
    Subsidized Housing andCommunities of Opportunity  Housing is a strategic intervention point into opportunity and advancement  However, 100,000 (nearly 76%) subsidized housing units in the State is in low-opportunity communities  Only 17,000 units (roughly 12%) of subsidized housing are in high-opportunity communities
  • 33.
    Subsidized Housing andCommunities of Opportunity Comprehensive Opportunity Map: Southeastern Massachusetts
  • 35.
    Residential Foreclosure andOpportunity Over half of the State’s estimated amount of high- cost HMDA loans, residential foreclosures, and 90-day residential foreclosures were located in low-opportunity neighborhoods This data shows the strong relationship between poor lending practices, foreclosure, and vacancy, all of which have been disproportionately concentrated in low- opportunity neighborhoods
  • 36.
    Residential Foreclosure andOpportunity Distribution of Residential Factors Across the Community Opportunity Spectrum
  • 40.
    Reflecting on thesefindings….  What does our analysis find and suggest?  People of color are disproportionately concentrated in opportunity deprived communities  Which places them within a system of disadvantage that ultimately impacts life outcomes  Creating both an individual and societal tragedy  Subsidized housing reinforces this opportunity isolation  Foreclosures will widen the “opportunity divide” in the State of Massachusetts  What are the implications of this challenge and how can we formulate a response?  Opportunity based model of social justice and community development  People, places and linkages
  • 41.
    To access thisreport and other resources please visit us on-line at: www.kirwaninstitute.org 41