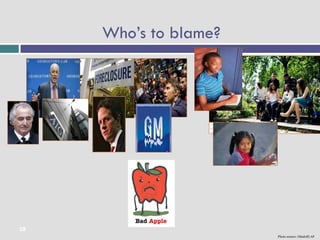
The document discusses structural racialization and opportunity through the lens of the speaker's life experiences. It summarizes:
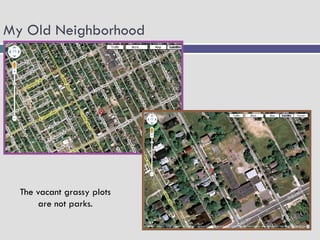
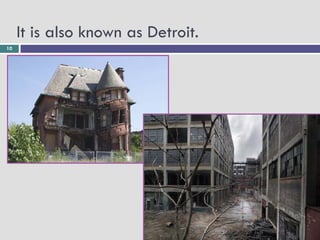
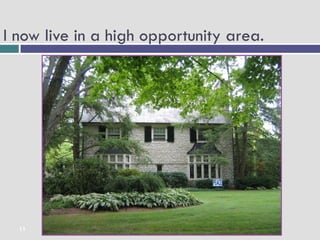
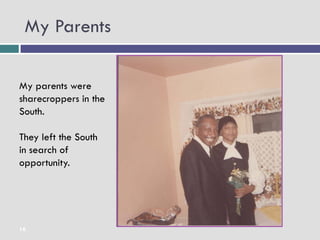
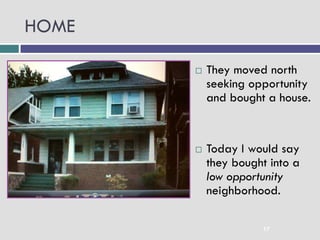
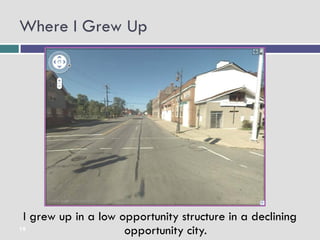
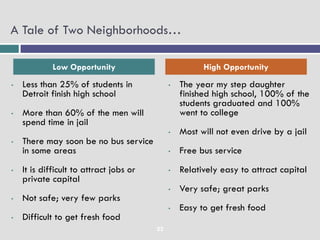
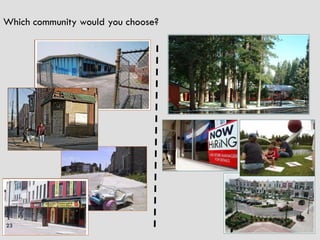
1) The speaker grew up in a low-opportunity neighborhood in Detroit but now lives in a high-opportunity area, highlighting the differences.
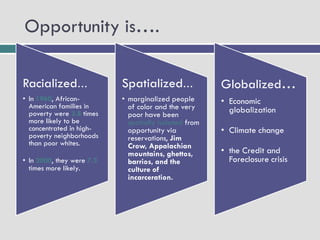
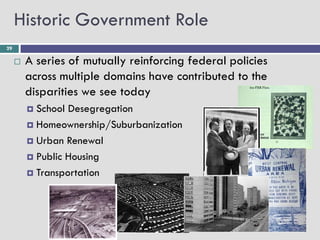
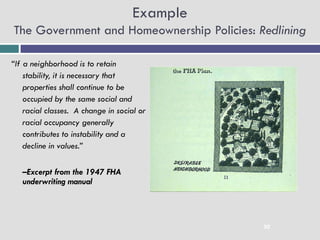
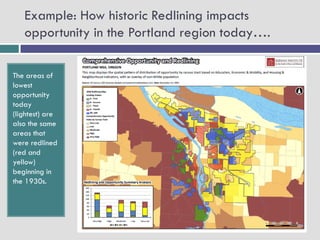
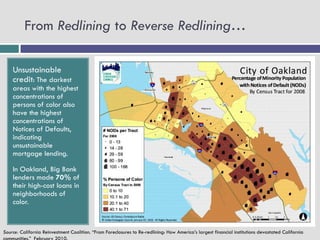
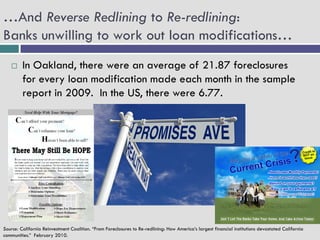
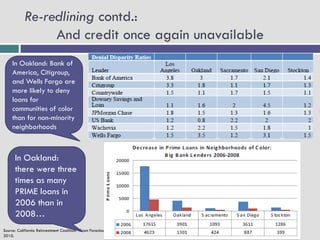
2) Government policies like redlining historically restricted opportunity for communities of color and these effects are still seen today through patterns of lending and foreclosures.
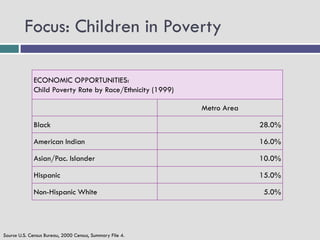
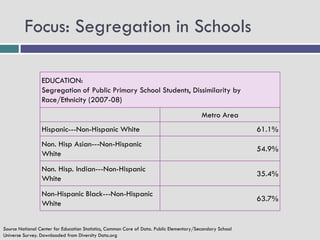
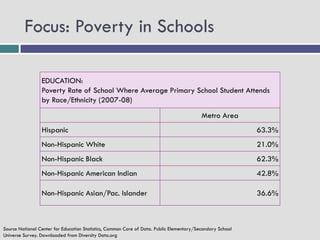
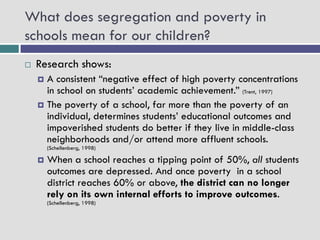
3) There are racial disparities in measures of child poverty, school segregation, and the poverty levels of schools different groups attend in the local region, indicating inequities in economic and educational opportunities.
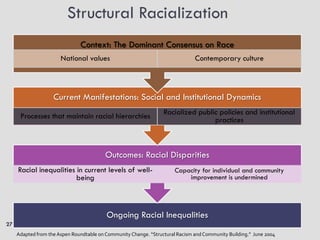
4) Renewing communities requires new ways of thinking, talking, and