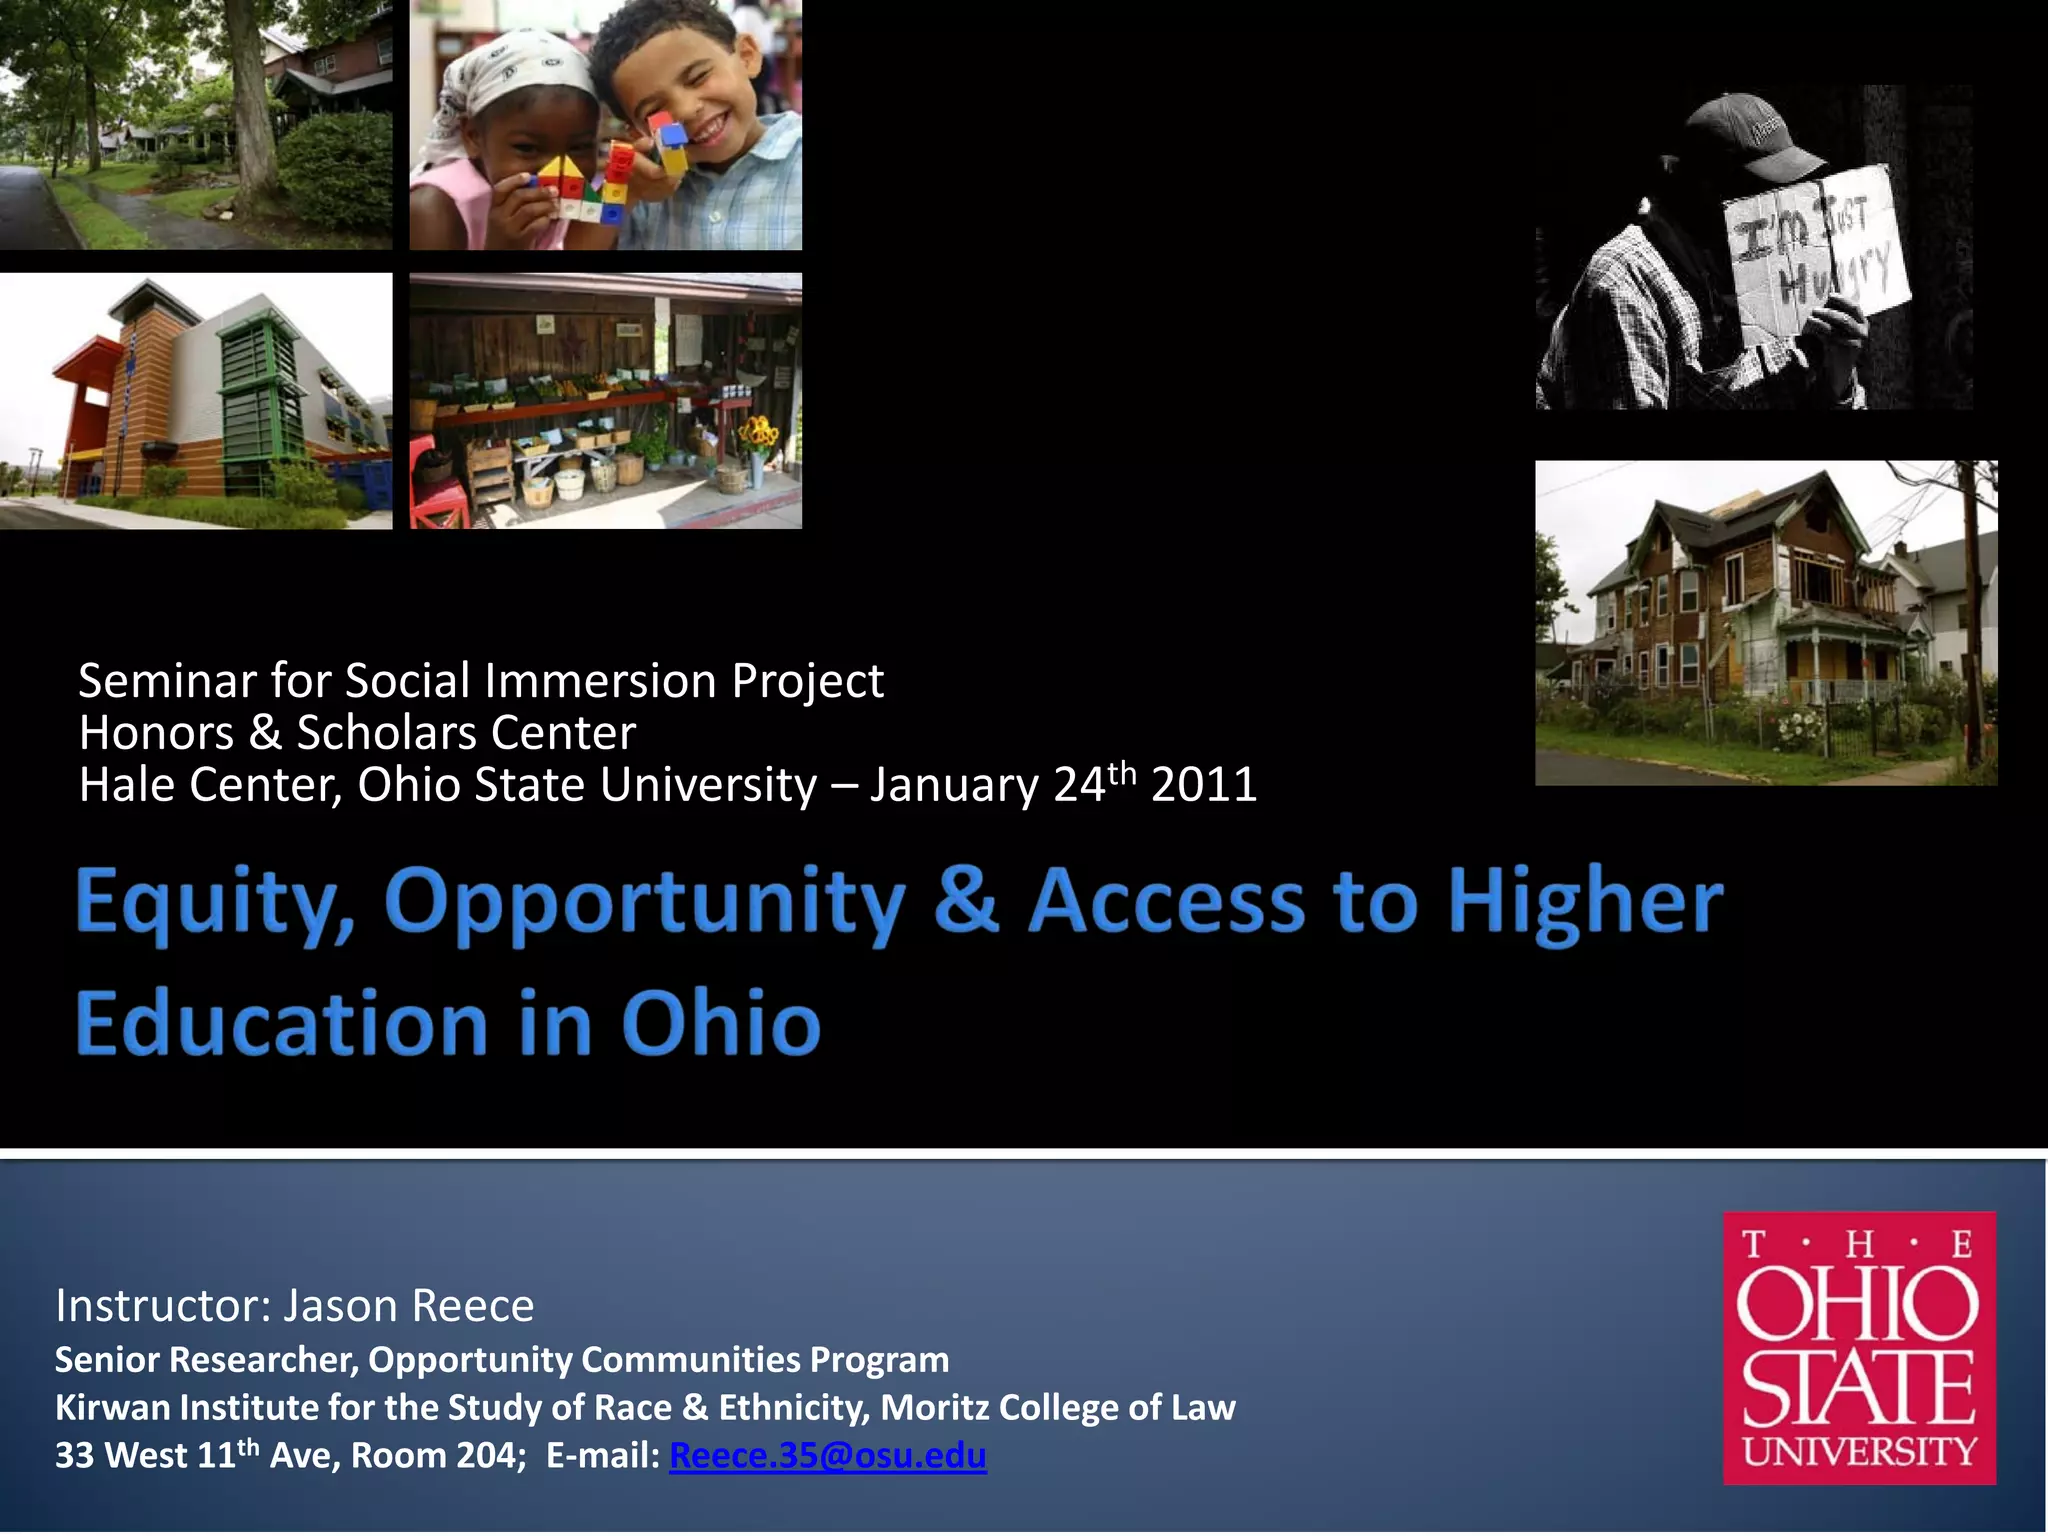
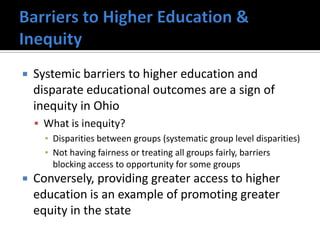
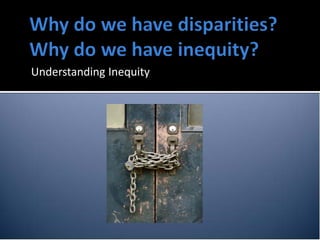
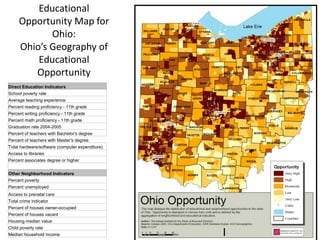
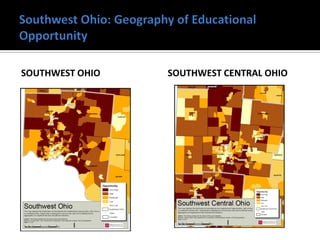
Seminar for Social Immersion Project
 Honors & Scholars Center
 Hale Center, Ohio State University – January 24th 2011


Instructor: Jason Reece
Senior Researcher, Opportunity Communities Program
Kirwan Institute for the Study of Race & Ethnicity, Moritz College of Law
33 West 11th Ave, Room 204; E-mail: Reece.35@osu.edu
   Access to higher education
     Unequal access to higher education as a form of
      inequity
     Understanding the impacts of inequity on our
      state and society
   How do we understand disparate outcomes in
    education in Ohio?
     What drives it?
     What can we do to improve it?
   Multidisciplinary applied research
    institute
     Our mission is to expand opportunity for
       all, especially for our most marginalized
       communities
   Founded in 2003 by john powell
    (executive director)
     Opportunity Communities Program
      ▪ Opening pathways to opportunity for
        marginalized communities through
        investments in people, places and
        supporting linkages
      ▪ Disrupting systems of disadvantage
      ▪ Opportunity mapping, Regional Equity,
        Neighborhood Revitalization, Opportunity
        Based Housing


                                                   3
   About me….

   About you….
     What’s your background?
     What inspired you to participate in this program?
     Are there particular questions or topics you would
     like me to address?
A Form of Inequity in Ohio
   What do you think?
     Why Should we about access to higher education
      in Ohio, or in our nation?
     Is their “fair” access to higher education in Ohio?
   For Ohio 9th graders
     Less than 3 in 4 will graduate
      High School
     Less than 2 out of 3 of those
                                       Source: Data and information
      graduates will go to college     derived from presentation by
     Only 1 in 2 of those will        Nancy Nestor Baker, available
                                       on-line at:
      graduate in 6 years              http://principalsoffice.osu.edu/f
                                       iles/zone.8.08.knowledge.php
     Resulting in only 1 in 5
      earning a bachelors degree
   For new jobs in our economy
     About 7 in 10 new jobs require post secondary education
     Only 1 in 10 are accessible for those with less than a high school
      diploma
     The recession has made these conditions worse (more
      competition)
   Systemic barriers to higher education and
    disparate educational outcomes are a sign of
    inequity in Ohio
     What is inequity?
      ▪ Disparities between groups (systematic group level disparities)
      ▪ Not having fairness or treating all groups fairly, barriers
        blocking access to opportunity for some groups
   Conversely, providing greater access to higher
    education is an example of promoting greater
    equity in the state
Understanding Inequity
   Who is impacted?                                         Other potential dimensions to
       Class                                                 inequity
       Race/Ethnicity                                          • Disparate impact of policies
       Gender                                                  • Often institutional and/or
       Language                                                  structural in nature
       Place/Geography                                         • Durable inequality
       Disability                                              • Cumulative disadvantage
       Sexual Orientation                                      • Denial of opportunity
       Age                                                     • Groups left out of the democratic
       Other????                                                 process
                                                                    • Limited political voice
   Intersectionality                                               • Limited agency
     Interaction of various factors on
        multiple scales
        ▪   For more information review the writings of
            Kimberle Krenshaw
   Is their inequity in the US?
     Yes, and it is growing in many ways
   How does this manifest?
     In various ways for various populations
     Example:
      ▪ Disparity: gaps in outcomes for whole group population
   How do we explain this?
     Personal or cultural characteristics, institutional or
      structural causes
     Culture of poverty, cumulative disadvantage, The
      underclass
     Although racial attitudes are improving steadily, racial
        disparities persist on every level.
         Income, poverty, employment, health, crime, incarceration,
            education, assets, housing, among others

                   National Racial Disparities 2003                                  National Racial Disparities 2003
80.0%                                                                 $100,000
                                                   71.5%                                                     $88,000
70.0%                                                                  $90,000

                                                              47.3%    $80,000
60.0%
                                                                       $70,000
50.0%                                                   46.3%
                                                                       $60,000
40.0%                           34.8%                                            $46,310
                                                                       $50,000
30.0%
                24.7%                23.9%
                     21.9%                                             $40,000             $29,772 $34,751
20.0%                                    16.8%                         $30,000
        10.1%
10.0%                                                                  $20,000
                                                                                                                       $6,000 $7,900
0.0%                                                                   $10,000

                                                                          $-
          Poverty Rate        College Graduation   Homeownership
                                     Rate              Rate                        Median HH Income          Median HH Net Worth
                 White       African American      Hispanic                          White       African American      Hispanic

                                                                                                                               18
   How do we understand these disparities if they are not
    explained by personal discrimination or explicit laws and
    policies? When do disparities matter?

   Three sources:
     Biology: Much less prevalent today, but was a common explanation
      during the 19th and early 20th centuries; theories of racial, ethnic, and
      gender inferiority.
     Individuals & Culture: Idea that individuals alone can (and should) rise
      above their conditions of poverty, and the idea of a defective “culture
      of poverty”.
     Structures & Institutions: States that even within neutral arrangements
      and without discriminatory actors, disparities can still exist.
                    21
22
Physical

             Social                                            Cultural

                                      Outcomes
                                            &
                                      Behaviors

These structures interact in ways that produce racialized outcomes for different groups, but also
in ways that influence identity and culture
   Five decades of research
    indicate that your environment
    has a profound impact on your
    access to opportunity and
    likelihood of success
   High poverty areas with poor
    employment, underperforming
    schools, distressed housing and
    public health/safety risks
    depress life outcomes
     A system of disadvantage
     Many manifestations
        ▪ Urban, rural, suburban
   People of color are far more
    likely to live in opportunity
    deprived neighborhoods and
    communities
       Social determinants of race: Where
        you live dictates access to
        opportunity structures and also
        determines racial norms
                                             24
•   One variable can explain
                         why differential outcomes.


…to a multi-dimensional understanding….
          •   Structural Inequality
              –   Example: a Bird in a cage.
                  Examining one bar cannot
                  explain why a bird cannot fly.
                  But multiple bars, arranged in
                  specific ways, reinforce each
                  other and trap the bird.
Source: Barbara Reskin. http://faculty.uwashington.edu/reskin/
                                                                 26
Some people ride the “Up”   Others have to run up
   escalator to reach       the “Down” escalator to
      opportunity           get there
                                                      27
Educational
     Opportunity Map for
            Ohio:
     Ohio’s Geography of
         Educational
        Opportunity
Direct Education Indicators
School poverty rate
Average teaching experience
Percent reading proficiency - 11th grade
Percent writing proficiency - 11th grade
Percent math proficiency - 11th grade
Graduation rate 2004-2005
Percent of teachers with Bachelor's degree
Percent of teachers with Master's degree
Total hardware/software (computer expenditure)
Access to libraries
Percent associates degree or higher


Other Neighborhood Indicators
Percent poverty
Percent unemployed
Access to prenatal care
Total crime indicator
Percent of houses owner-occupied
Percent of houses vacant
Housing median value
Child poverty rate
Median household income
SOUTHWEST OHIO   SOUTHWEST CENTRAL OHIO
Impacts of Inequity
We are all caught up in an inescapable network of
mutuality, tied in a single garment of destiny.
Whatever effects one directly effects all indirectly.
                   The Rev. Dr. Martin Luther King, Jr.
   Individual
     Poor economic outcomes, lower educational outcomes,
      degraded asset development
     Poor health conditions, higher exposure and risk from crime
     Psychological distress, weak social and professional networks
   Community/Economy
     High social costs, distressed and stressed communities, fiscal
      challenges
     Weakened civic engagement and democratic participation
     Underdeveloped human capital, poor labor outlook, poor
      economic development prospects
                                                                       32
   Richard Florida states in Flight of the Creative Class:
       “Rising inequality is a deadweight drag on our economic competitiveness…The basic
        formula is simple: Those companies, regions and countries that reduce waste and
        effectively harness their productive assets have a huge advantage in the Darwinian
        competition that powers creative capitalism.”

   Rondinelli, Johnson and Kasarda argue that the marginalization found in
    core urban communities and declining geographic/social mobility
    threaten to undermine hopes of adjusting economic development to the
    global economy.
       “…the expanding underclass that is concentrated in the cores of U.S. cities is ill prepared
        educationally and psychologically for productive work and technological change…”
 The State’s economic future is dependent on its most
  plentiful natural resource, human capacity and innovation
 Without addressing the various inequities facing the state,
  our future is compromised


                                                                34
Building Greater Equity in Education
   Many solutions…but resources and public will to
    implement them are the primary barriers to resolving

   Our Approach
     Investing in People, Places and Linkages
      ▪ Bringing opportunity to distressed communities, bridging
        opportunities to those who are disconnected from our educational
        resources
      ▪ Providing holistic support to Ohio’s students and communities
      ▪ Engaging disadvantaged communities and families


     What would you do? What is your solution?
   Reece.35@osu.edu
     33 West 11th Ave, Room 204 A
     The Kirwan Institute for the Study of Race &
     Ethnicity
   On-line at:
     www.kirwaninstitute.org
     www.race-talk.org


                                                     37

Equal Opportunity and Access to Higher Education in Ohio

  • 1.
    Seminar for SocialImmersion Project Honors & Scholars Center Hale Center, Ohio State University – January 24th 2011 Instructor: Jason Reece Senior Researcher, Opportunity Communities Program Kirwan Institute for the Study of Race & Ethnicity, Moritz College of Law 33 West 11th Ave, Room 204; E-mail: Reece.35@osu.edu
  • 2.
    Access to higher education  Unequal access to higher education as a form of inequity  Understanding the impacts of inequity on our state and society  How do we understand disparate outcomes in education in Ohio?  What drives it?  What can we do to improve it?
  • 3.
    Multidisciplinary applied research institute  Our mission is to expand opportunity for all, especially for our most marginalized communities  Founded in 2003 by john powell (executive director)  Opportunity Communities Program ▪ Opening pathways to opportunity for marginalized communities through investments in people, places and supporting linkages ▪ Disrupting systems of disadvantage ▪ Opportunity mapping, Regional Equity, Neighborhood Revitalization, Opportunity Based Housing 3
  • 4.
    About me….  About you….  What’s your background?  What inspired you to participate in this program?  Are there particular questions or topics you would like me to address?
  • 5.
    A Form ofInequity in Ohio
  • 6.
    What do you think?  Why Should we about access to higher education in Ohio, or in our nation?  Is their “fair” access to higher education in Ohio?
  • 9.
    For Ohio 9th graders  Less than 3 in 4 will graduate High School  Less than 2 out of 3 of those Source: Data and information graduates will go to college derived from presentation by  Only 1 in 2 of those will Nancy Nestor Baker, available on-line at: graduate in 6 years http://principalsoffice.osu.edu/f iles/zone.8.08.knowledge.php  Resulting in only 1 in 5 earning a bachelors degree
  • 10.
    For new jobs in our economy  About 7 in 10 new jobs require post secondary education  Only 1 in 10 are accessible for those with less than a high school diploma  The recession has made these conditions worse (more competition)
  • 14.
    Systemic barriers to higher education and disparate educational outcomes are a sign of inequity in Ohio  What is inequity? ▪ Disparities between groups (systematic group level disparities) ▪ Not having fairness or treating all groups fairly, barriers blocking access to opportunity for some groups  Conversely, providing greater access to higher education is an example of promoting greater equity in the state
  • 15.
  • 16.
    Who is impacted?  Other potential dimensions to  Class inequity  Race/Ethnicity • Disparate impact of policies  Gender • Often institutional and/or  Language structural in nature  Place/Geography • Durable inequality  Disability • Cumulative disadvantage  Sexual Orientation • Denial of opportunity  Age • Groups left out of the democratic  Other???? process • Limited political voice  Intersectionality • Limited agency  Interaction of various factors on multiple scales ▪ For more information review the writings of Kimberle Krenshaw
  • 17.
    Is their inequity in the US?  Yes, and it is growing in many ways  How does this manifest?  In various ways for various populations  Example: ▪ Disparity: gaps in outcomes for whole group population  How do we explain this?  Personal or cultural characteristics, institutional or structural causes  Culture of poverty, cumulative disadvantage, The underclass
  • 18.
    Although racial attitudes are improving steadily, racial disparities persist on every level.  Income, poverty, employment, health, crime, incarceration, education, assets, housing, among others National Racial Disparities 2003 National Racial Disparities 2003 80.0% $100,000 71.5% $88,000 70.0% $90,000 47.3% $80,000 60.0% $70,000 50.0% 46.3% $60,000 40.0% 34.8% $46,310 $50,000 30.0% 24.7% 23.9% 21.9% $40,000 $29,772 $34,751 20.0% 16.8% $30,000 10.1% 10.0% $20,000 $6,000 $7,900 0.0% $10,000 $- Poverty Rate College Graduation Homeownership Rate Rate Median HH Income Median HH Net Worth White African American Hispanic White African American Hispanic 18
  • 21.
    How do we understand these disparities if they are not explained by personal discrimination or explicit laws and policies? When do disparities matter?  Three sources:  Biology: Much less prevalent today, but was a common explanation during the 19th and early 20th centuries; theories of racial, ethnic, and gender inferiority.  Individuals & Culture: Idea that individuals alone can (and should) rise above their conditions of poverty, and the idea of a defective “culture of poverty”.  Structures & Institutions: States that even within neutral arrangements and without discriminatory actors, disparities can still exist. 21
  • 22.
  • 23.
    Physical Social Cultural Outcomes & Behaviors These structures interact in ways that produce racialized outcomes for different groups, but also in ways that influence identity and culture
  • 24.
    Five decades of research indicate that your environment has a profound impact on your access to opportunity and likelihood of success  High poverty areas with poor employment, underperforming schools, distressed housing and public health/safety risks depress life outcomes  A system of disadvantage  Many manifestations ▪ Urban, rural, suburban  People of color are far more likely to live in opportunity deprived neighborhoods and communities  Social determinants of race: Where you live dictates access to opportunity structures and also determines racial norms 24
  • 25.
    One variable can explain why differential outcomes. …to a multi-dimensional understanding…. • Structural Inequality – Example: a Bird in a cage. Examining one bar cannot explain why a bird cannot fly. But multiple bars, arranged in specific ways, reinforce each other and trap the bird.
  • 26.
    Source: Barbara Reskin.http://faculty.uwashington.edu/reskin/ 26
  • 27.
    Some people ridethe “Up” Others have to run up escalator to reach the “Down” escalator to opportunity get there 27
  • 28.
    Educational Opportunity Map for Ohio: Ohio’s Geography of Educational Opportunity Direct Education Indicators School poverty rate Average teaching experience Percent reading proficiency - 11th grade Percent writing proficiency - 11th grade Percent math proficiency - 11th grade Graduation rate 2004-2005 Percent of teachers with Bachelor's degree Percent of teachers with Master's degree Total hardware/software (computer expenditure) Access to libraries Percent associates degree or higher Other Neighborhood Indicators Percent poverty Percent unemployed Access to prenatal care Total crime indicator Percent of houses owner-occupied Percent of houses vacant Housing median value Child poverty rate Median household income
  • 29.
    SOUTHWEST OHIO SOUTHWEST CENTRAL OHIO
  • 30.
  • 31.
    We are allcaught up in an inescapable network of mutuality, tied in a single garment of destiny. Whatever effects one directly effects all indirectly. The Rev. Dr. Martin Luther King, Jr.
  • 32.
    Individual  Poor economic outcomes, lower educational outcomes, degraded asset development  Poor health conditions, higher exposure and risk from crime  Psychological distress, weak social and professional networks  Community/Economy  High social costs, distressed and stressed communities, fiscal challenges  Weakened civic engagement and democratic participation  Underdeveloped human capital, poor labor outlook, poor economic development prospects 32
  • 33.
    Richard Florida states in Flight of the Creative Class:  “Rising inequality is a deadweight drag on our economic competitiveness…The basic formula is simple: Those companies, regions and countries that reduce waste and effectively harness their productive assets have a huge advantage in the Darwinian competition that powers creative capitalism.”  Rondinelli, Johnson and Kasarda argue that the marginalization found in core urban communities and declining geographic/social mobility threaten to undermine hopes of adjusting economic development to the global economy.  “…the expanding underclass that is concentrated in the cores of U.S. cities is ill prepared educationally and psychologically for productive work and technological change…”
  • 34.
     The State’seconomic future is dependent on its most plentiful natural resource, human capacity and innovation  Without addressing the various inequities facing the state, our future is compromised 34
  • 35.
  • 36.
    Many solutions…but resources and public will to implement them are the primary barriers to resolving  Our Approach  Investing in People, Places and Linkages ▪ Bringing opportunity to distressed communities, bridging opportunities to those who are disconnected from our educational resources ▪ Providing holistic support to Ohio’s students and communities ▪ Engaging disadvantaged communities and families  What would you do? What is your solution?
  • 37.
    Reece.35@osu.edu  33 West 11th Ave, Room 204 A  The Kirwan Institute for the Study of Race & Ethnicity  On-line at:  www.kirwaninstitute.org  www.race-talk.org 37