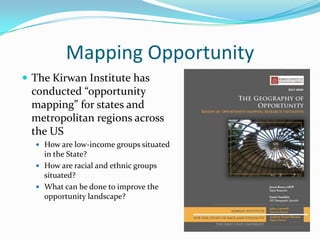
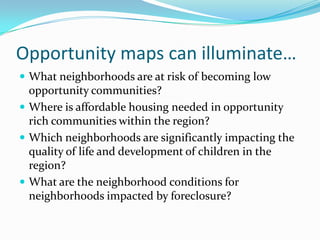
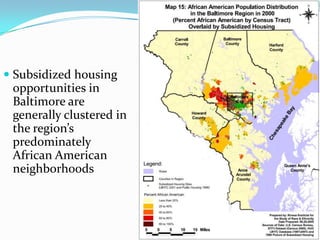
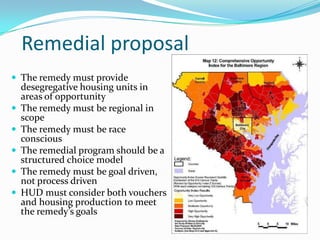
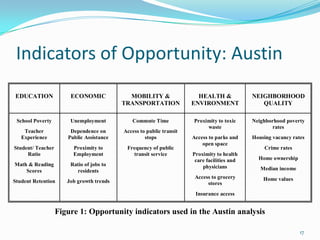
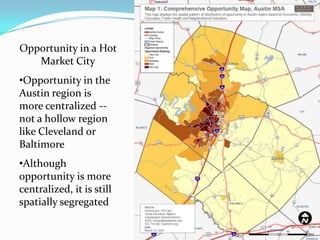
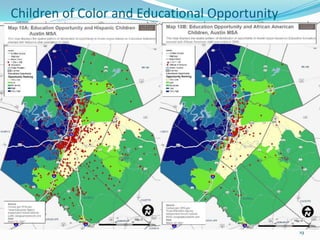
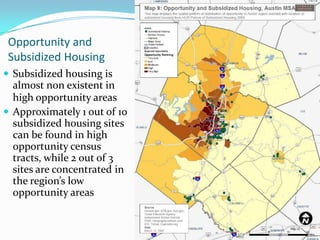
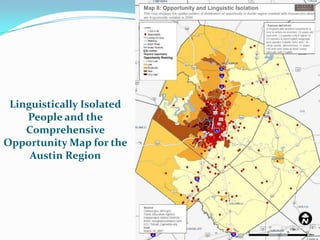
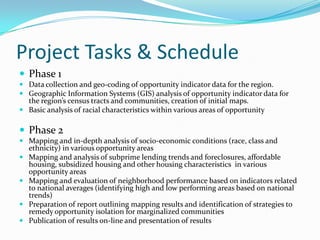
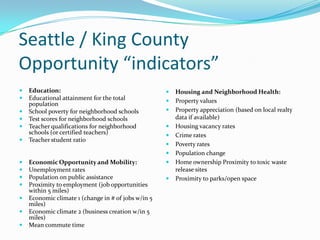
Research and Advocacy at the
                                  Intersection of Race and Poverty
                                     PRRAC Small Grants Program
                                                              john a. powell
Executive Director, The Kirwan Institute for the Study of Race and Ethnicity
Communities of Opportunity
  Everyone should have
  access to the critical
  opportunity structures
  needed to succeed in
  life

  Affirmatively
  connecting people to
  opportunity creates
  positive, transformative
  change in communities
Opportunity
                Based Fair
                 Housing


              Planning for
Opportunity                  Neighborhood
 Mapping      Opportunity    Revitalization
              Communities


                Equitable
                Regional
                 Policy
Mapping Opportunity
 The Kirwan Institute has
  conducted “opportunity
  mapping” for states and
  metropolitan regions across
 the US
   How are low-income groups situated
    in the State?
   How are racial and ethnic groups
    situated?
   What can be done to improve the
    opportunity landscape?
Opportunity maps can illuminate…
 What neighborhoods are at risk of becoming low
  opportunity communities?
 Where is affordable housing needed in opportunity
  rich communities within the region?
 Which neighborhoods are significantly impacting the
  quality of life and development of children in the
  region?
 What are the neighborhood conditions for
  neighborhoods impacted by foreclosure?
The Credit and Foreclosure Crisis


                                    6
Institutionalized Disinvestment:
Redlining Map of Philadelphia


                                   7
From Redlining to
Reverse Redlining
Connecticut
Columbus
Thompson v. HUD


                  12
 Subsidized housing
  opportunities in
  Baltimore are
  generally clustered in
  the region’s
  predominately
  African American
  neighborhoods
Remedial proposal
 The remedy must provide
    desegregative housing units in
    areas of opportunity
   The remedy must be regional in
    scope
   The remedy must be race
    conscious
   The remedial program should be a
    structured choice model
   The remedy must be goal driven,
    not process driven
   HUD must consider both vouchers
    and housing production to meet
    the remedy’s goals
Race and Class
intersections:
low income whites are not
as spatially segregated
16
Indicators of Opportunity: Austin
EDUCATION              ECONOMIC             MOBILITY &                 HEALTH &             NEIGHBORHOOD
                                          TRANSPORTATION             ENVIRONMENT               QUALITY

 School Poverty        Unemployment          Commute Time            Proximity to toxic     Neighborhood poverty
                                                                          waste                    rates
    Teacher            Dependence on      Access to public transit
   Experience         Public Assistance            stops             Access to parks and    Housing vacancy rates
                                                                         open space
Student/ Teacher        Proximity to       Frequency of public                                  Crime rates
     Ratio              Employment           transit service         Proximity to health
                                                                      care facilities and     Home ownership
Math & Reading         Ratio of jobs to                                  physicians
    Scores               residents                                                             Median income
                                                                      Access to grocery         Home values
Student Retention     Job growth trends                                    stores
                                                                      Insurance access


                   Figure 1: Opportunity indicators used in the Austin analysis

                                                                                                               17
Opportunity in a Hot
   Market City
•Opportunity in the
Austin region is
more centralized --
not a hollow region
like Cleveland or
Baltimore
•Although
opportunity is more
centralized, it is still
spatially segregated

                           18
Children of Color and Educational Opportunity


                                                19
Opportunity and
 Subsidized Housing
 Subsidized housing is
  almost non existent in
  high opportunity areas
 Approximately 1 out of 10
  subsidized housing sites
  can be found in high
  opportunity census
  tracts, while 2 out of 3
  sites are concentrated in
  the region’s low
  opportunity areas


                              20
Linguistically Isolated
    People and the
    Comprehensive
Opportunity Map for the
     Austin Region


                           21
King County, WA Opportunity Mapping –
Mapping to Promote Equitable Community
           Development and Fair Housing
Project Tasks & Schedule
 Phase 1
 Data collection and geo-coding of opportunity indicator data for the region.
 Geographic Information Systems (GIS) analysis of opportunity indicator data for
  the region’s census tracts and communities, creation of initial maps.
 Basic analysis of racial characteristics within various areas of opportunity

 Phase 2
 Mapping and in-depth analysis of socio-economic conditions (race, class and
    ethnicity) in various opportunity areas
   Mapping and analysis of subprime lending trends and foreclosures, affordable
    housing, subsidized housing and other housing characteristics in various
    opportunity areas
   Mapping and evaluation of neighborhood performance based on indicators related
    to national averages (identifying high and low performing areas based on national
    trends)
   Preparation of report outlining mapping results and identification of strategies to
    remedy opportunity isolation for marginalized communities
   Publication of results on-line and presentation of results
Seattle / King County
Opportunity “indicators”
   Education:                                          Housing and Neighborhood Health:
   Educational attainment for the total                Property values
    population
   School poverty for neighborhood schools             Property appreciation (based on local realty
   Test scores for neighborhood schools                 data if available)
   Teacher qualifications for neighborhood             Housing vacancy rates
    schools (or certified teachers)                     Crime rates
   Teacher student ratio
                                                        Poverty rates
                                                        Population change
   Economic Opportunity and Mobility:                  Home ownership Proximity to toxic waste
   Unemployment rates                                   release sites
   Population on public assistance                     Proximity to parks/open space
   Proximity to employment (job opportunities
    within 5 miles)
   Economic climate 1 (change in # of jobs w/in 5
    miles)
   Economic climate 2 (business creation w/in 5
    miles)
   Mean commute time
Feedback & collaboration?


  www.KirwanInstitute.org

The Geography of Opportunity in Seattle

  • 1.
    Research and Advocacyat the Intersection of Race and Poverty PRRAC Small Grants Program john a. powell Executive Director, The Kirwan Institute for the Study of Race and Ethnicity
  • 2.
    Communities of Opportunity  Everyone should have access to the critical opportunity structures needed to succeed in life  Affirmatively connecting people to opportunity creates positive, transformative change in communities
  • 3.
    Opportunity Based Fair Housing Planning for Opportunity Neighborhood Mapping Opportunity Revitalization Communities Equitable Regional Policy
  • 4.
    Mapping Opportunity  TheKirwan Institute has conducted “opportunity mapping” for states and metropolitan regions across the US  How are low-income groups situated in the State?  How are racial and ethnic groups situated?  What can be done to improve the opportunity landscape?
  • 5.
    Opportunity maps canilluminate…  What neighborhoods are at risk of becoming low opportunity communities?  Where is affordable housing needed in opportunity rich communities within the region?  Which neighborhoods are significantly impacting the quality of life and development of children in the region?  What are the neighborhood conditions for neighborhoods impacted by foreclosure?
  • 6.
    The Credit andForeclosure Crisis 6
  • 7.
  • 8.
  • 9.
  • 10.
  • 12.
  • 13.
     Subsidized housing opportunities in Baltimore are generally clustered in the region’s predominately African American neighborhoods
  • 14.
    Remedial proposal  Theremedy must provide desegregative housing units in areas of opportunity  The remedy must be regional in scope  The remedy must be race conscious  The remedial program should be a structured choice model  The remedy must be goal driven, not process driven  HUD must consider both vouchers and housing production to meet the remedy’s goals
  • 15.
    Race and Class intersections: lowincome whites are not as spatially segregated
  • 16.
  • 17.
    Indicators of Opportunity:Austin EDUCATION ECONOMIC MOBILITY & HEALTH & NEIGHBORHOOD TRANSPORTATION ENVIRONMENT QUALITY School Poverty Unemployment Commute Time Proximity to toxic Neighborhood poverty waste rates Teacher Dependence on Access to public transit Experience Public Assistance stops Access to parks and Housing vacancy rates open space Student/ Teacher Proximity to Frequency of public Crime rates Ratio Employment transit service Proximity to health care facilities and Home ownership Math & Reading Ratio of jobs to physicians Scores residents Median income Access to grocery Home values Student Retention Job growth trends stores Insurance access Figure 1: Opportunity indicators used in the Austin analysis 17
  • 18.
    Opportunity in aHot Market City •Opportunity in the Austin region is more centralized -- not a hollow region like Cleveland or Baltimore •Although opportunity is more centralized, it is still spatially segregated 18
  • 19.
    Children of Colorand Educational Opportunity 19
  • 20.
    Opportunity and SubsidizedHousing  Subsidized housing is almost non existent in high opportunity areas  Approximately 1 out of 10 subsidized housing sites can be found in high opportunity census tracts, while 2 out of 3 sites are concentrated in the region’s low opportunity areas 20
  • 21.
    Linguistically Isolated People and the Comprehensive Opportunity Map for the Austin Region 21
  • 22.
    King County, WAOpportunity Mapping – Mapping to Promote Equitable Community Development and Fair Housing
  • 23.
    Project Tasks &Schedule  Phase 1  Data collection and geo-coding of opportunity indicator data for the region.  Geographic Information Systems (GIS) analysis of opportunity indicator data for the region’s census tracts and communities, creation of initial maps.  Basic analysis of racial characteristics within various areas of opportunity  Phase 2  Mapping and in-depth analysis of socio-economic conditions (race, class and ethnicity) in various opportunity areas  Mapping and analysis of subprime lending trends and foreclosures, affordable housing, subsidized housing and other housing characteristics in various opportunity areas  Mapping and evaluation of neighborhood performance based on indicators related to national averages (identifying high and low performing areas based on national trends)  Preparation of report outlining mapping results and identification of strategies to remedy opportunity isolation for marginalized communities  Publication of results on-line and presentation of results
  • 24.
    Seattle / KingCounty Opportunity “indicators”  Education:  Housing and Neighborhood Health:  Educational attainment for the total  Property values population  School poverty for neighborhood schools  Property appreciation (based on local realty  Test scores for neighborhood schools data if available)  Teacher qualifications for neighborhood  Housing vacancy rates schools (or certified teachers)  Crime rates  Teacher student ratio  Poverty rates  Population change  Economic Opportunity and Mobility:  Home ownership Proximity to toxic waste  Unemployment rates release sites  Population on public assistance  Proximity to parks/open space  Proximity to employment (job opportunities within 5 miles)  Economic climate 1 (change in # of jobs w/in 5 miles)  Economic climate 2 (business creation w/in 5 miles)  Mean commute time
  • 25.
    Feedback & collaboration? www.KirwanInstitute.org