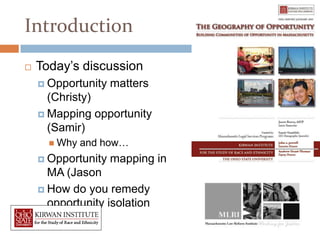
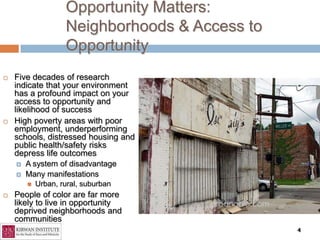
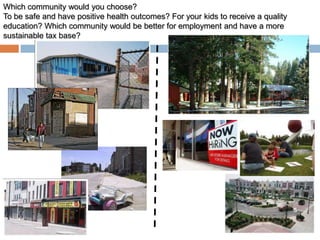
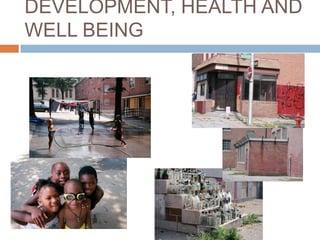
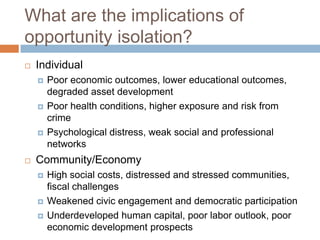
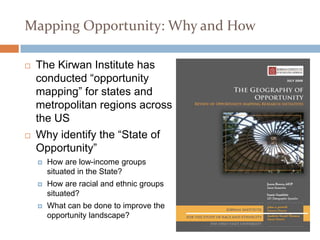
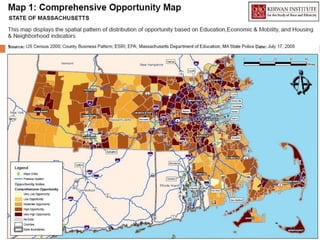
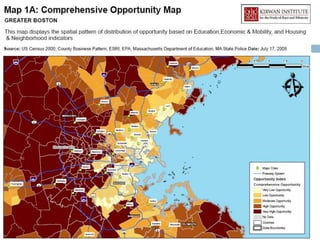
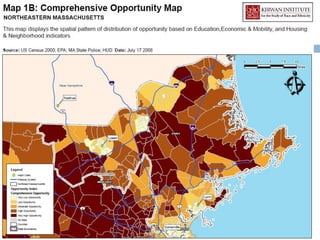
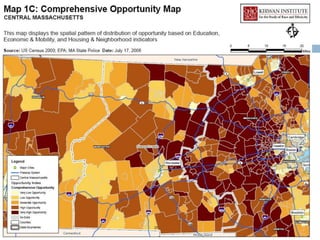
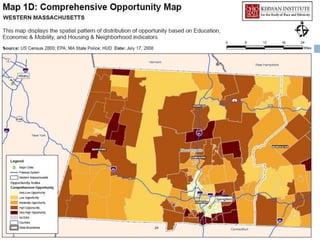
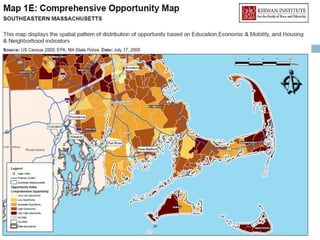
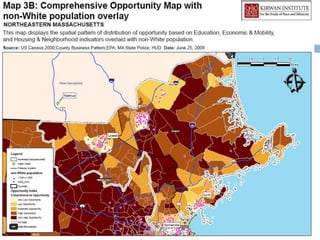
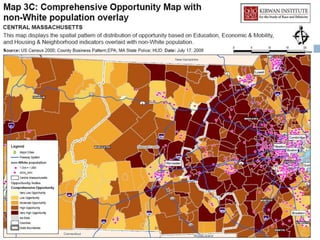
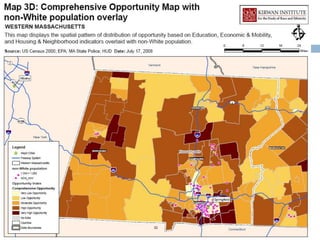
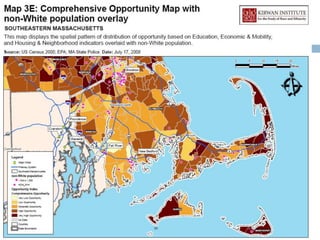
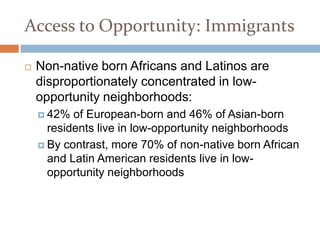
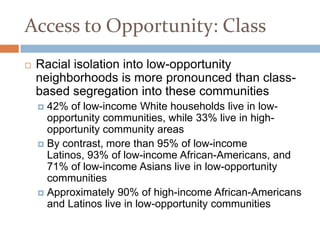
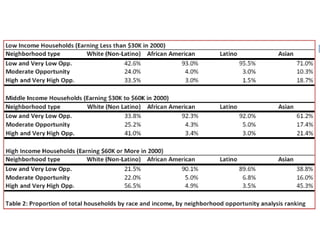
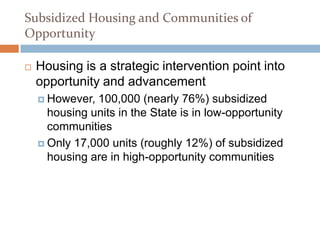
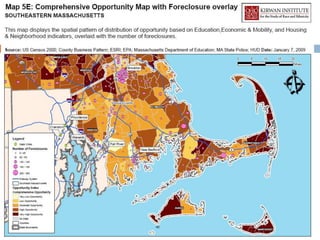
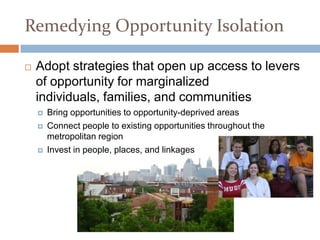
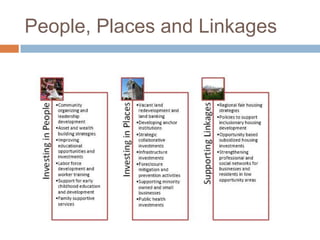
PEOPLE, PLACE, &
OPPORTUNITY
                              Mapping Communities of
                              Opportunity in
                              Massachusetts
                              May 29, 2009
                              Massachusetts State House

                              Jason Reece AICP, Christy Rogers &
                              Samir Gambhir
                              The Kirwan Institute for the Study of Race &
                              Ethnicity
                              The Ohio State University
                              Reece.35@osu.edu


       Funded by Massachusetts Legal Services Programs
Section 1

Introduction
   Today’s discussion
     Opportunity   matters
      (Christy)
     Mapping opportunity
      (Samir)
       Why   and how…
     Opportunity   mapping in
      MA (Jason
     How do you remedy
      opportunity isolation
      (Jason)
Section 2
Opportunity Matters: Space, Place, and Life
Outcomes

   “Opportunity” is a situation or condition that places individuals in a
    position to be more likely to succeed or excel.
   Opportunity structures are critical to opening pathways to success:
      High-quality education

      Healthy and safe environment

      Stable housing

      Sustainable employment

      Political empowerment

      Outlets for wealth-building

      Positive social networks
Opportunity Matters:
                    Neighborhoods & Access to
                    Opportunity
   Five decades of research
    indicate that your environment
    has a profound impact on your
    access to opportunity and
    likelihood of success
   High poverty areas with poor
    employment, underperforming
    schools, distressed housing and
    public health/safety risks
    depress life outcomes
       A system of disadvantage
       Many manifestations
           Urban, rural, suburban
   People of color are far more
    likely to live in opportunity
    deprived neighborhoods and
    communities
                                                4
Which community would you choose?
To be safe and have positive health outcomes? For your kids to receive a quality
education? Which community would be better for employment and have a more
sustainable tax base?


                                                                                   5
DEVELOPMENT, HEALTH AND
WELL BEING


                      6
What are the implications of
opportunity isolation?
   Individual
       Poor economic outcomes, lower educational outcomes,
        degraded asset development
       Poor health conditions, higher exposure and risk from
        crime
       Psychological distress, weak social and professional
        networks
   Community/Economy
       High social costs, distressed and stressed communities,
        fiscal challenges
       Weakened civic engagement and democratic participation
       Underdeveloped human capital, poor labor outlook, poor
        economic development prospects
Mapping Opportunity: Why and How

   The Kirwan Institute has
    conducted “opportunity
    mapping” for states and
    metropolitan regions across
    the US
   Why identify the “State of
    Opportunity”
       How are low-income groups
        situated in the State?
       How are racial and ethnic groups
        situated?
       What can be done to improve the
        opportunity landscape?
Section 3
Mapping Opportunity: Why and How

Inequality has a geographic footprint

Maps can visually track the history and presence
 of discriminatory and exclusionary policies that
 spatially segregate people

Identifying places with gaps in opportunity can
  help direct future investment and identify
  structures which impede access to opportunity
Mapping Communities of Opportunity: Methods
    and Indicators


   Three areas of
    opportunity were
    analyzed using GIS
    mapping capability:
       Education Quality and
        Opportunity
       Economic Health and
        Transportation
       Neighborhood Stability and
        Health
Opportunity Mapping
   Education Quality and Opportunity
       Student Expenditures
       Student Poverty Rate
       Test Scores for Schools
       Graduation and Dropout Rates
       Teacher Qualifications
Opportunity Mapping
   Economic Health and Transportation
       Unemployment Rates
       Population on Public Assistance
       Proximity to Employment
       Employment Change: 2000-2005
       Mean Commute Time
Opportunity Mapping
   Neighborhood Stability and Health
       Home Values
       Neighborhood Vacancy Rates
       Crime
       Neighborhood Poverty
       Home Ownership Rate
       Proximity to Toxic Waste Sites
       Superfund Sites
Comprehensive Opportunity Map
Comprehensive Opportunity Map: Greater Boston
Comprehensive Opportunity Map: Northeastern Massachusetts
Access to Opportunity:
Race, Ethnicity, and Class

   Racialized isolation from neighborhoods of
    opportunity is stunning in Massachusetts

   Immigrants from Africa and Latin America were
    found to be disproportionately concentrated in
    low-opportunity neighborhoods

   Racial isolation into low-opportunity
    neighborhoods is more pronounced than
    class-based segregation into these
    communities
Access to Opportunity: Race
   Racialized isolation from neighborhoods of
    opportunity in Massachusetts:
     More than 90% of African-American and Latino
      households in were isolated in the lowest
      opportunity neighborhoods in the State
     Over 55% of Asian households were found in low-
      opportunity neighborhoods
     By contrast, only 31% of White, Non-Latino
      households were found in low-opportunity
      neighborhoods
Access to Opportunity: Race
Access to Opportunity: Immigrants

   Non-native born Africans and Latinos are
    disproportionately concentrated in low-
    opportunity neighborhoods:
     42%  of European-born and 46% of Asian-born
      residents live in low-opportunity neighborhoods
     By contrast, more 70% of non-native born African
      and Latin American residents live in low-
      opportunity neighborhoods
Access to Opportunity: Class
   Racial isolation into low-opportunity
    neighborhoods is more pronounced than class-
    based segregation into these communities
     42% of low-income White households live in low-
      opportunity communities, while 33% live in high-
      opportunity community areas
     By contrast, more than 95% of low-income
      Latinos, 93% of low-income African-Americans, and
      71% of low-income Asians live in low-opportunity
      communities
     Approximately 90% of high-income African-Americans
      and Latinos live in low-opportunity communities
Subsidized Housing and Communities of
Opportunity

   Housing is a strategic intervention point into
    opportunity and advancement
     However, 100,000 (nearly 76%) subsidized
      housing units in the State is in low-opportunity
      communities
     Only 17,000 units (roughly 12%) of subsidized
      housing are in high-opportunity communities
Subsidized Housing and Communities of
Opportunity


       Comprehensive Opportunity Map: Southeastern Massachusetts
Residential Foreclosure and Opportunity

Over half of the State’s estimated amount of high-
 cost HMDA loans, residential foreclosures, and
 90-day residential foreclosures were located in
 low-opportunity neighborhoods

This data shows the strong relationship between
  poor lending practices, foreclosure, and
  vacancy, all of which have been
  disproportionately concentrated in low-
  opportunity neighborhoods
Residential Foreclosure and Opportunity


Distribution of Residential Factors Across the Community Opportunity Spectrum
Reflecting on these findings….
   What does our analysis find and suggest?
     Peopleof color are disproportionately
     concentrated in opportunity deprived communities
       Which   places them within a system of disadvantage
        that ultimately impacts life outcomes
       Creating both an individual and societal tragedy
     Subsidized   housing reinforces this opportunity
      isolation
     Foreclosures will widen the “opportunity divide” in
      the State of Massachusetts
   What are the implications of this challenge and
    how can we formulate a response?
What can opportunity maps be
used for…..
   Fair housing (Baltimore)
   Counseling and advocacy (Chicago)
   Regional collaboration on issues of education
    and housing (Austin)
   Assisting with grant making and targeting
    resources or programming
Section 4

Remedying Opportunity Isolation

   Adopt strategies that open up access to levers
    of opportunity for marginalized
    individuals, families, and communities
       Bring opportunities to opportunity-deprived areas
       Connect people to existing opportunities throughout the
        metropolitan region
       Invest in people, places, and linkages
People, Places and Linkages
Example: Neighborhood
45
      Revitalization
     A   systems response
        Where  are your key
         leverage points?
        What are the critical
         intervention points?
      Equity   focused
        Creating   a
          community for all (not
          a model of
          gentrification)
      Emphasis     on
      strategic
      collaboration
Example: Opportunity Based
         Housing -
46
         Integration into Opportunity
        Rethink fair housing…
        Not just integration but integration into
         opportunity
        Inclusive fair housing means access to good
         schools, jobs, doctors, child care,
         transportation, parks, and the civic fabric
Section 5
Intervention Strategies for Building Opportunity
Communities

   Strategies for community-activists, policy-
    makers, and researchers
     Adopt an opportunity-based approach to community
      development
     Adopt an opportunity-based approach to housing
      advocacy
     Support both in-place and mobility-based strategies to
      affirmatively provide access to opportunity
     Adopt a multi-disciplinary, collaborative approach to
      advocacy
Strategic Opportunities for
Change
   Design strategies that are sensitive to
    the unique challenges and strategic
    opportunities of each community
     e.g.strategies for an undercapitalized city
     might focus on vacant property while
     strategies in a hot market city might focus
     on regional affordable housing
To access this report and other resources please
visit us on-line at: www.kirwaninstitute.org


                                                   49

Mapping Communities of Opportunity in Massachusetts

  • 1.
    PEOPLE, PLACE, & OPPORTUNITY Mapping Communities of Opportunity in Massachusetts May 29, 2009 Massachusetts State House Jason Reece AICP, Christy Rogers & Samir Gambhir The Kirwan Institute for the Study of Race & Ethnicity The Ohio State University Reece.35@osu.edu Funded by Massachusetts Legal Services Programs
  • 2.
    Section 1 Introduction  Today’s discussion  Opportunity matters (Christy)  Mapping opportunity (Samir)  Why and how…  Opportunity mapping in MA (Jason  How do you remedy opportunity isolation (Jason)
  • 3.
    Section 2 Opportunity Matters:Space, Place, and Life Outcomes  “Opportunity” is a situation or condition that places individuals in a position to be more likely to succeed or excel.  Opportunity structures are critical to opening pathways to success:  High-quality education  Healthy and safe environment  Stable housing  Sustainable employment  Political empowerment  Outlets for wealth-building  Positive social networks
  • 4.
    Opportunity Matters: Neighborhoods & Access to Opportunity  Five decades of research indicate that your environment has a profound impact on your access to opportunity and likelihood of success  High poverty areas with poor employment, underperforming schools, distressed housing and public health/safety risks depress life outcomes  A system of disadvantage  Many manifestations  Urban, rural, suburban  People of color are far more likely to live in opportunity deprived neighborhoods and communities 4
  • 5.
    Which community wouldyou choose? To be safe and have positive health outcomes? For your kids to receive a quality education? Which community would be better for employment and have a more sustainable tax base? 5
  • 6.
  • 7.
    What are theimplications of opportunity isolation?  Individual  Poor economic outcomes, lower educational outcomes, degraded asset development  Poor health conditions, higher exposure and risk from crime  Psychological distress, weak social and professional networks  Community/Economy  High social costs, distressed and stressed communities, fiscal challenges  Weakened civic engagement and democratic participation  Underdeveloped human capital, poor labor outlook, poor economic development prospects
  • 8.
    Mapping Opportunity: Whyand How  The Kirwan Institute has conducted “opportunity mapping” for states and metropolitan regions across the US  Why identify the “State of Opportunity”  How are low-income groups situated in the State?  How are racial and ethnic groups situated?  What can be done to improve the opportunity landscape?
  • 9.
    Section 3 Mapping Opportunity:Why and How Inequality has a geographic footprint Maps can visually track the history and presence of discriminatory and exclusionary policies that spatially segregate people Identifying places with gaps in opportunity can help direct future investment and identify structures which impede access to opportunity
  • 10.
    Mapping Communities ofOpportunity: Methods and Indicators  Three areas of opportunity were analyzed using GIS mapping capability:  Education Quality and Opportunity  Economic Health and Transportation  Neighborhood Stability and Health
  • 11.
    Opportunity Mapping  Education Quality and Opportunity  Student Expenditures  Student Poverty Rate  Test Scores for Schools  Graduation and Dropout Rates  Teacher Qualifications
  • 12.
    Opportunity Mapping  Economic Health and Transportation  Unemployment Rates  Population on Public Assistance  Proximity to Employment  Employment Change: 2000-2005  Mean Commute Time
  • 13.
    Opportunity Mapping  Neighborhood Stability and Health  Home Values  Neighborhood Vacancy Rates  Crime  Neighborhood Poverty  Home Ownership Rate  Proximity to Toxic Waste Sites  Superfund Sites
  • 14.
  • 15.
  • 16.
    Comprehensive Opportunity Map:Northeastern Massachusetts
  • 20.
    Access to Opportunity: Race,Ethnicity, and Class  Racialized isolation from neighborhoods of opportunity is stunning in Massachusetts  Immigrants from Africa and Latin America were found to be disproportionately concentrated in low-opportunity neighborhoods  Racial isolation into low-opportunity neighborhoods is more pronounced than class-based segregation into these communities
  • 21.
    Access to Opportunity:Race  Racialized isolation from neighborhoods of opportunity in Massachusetts:  More than 90% of African-American and Latino households in were isolated in the lowest opportunity neighborhoods in the State  Over 55% of Asian households were found in low- opportunity neighborhoods  By contrast, only 31% of White, Non-Latino households were found in low-opportunity neighborhoods
  • 22.
  • 28.
    Access to Opportunity:Immigrants  Non-native born Africans and Latinos are disproportionately concentrated in low- opportunity neighborhoods:  42% of European-born and 46% of Asian-born residents live in low-opportunity neighborhoods  By contrast, more 70% of non-native born African and Latin American residents live in low- opportunity neighborhoods
  • 29.
    Access to Opportunity:Class  Racial isolation into low-opportunity neighborhoods is more pronounced than class- based segregation into these communities  42% of low-income White households live in low- opportunity communities, while 33% live in high- opportunity community areas  By contrast, more than 95% of low-income Latinos, 93% of low-income African-Americans, and 71% of low-income Asians live in low-opportunity communities  Approximately 90% of high-income African-Americans and Latinos live in low-opportunity communities
  • 31.
    Subsidized Housing andCommunities of Opportunity  Housing is a strategic intervention point into opportunity and advancement  However, 100,000 (nearly 76%) subsidized housing units in the State is in low-opportunity communities  Only 17,000 units (roughly 12%) of subsidized housing are in high-opportunity communities
  • 32.
    Subsidized Housing andCommunities of Opportunity Comprehensive Opportunity Map: Southeastern Massachusetts
  • 34.
    Residential Foreclosure andOpportunity Over half of the State’s estimated amount of high- cost HMDA loans, residential foreclosures, and 90-day residential foreclosures were located in low-opportunity neighborhoods This data shows the strong relationship between poor lending practices, foreclosure, and vacancy, all of which have been disproportionately concentrated in low- opportunity neighborhoods
  • 35.
    Residential Foreclosure andOpportunity Distribution of Residential Factors Across the Community Opportunity Spectrum
  • 41.
    Reflecting on thesefindings….  What does our analysis find and suggest?  Peopleof color are disproportionately concentrated in opportunity deprived communities  Which places them within a system of disadvantage that ultimately impacts life outcomes  Creating both an individual and societal tragedy  Subsidized housing reinforces this opportunity isolation  Foreclosures will widen the “opportunity divide” in the State of Massachusetts  What are the implications of this challenge and how can we formulate a response?
  • 42.
    What can opportunitymaps be used for…..  Fair housing (Baltimore)  Counseling and advocacy (Chicago)  Regional collaboration on issues of education and housing (Austin)  Assisting with grant making and targeting resources or programming
  • 43.
    Section 4 Remedying OpportunityIsolation  Adopt strategies that open up access to levers of opportunity for marginalized individuals, families, and communities  Bring opportunities to opportunity-deprived areas  Connect people to existing opportunities throughout the metropolitan region  Invest in people, places, and linkages
  • 44.
  • 45.
    Example: Neighborhood 45 Revitalization A systems response  Where are your key leverage points?  What are the critical intervention points?  Equity focused  Creating a community for all (not a model of gentrification)  Emphasis on strategic collaboration
  • 46.
    Example: Opportunity Based Housing - 46 Integration into Opportunity  Rethink fair housing…  Not just integration but integration into opportunity  Inclusive fair housing means access to good schools, jobs, doctors, child care, transportation, parks, and the civic fabric
  • 47.
    Section 5 Intervention Strategiesfor Building Opportunity Communities  Strategies for community-activists, policy- makers, and researchers  Adopt an opportunity-based approach to community development  Adopt an opportunity-based approach to housing advocacy  Support both in-place and mobility-based strategies to affirmatively provide access to opportunity  Adopt a multi-disciplinary, collaborative approach to advocacy
  • 48.
    Strategic Opportunities for Change  Design strategies that are sensitive to the unique challenges and strategic opportunities of each community  e.g.strategies for an undercapitalized city might focus on vacant property while strategies in a hot market city might focus on regional affordable housing
  • 49.
    To access thisreport and other resources please visit us on-line at: www.kirwaninstitute.org 49