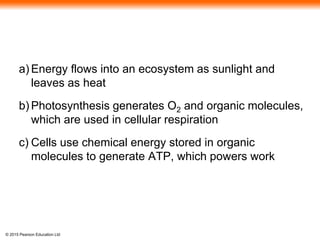
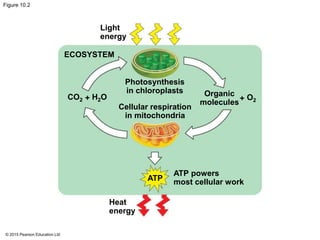
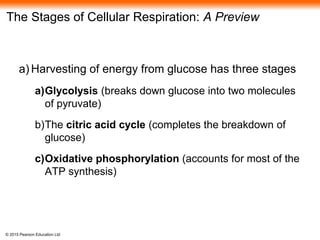
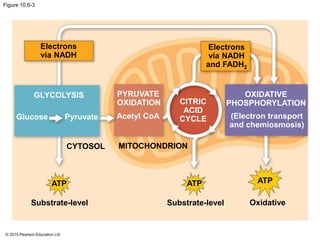
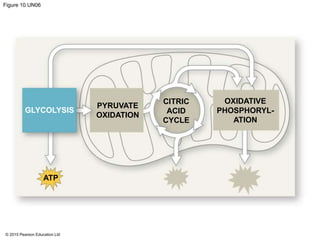
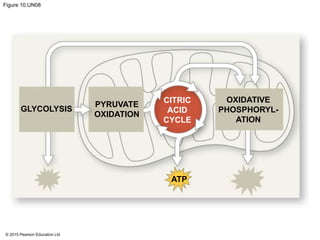
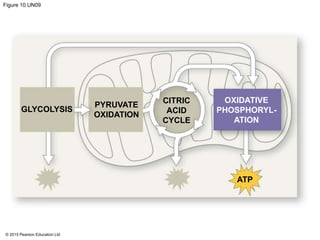
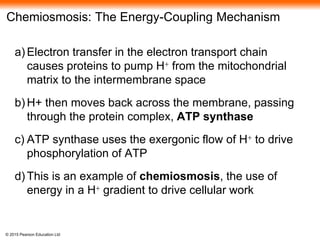
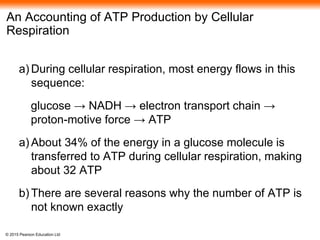
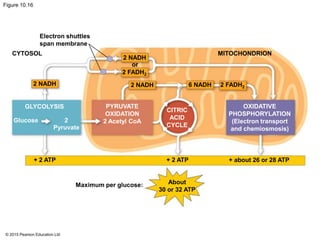
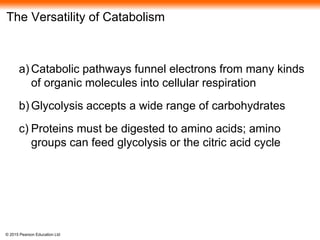
The document provides an overview of cellular respiration and its three main stages: glycolysis, the citric acid cycle, and oxidative phosphorylation. It discusses how:
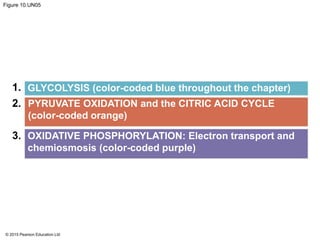
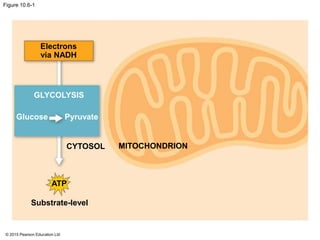
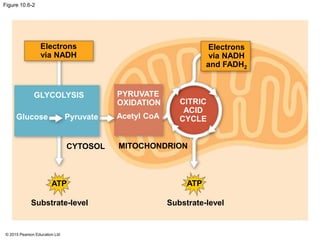
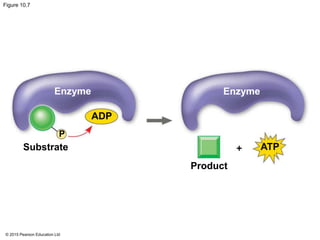
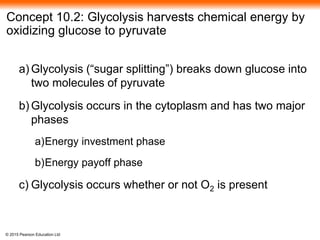
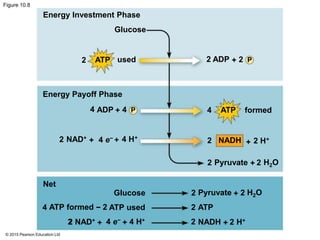
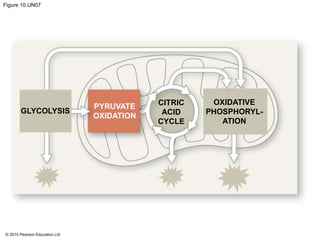
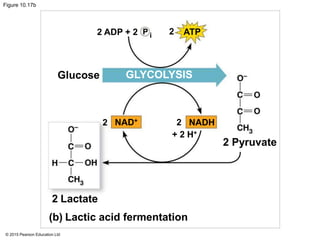
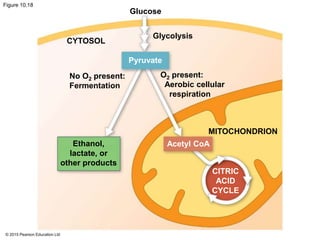
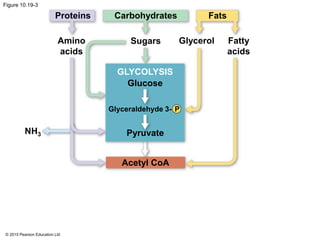
1. Glycolysis breaks down glucose to pyruvate and generates a small amount of ATP through substrate-level phosphorylation.
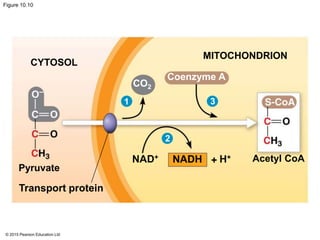
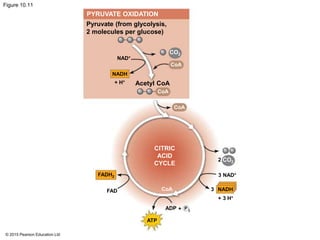
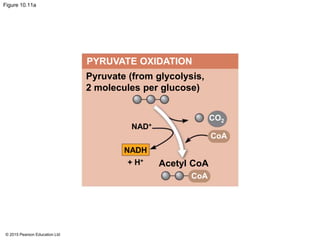
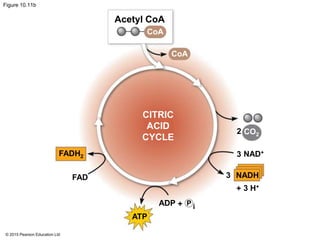
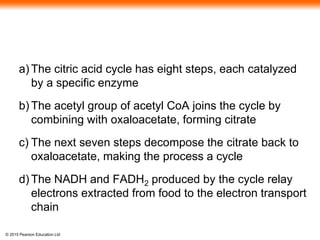
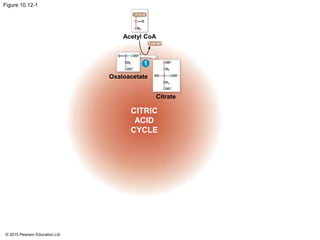
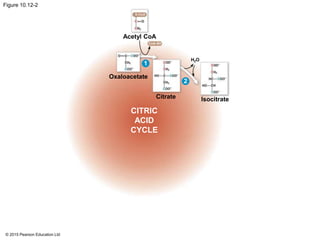
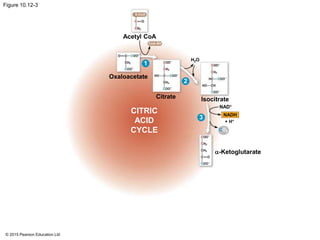
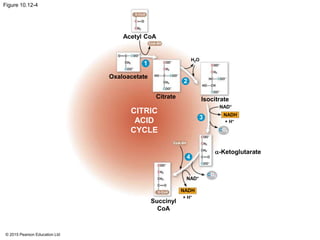
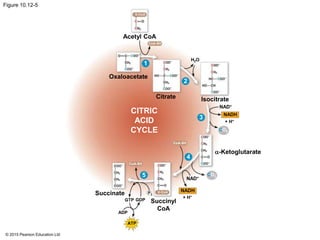
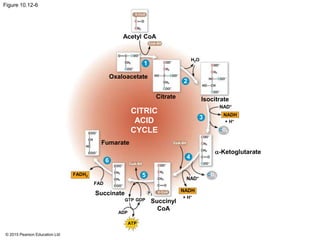
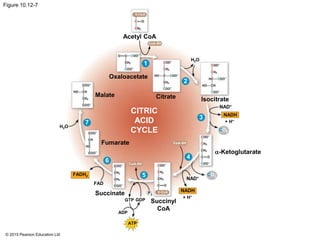
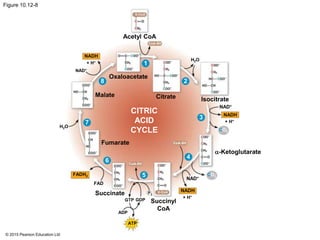
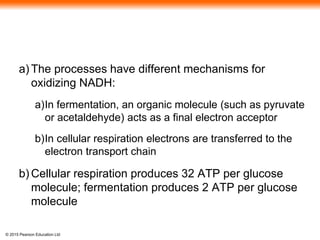
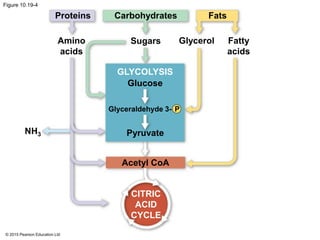
2. Pyruvate then enters the citric acid cycle in the mitochondrion where it is further oxidized, producing NADH, FADH2, and a small amount of ATP.
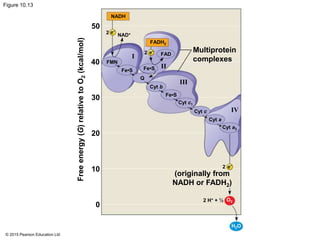
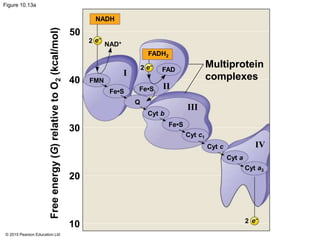
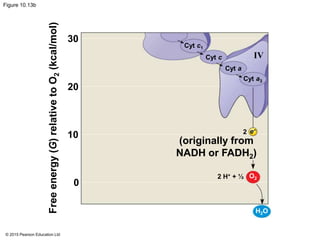
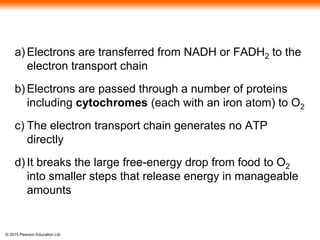
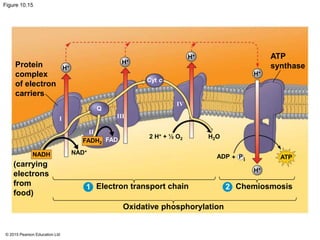
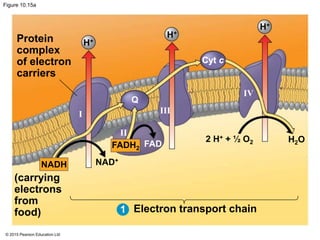
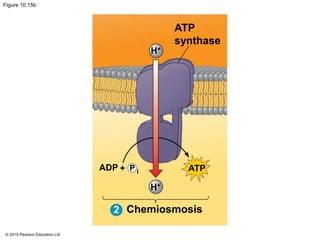
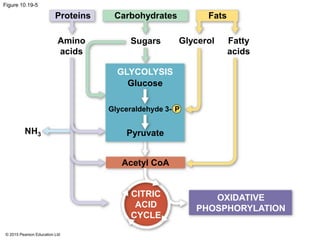
3. The electrons from NADH and FADH2 are passed to the electron transport chain during oxidative phosphorylation, where they generate a large amount of ATP through chemiosmosis.

![© 2015 Pearson Education Ltd
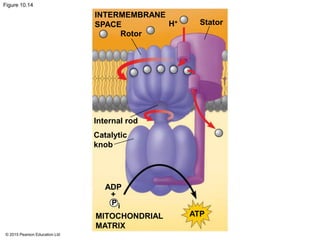
Figure 10.4
NAD+
2 e− + 2 H+
2[H]
(from food)
Nicotinamide
(oxidized form)
Reduction of NAD+
2 e− + H+
NADH
Nicotinamide
(reduced form)
Oxidation of NADH
H+
H+
Dehydrogenase](https://image.slidesharecdn.com/10gelecturepresentation-161130103725/85/10-ge-lecture-presentation-13-320.jpg)


![Tiếng Anh chuyên ngành Sinh học [05 lecture presentation]](https://cdn.slidesharecdn.com/ss_thumbnails/05lecturemacromolecules-150103182836-conversion-gate02-thumbnail.jpg?width=640&height=640&fit=bounds)