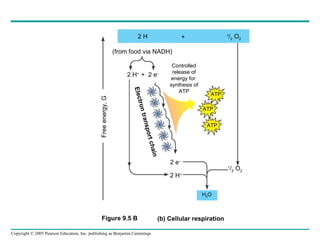
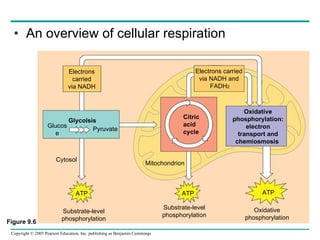
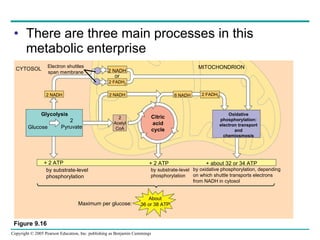
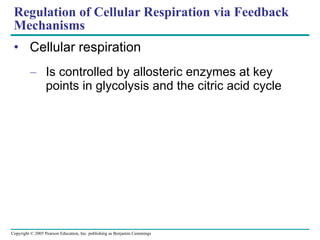
Cellular respiration involves three main stages - glycolysis, the citric acid cycle, and oxidative phosphorylation - to harvest chemical energy from glucose and produce ATP. Glycolysis breaks down glucose into pyruvate and generates some ATP. The citric acid cycle further oxidizes pyruvate and generates more ATP and electron carriers. During oxidative phosphorylation, electrons are passed through an electron transport chain which establishes a proton gradient used by ATP synthase to produce most of the cell's ATP.
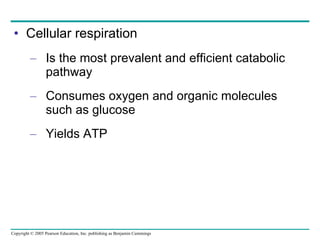
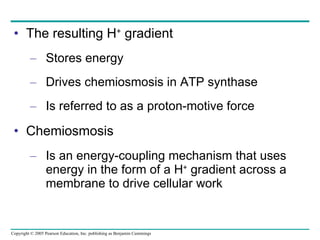
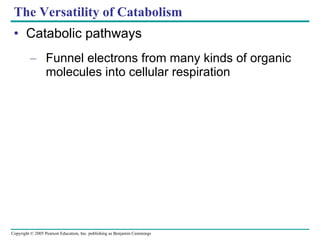
![Electrons from organic compounds Are usually first transferred to NAD + , a coenzyme NAD + H O O O O – O O O – O O O P P CH 2 CH 2 HO OH H H HO OH HO H H N + C NH 2 H N H NH 2 N N Nicotinamide (oxidized form) NH 2 + 2[H] (from food) Dehydrogenase Reduction of NAD + Oxidation of NADH 2 e – + 2 H + 2 e – + H + NADH O H H N C + Nicotinamide (reduced form) N Figure 9.4](https://image.slidesharecdn.com/ch9-091101165924-phpapp02/85/forjeffpark-10-320.jpg)


![Chapt04 Holes Lecture Animation[1]](https://cdn.slidesharecdn.com/ss_thumbnails/chapt04holeslectureanimation1-091122121855-phpapp02-thumbnail.jpg?width=640&height=640&fit=bounds)


![Getting Started with Apache Spark: Big Data Made Simple [Free Meetup]](https://cdn.slidesharecdn.com/ss_thumbnails/apachesparkgettingstarted-260203175547-8361bcc3-thumbnail.jpg?width=640&height=640&fit=bounds)


