Downloaded 824 times

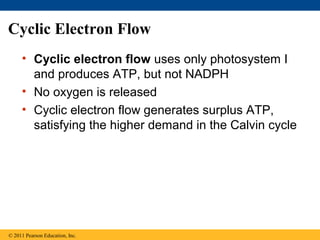
![Figure 10.6-4
H2O CO2
Light
NADP+
ADP
+Pi
Calvin
Light Cycle
Reactions
ATP
NADPH
Chloroplast
O2 [CH2O]
(sugar)](https://image.slidesharecdn.com/10photosynthesis-130311053414-phpapp01/85/10-photosynthesis-19-320.jpg)
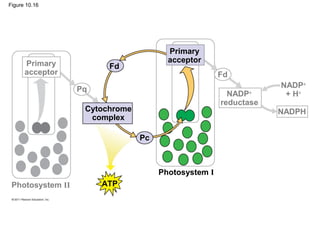

![Figure 10.17
Mitochondrion Chloroplast
MITOCHONDRION CHLOROPLAST
STRUCTURE STRUCTURE
H+ Diffusion
Intermembrane Thylakoid
space space
Electron
Inner Thylakoid
transport
membrane membrane
chain
ATP
synthase
Matrix Stroma
ADP + P i
ATP
Key Higher [H ]
+
H +
Lower [H+ ]](https://image.slidesharecdn.com/10photosynthesis-130311053414-phpapp01/85/10-photosynthesis-56-320.jpg)
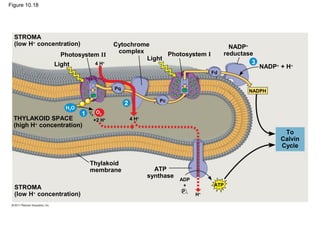
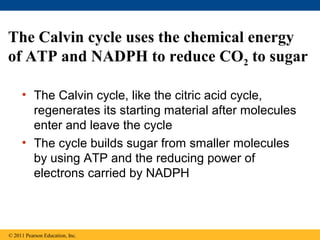
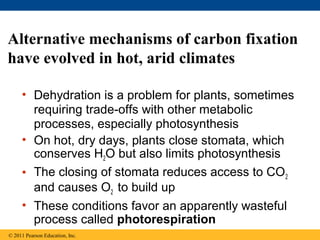
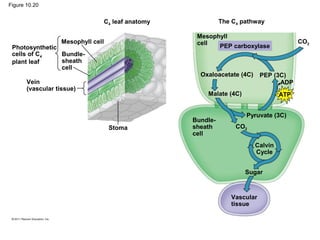

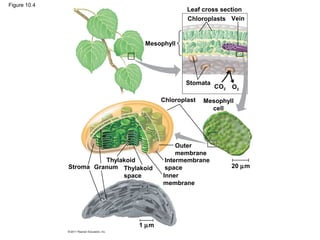
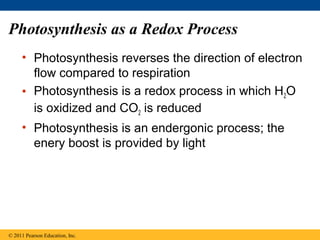
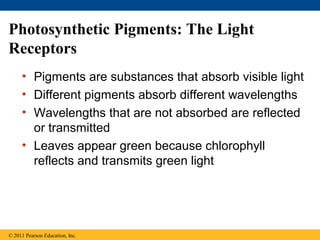
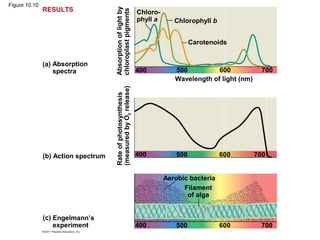
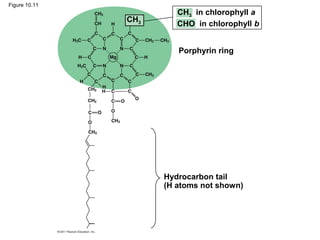
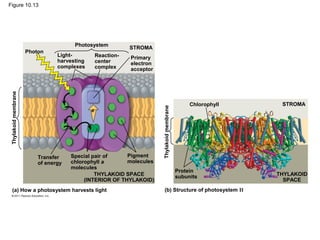
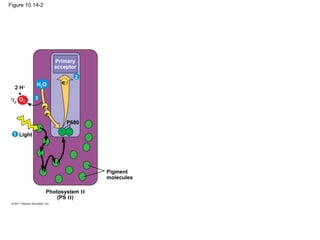
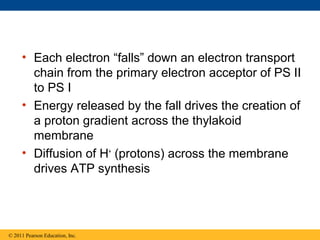
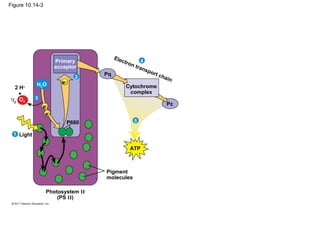
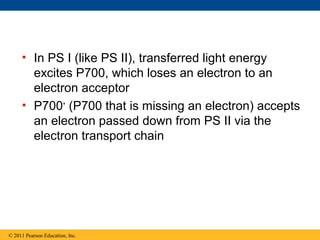
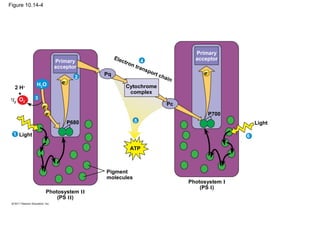
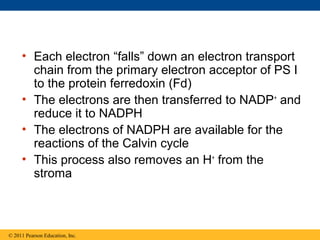
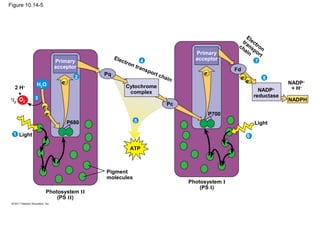
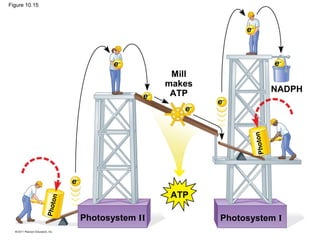
This document provides an overview of photosynthesis and summarizes key concepts from Chapter 10 of Campbell Biology. It discusses that photosynthesis converts solar energy to chemical energy through two stages - the light reactions and Calvin cycle. The light reactions use energy from sunlight to produce ATP and NADPH, and involve the photosystems PS I and PS II located in chloroplast thylakoids. The Calvin cycle then uses ATP and NADPH to fix carbon from CO2 into sugars.