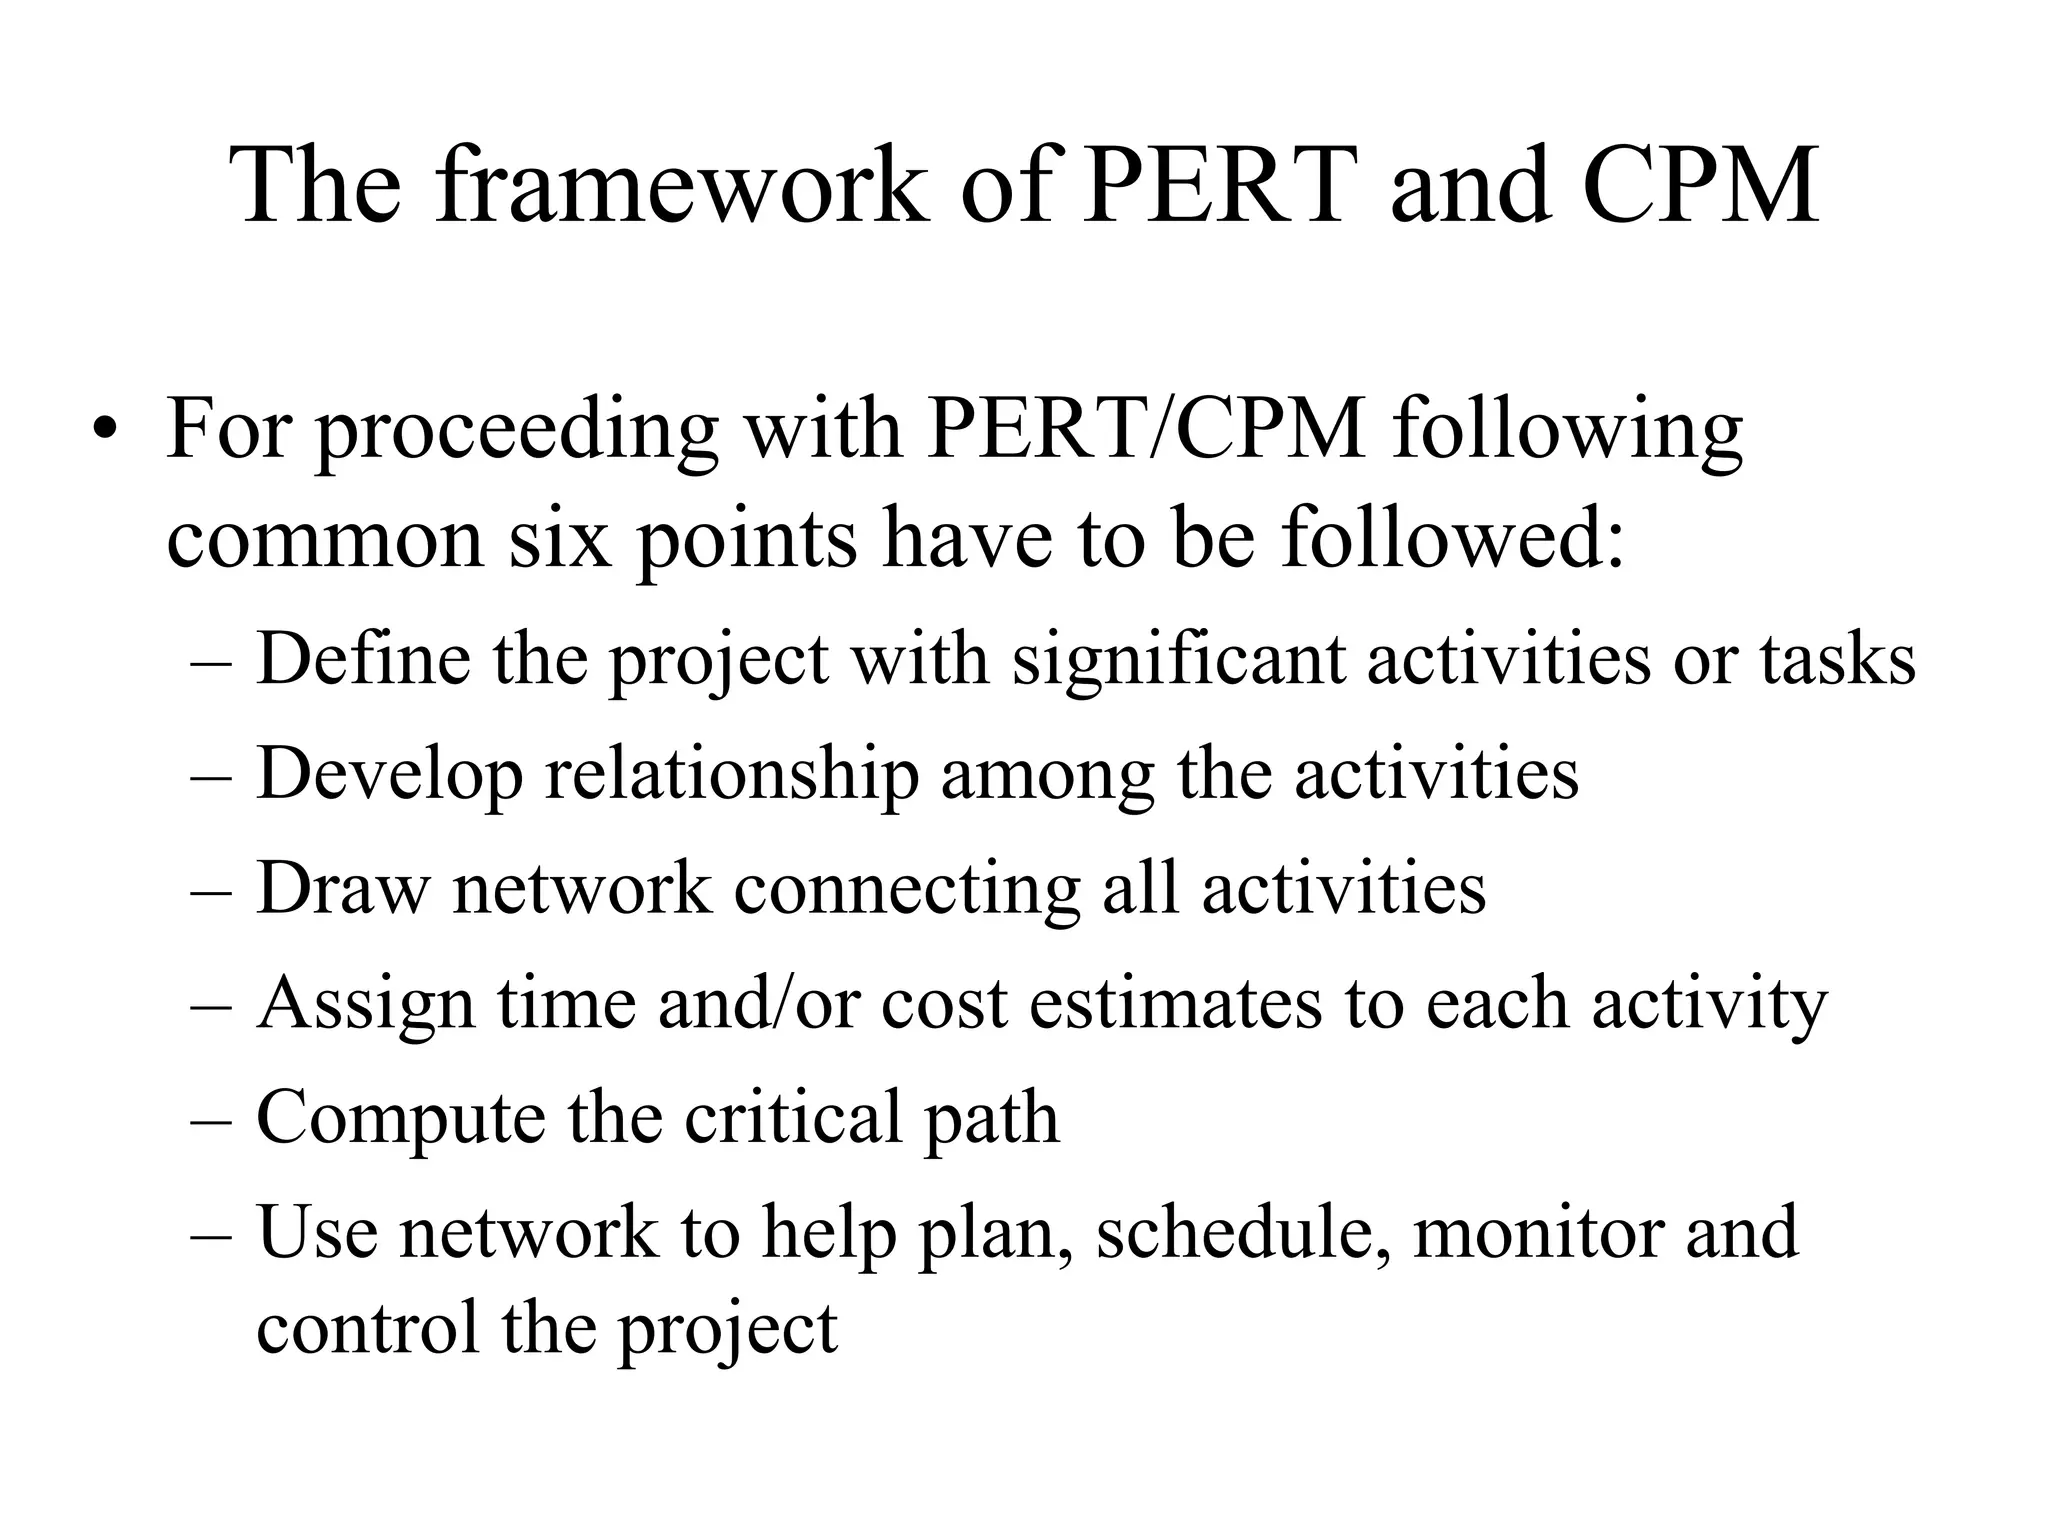
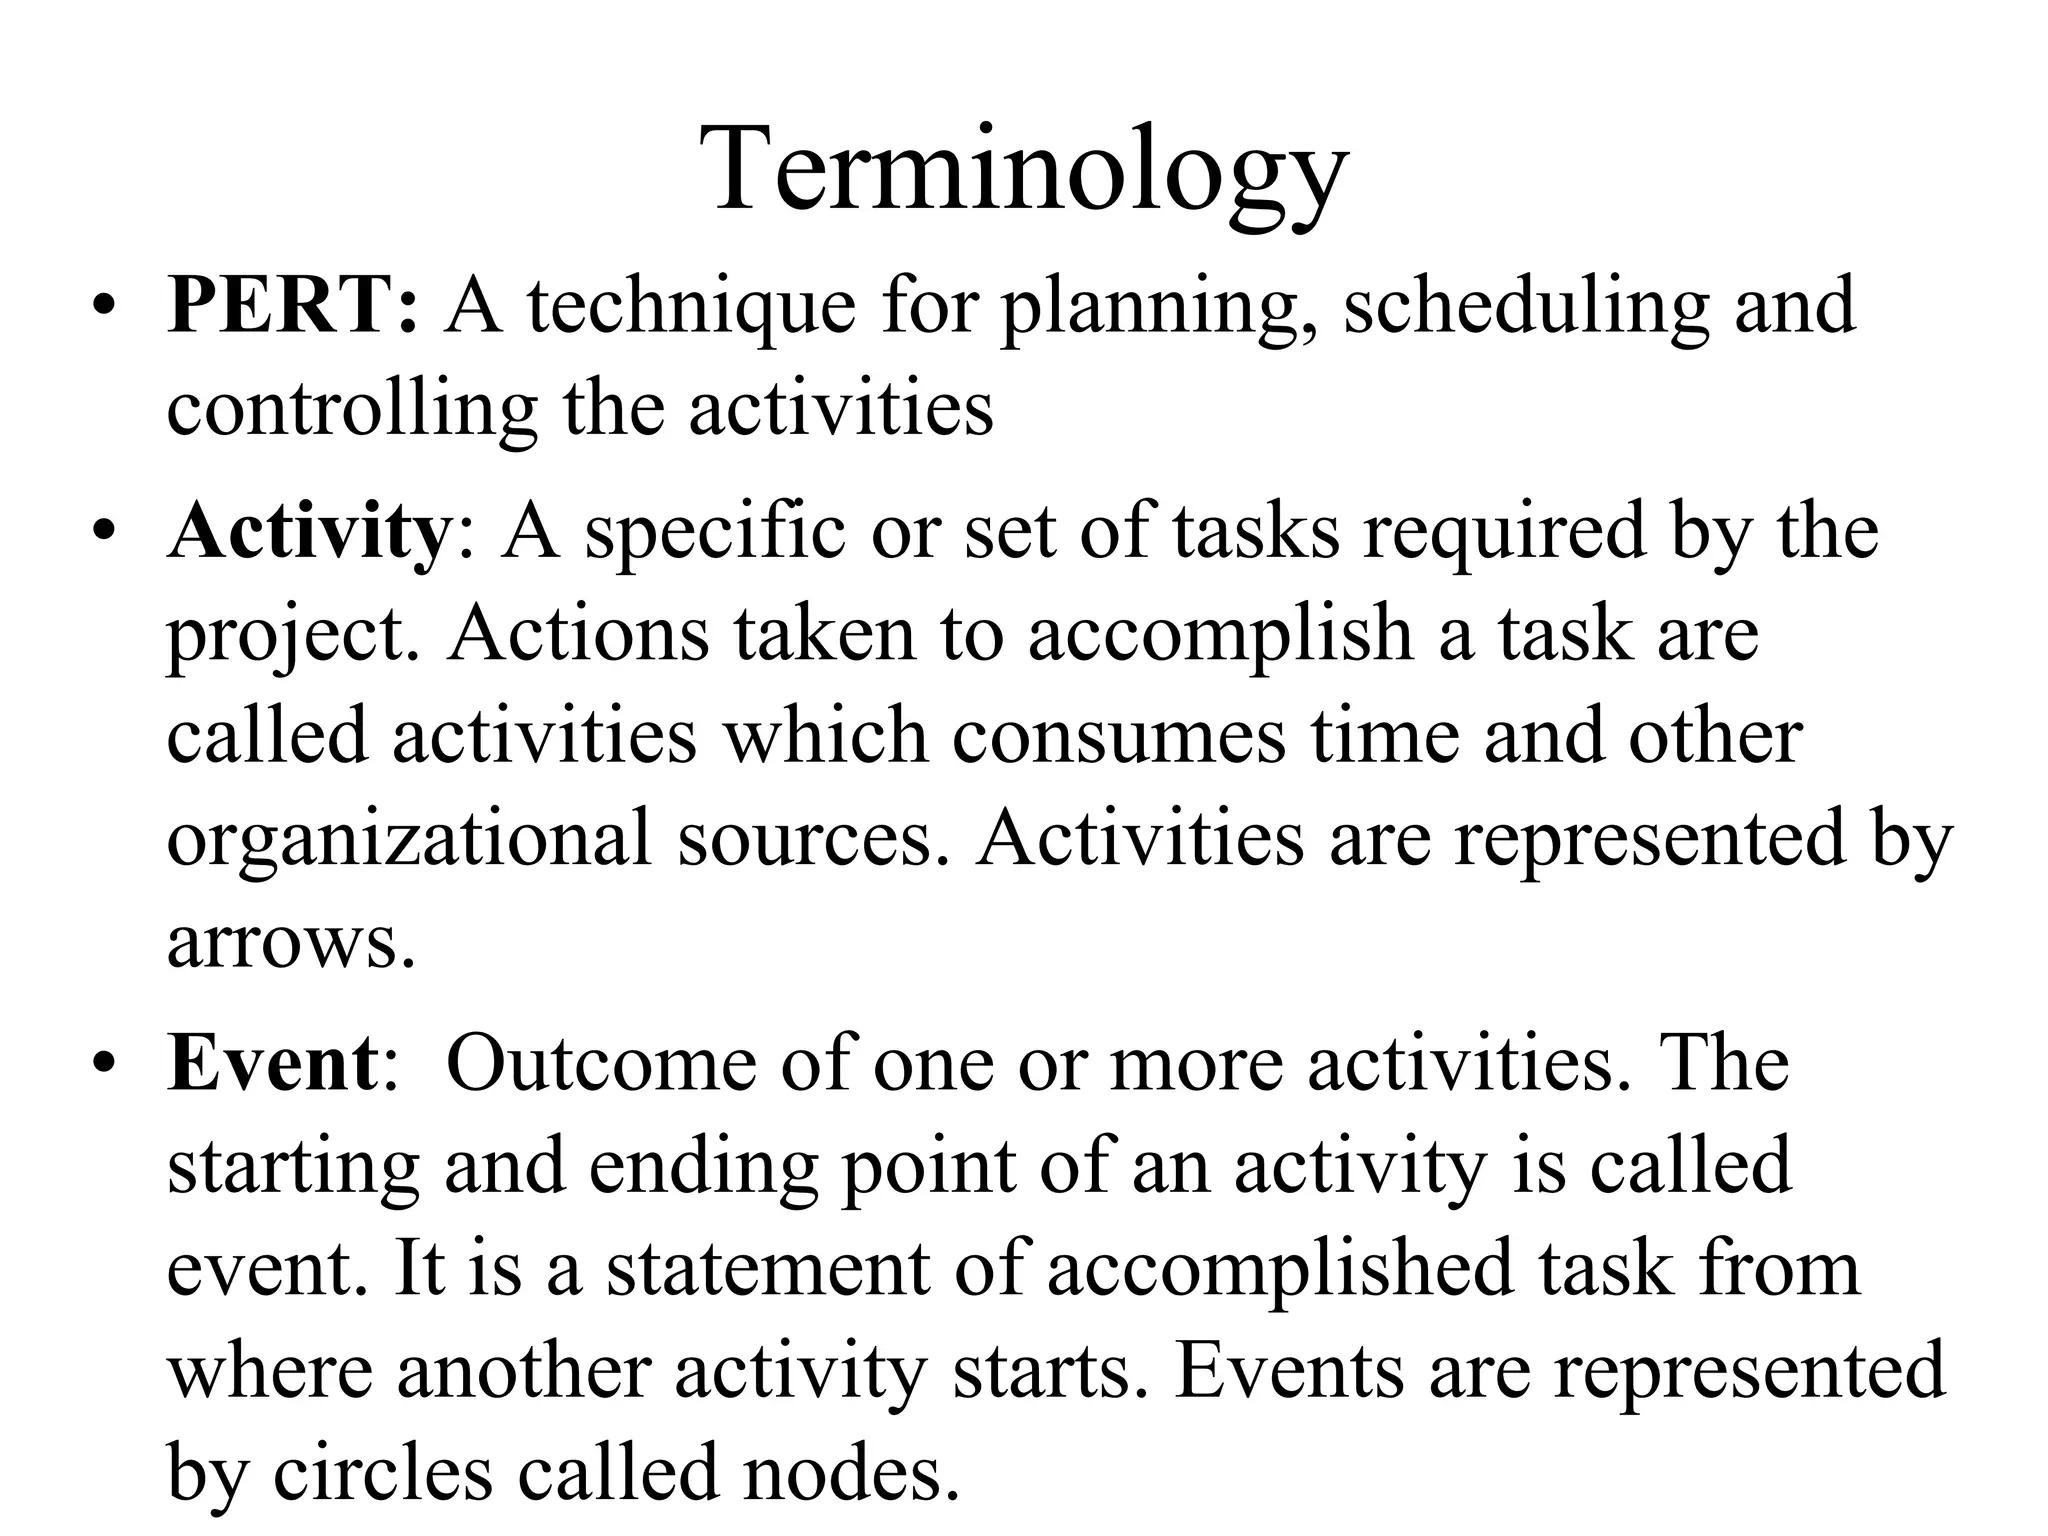
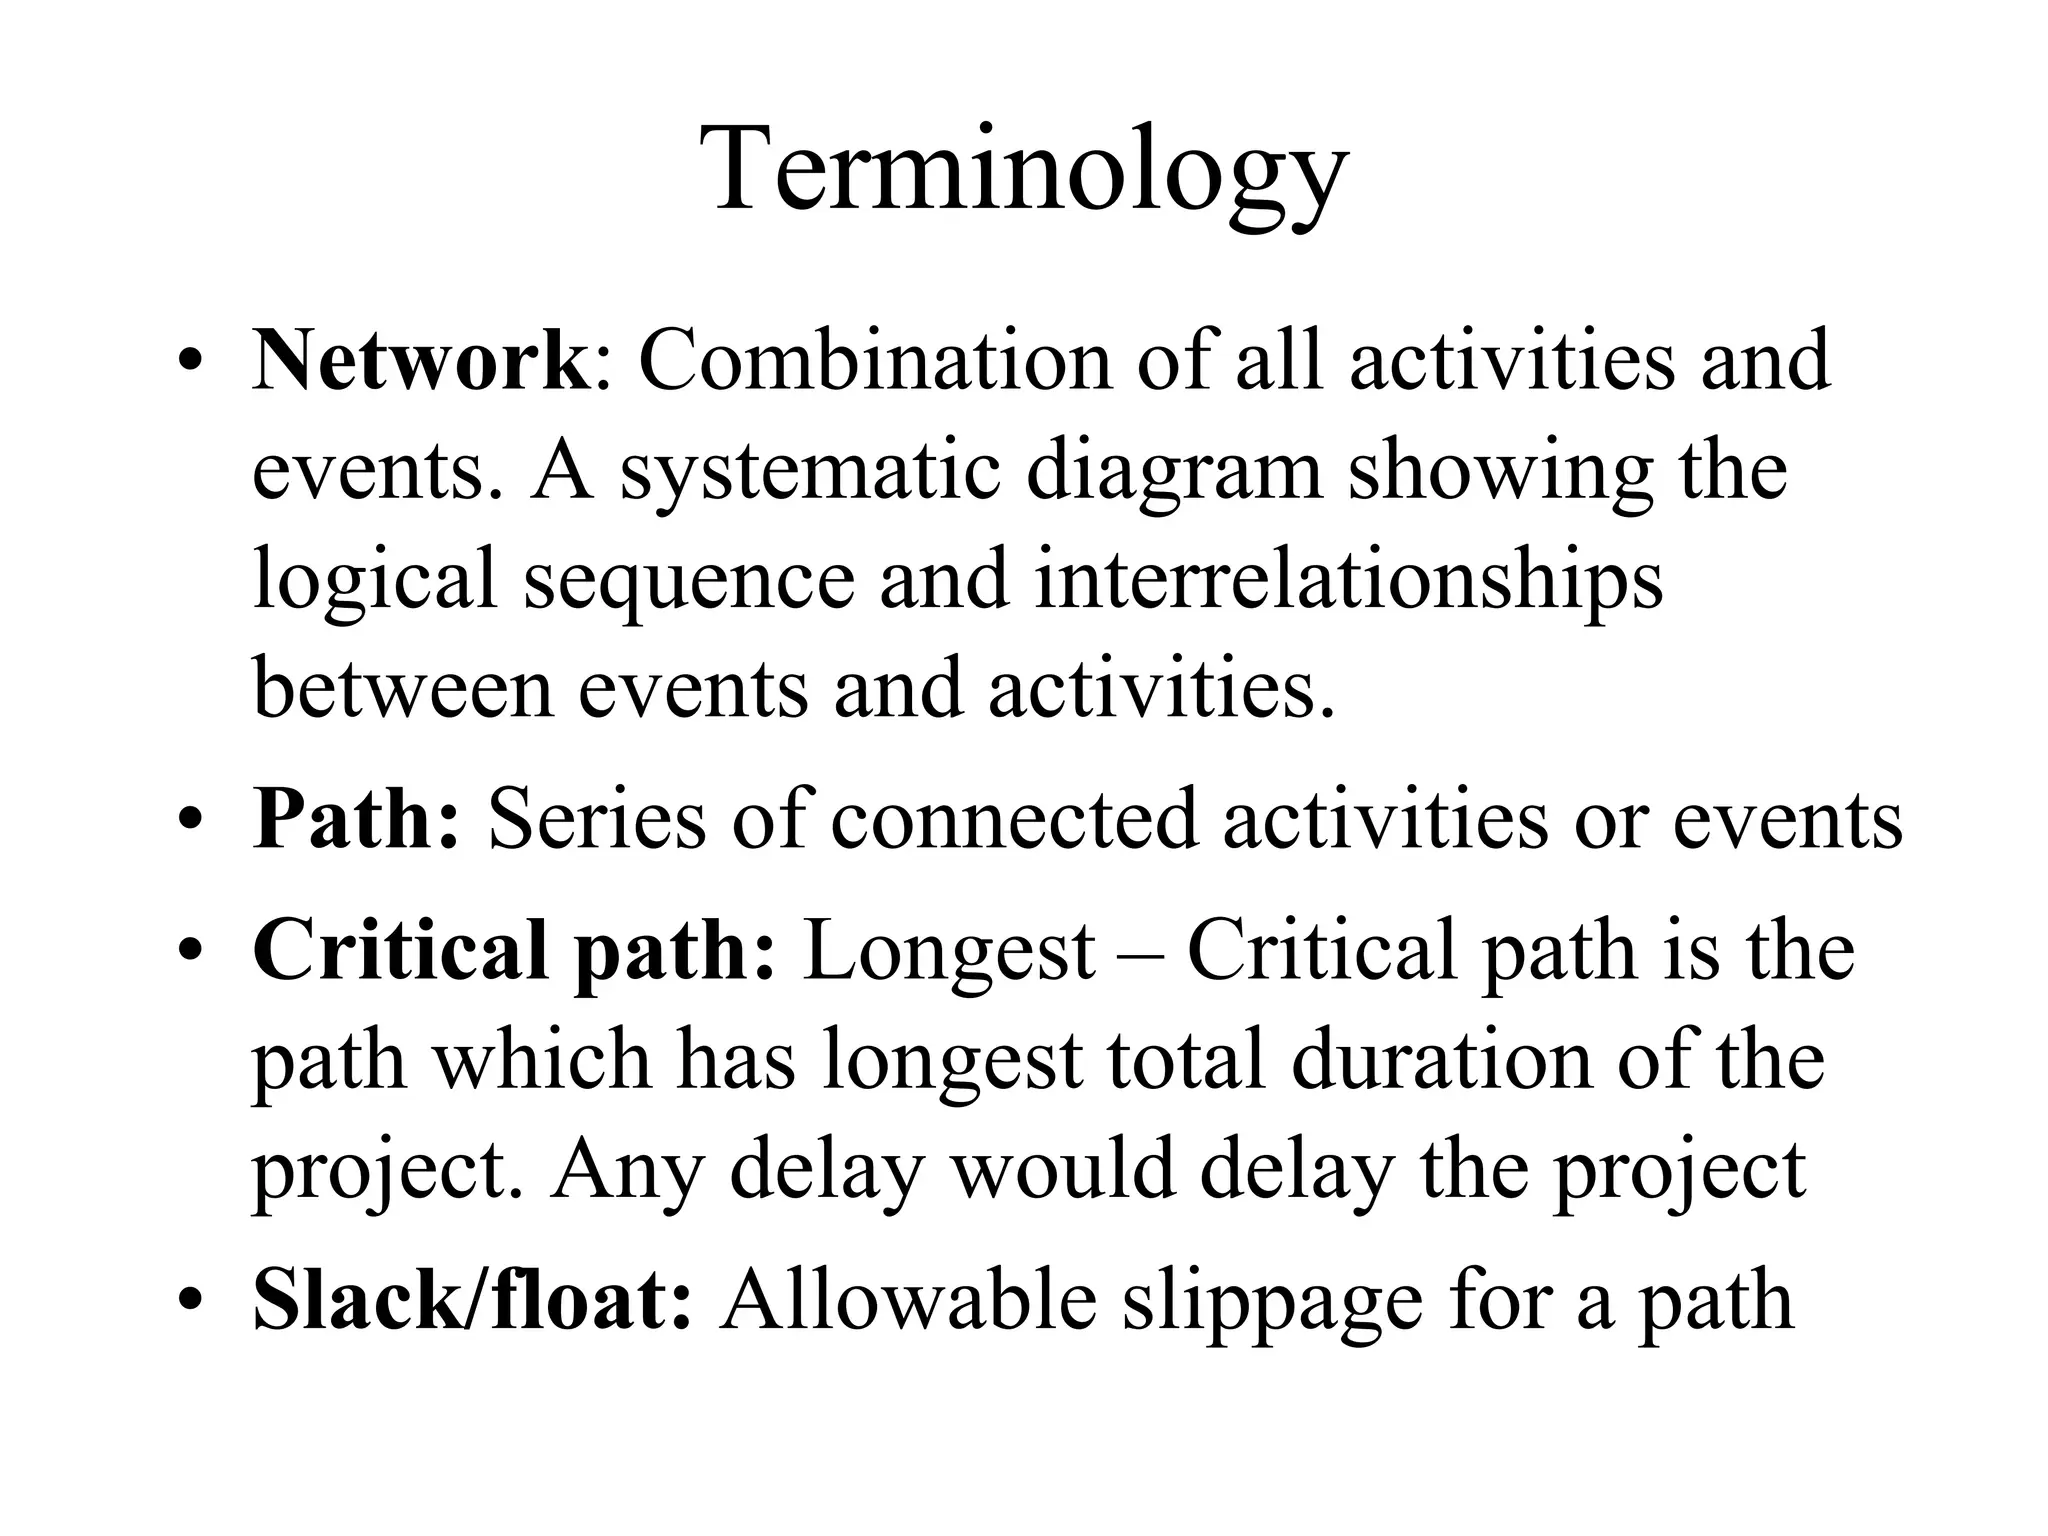
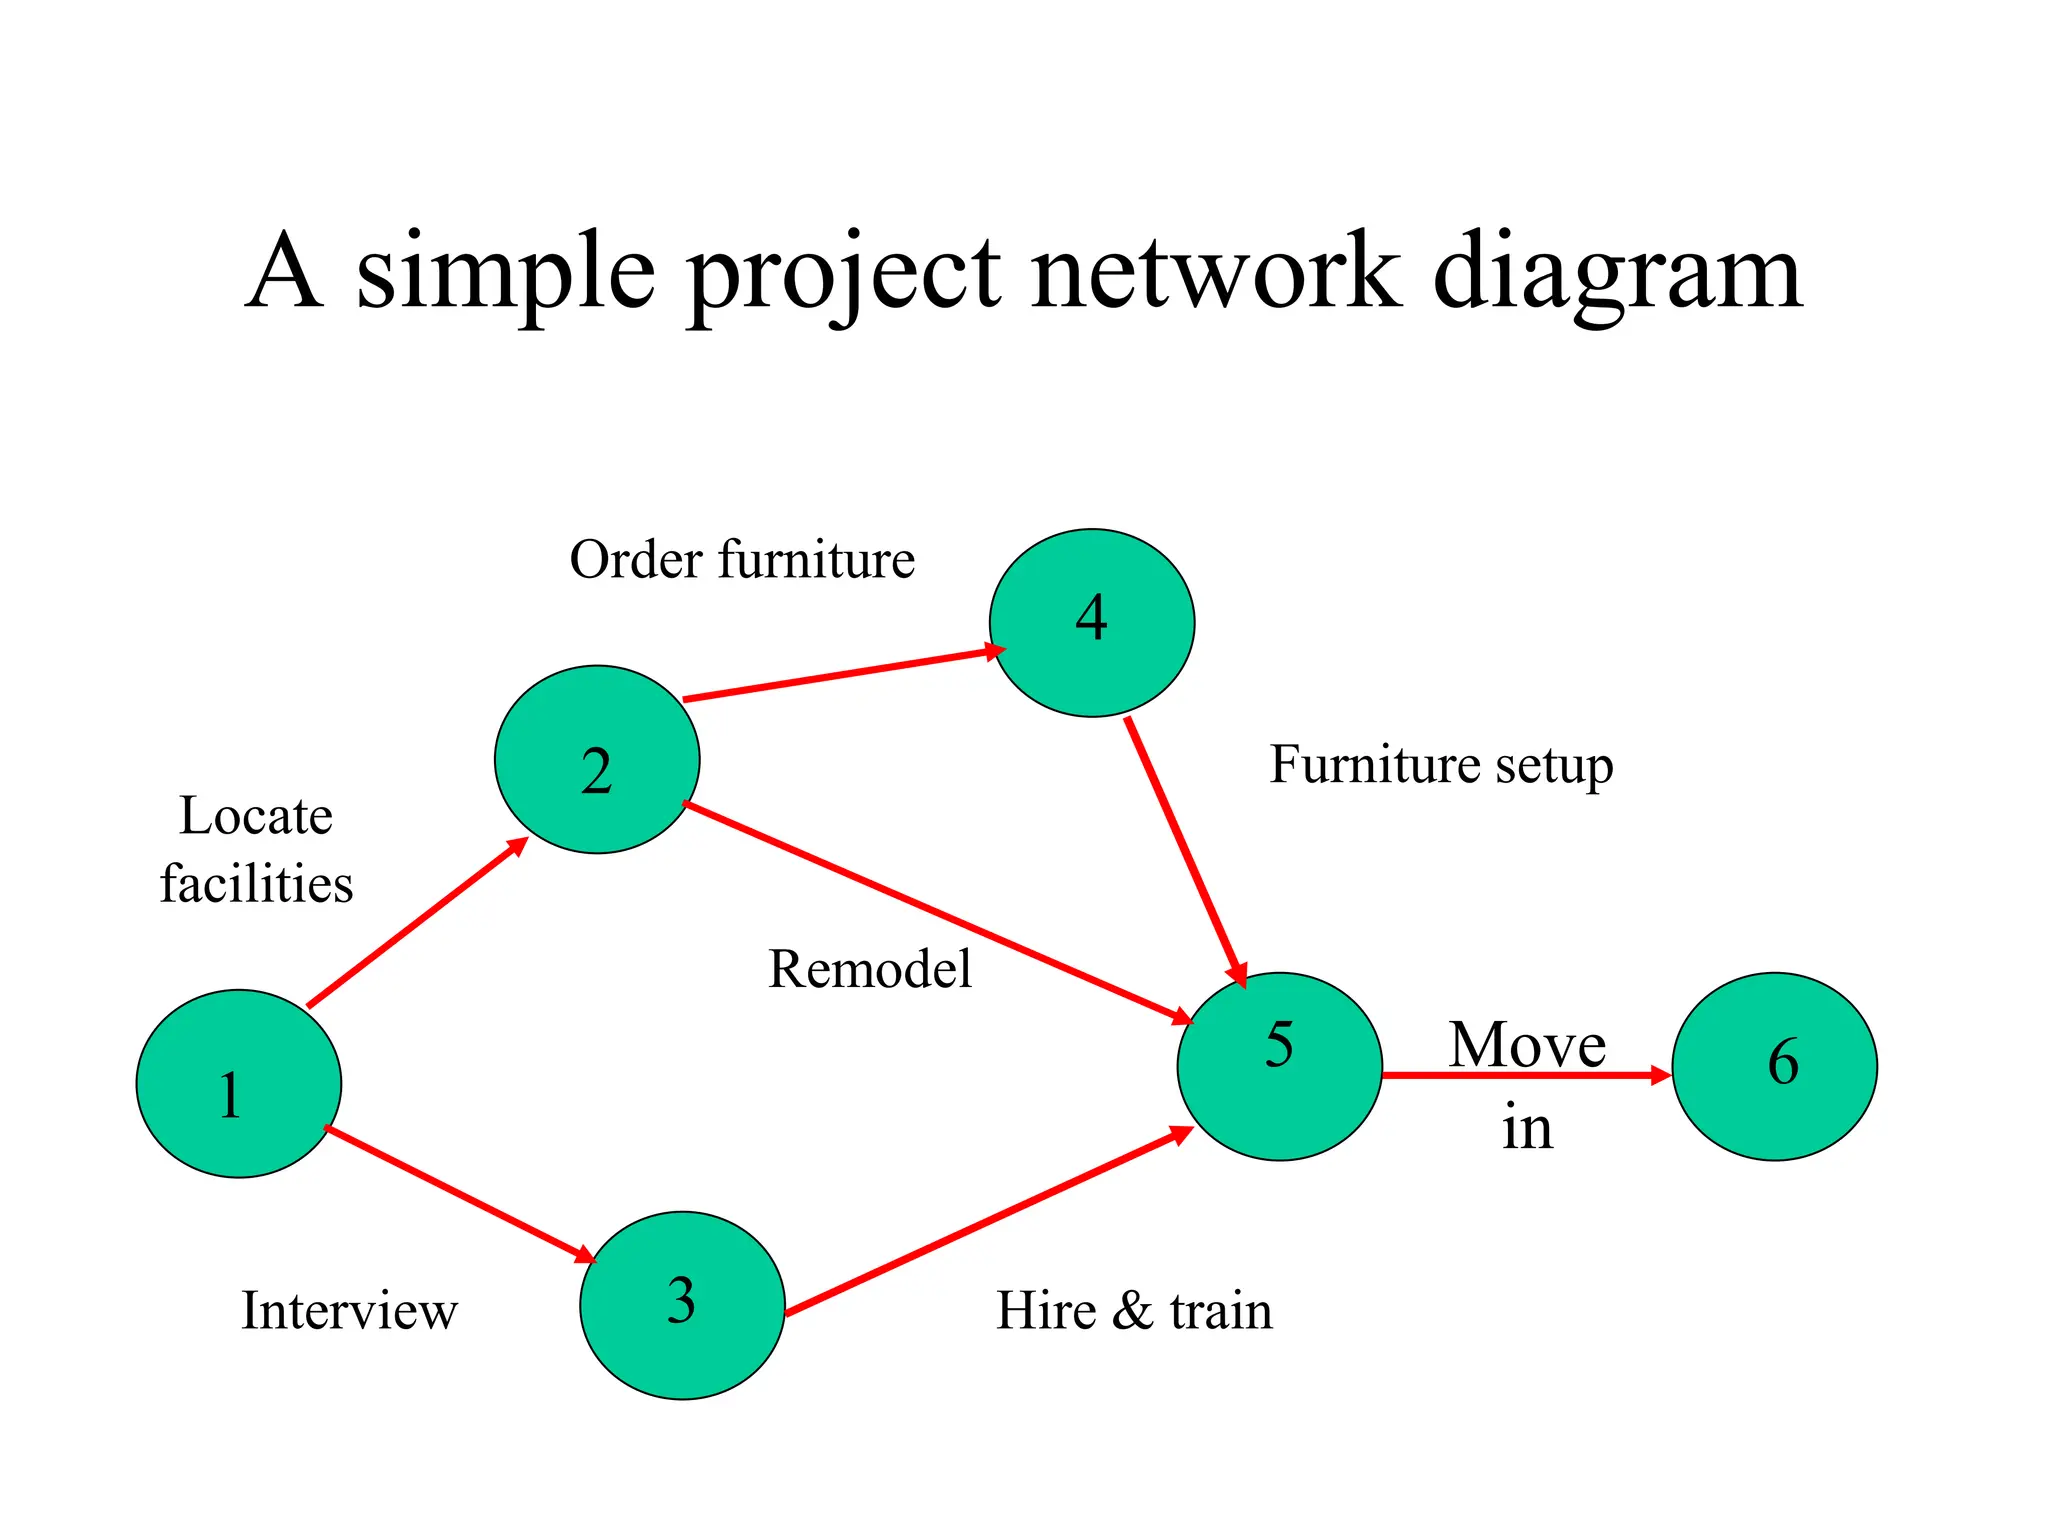
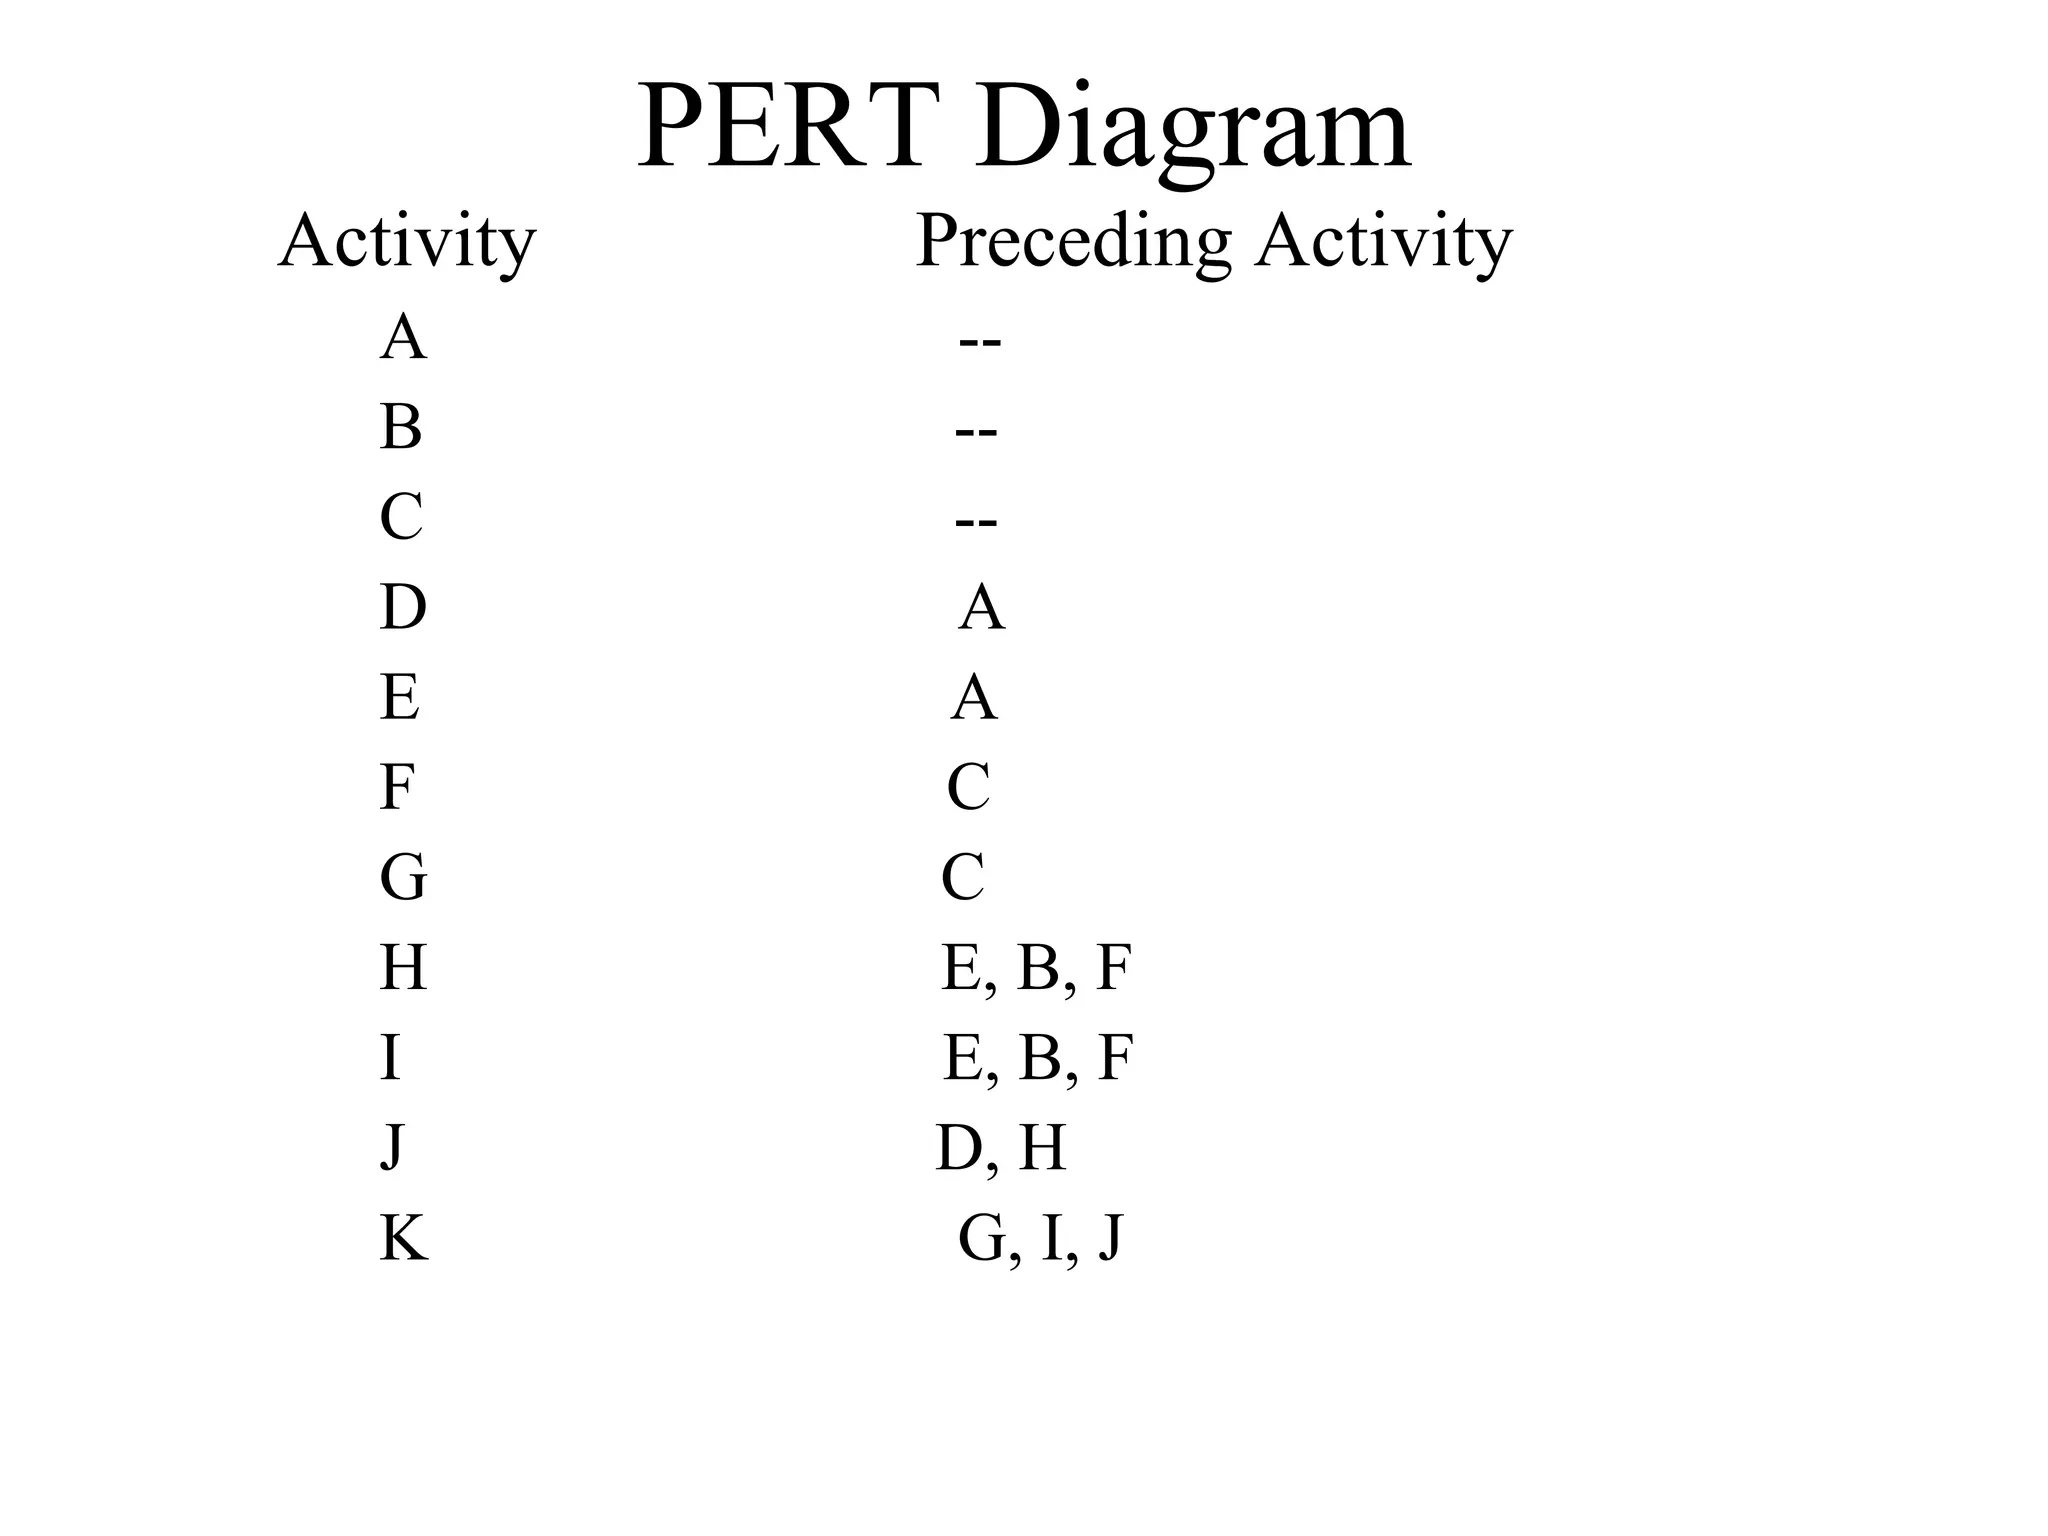
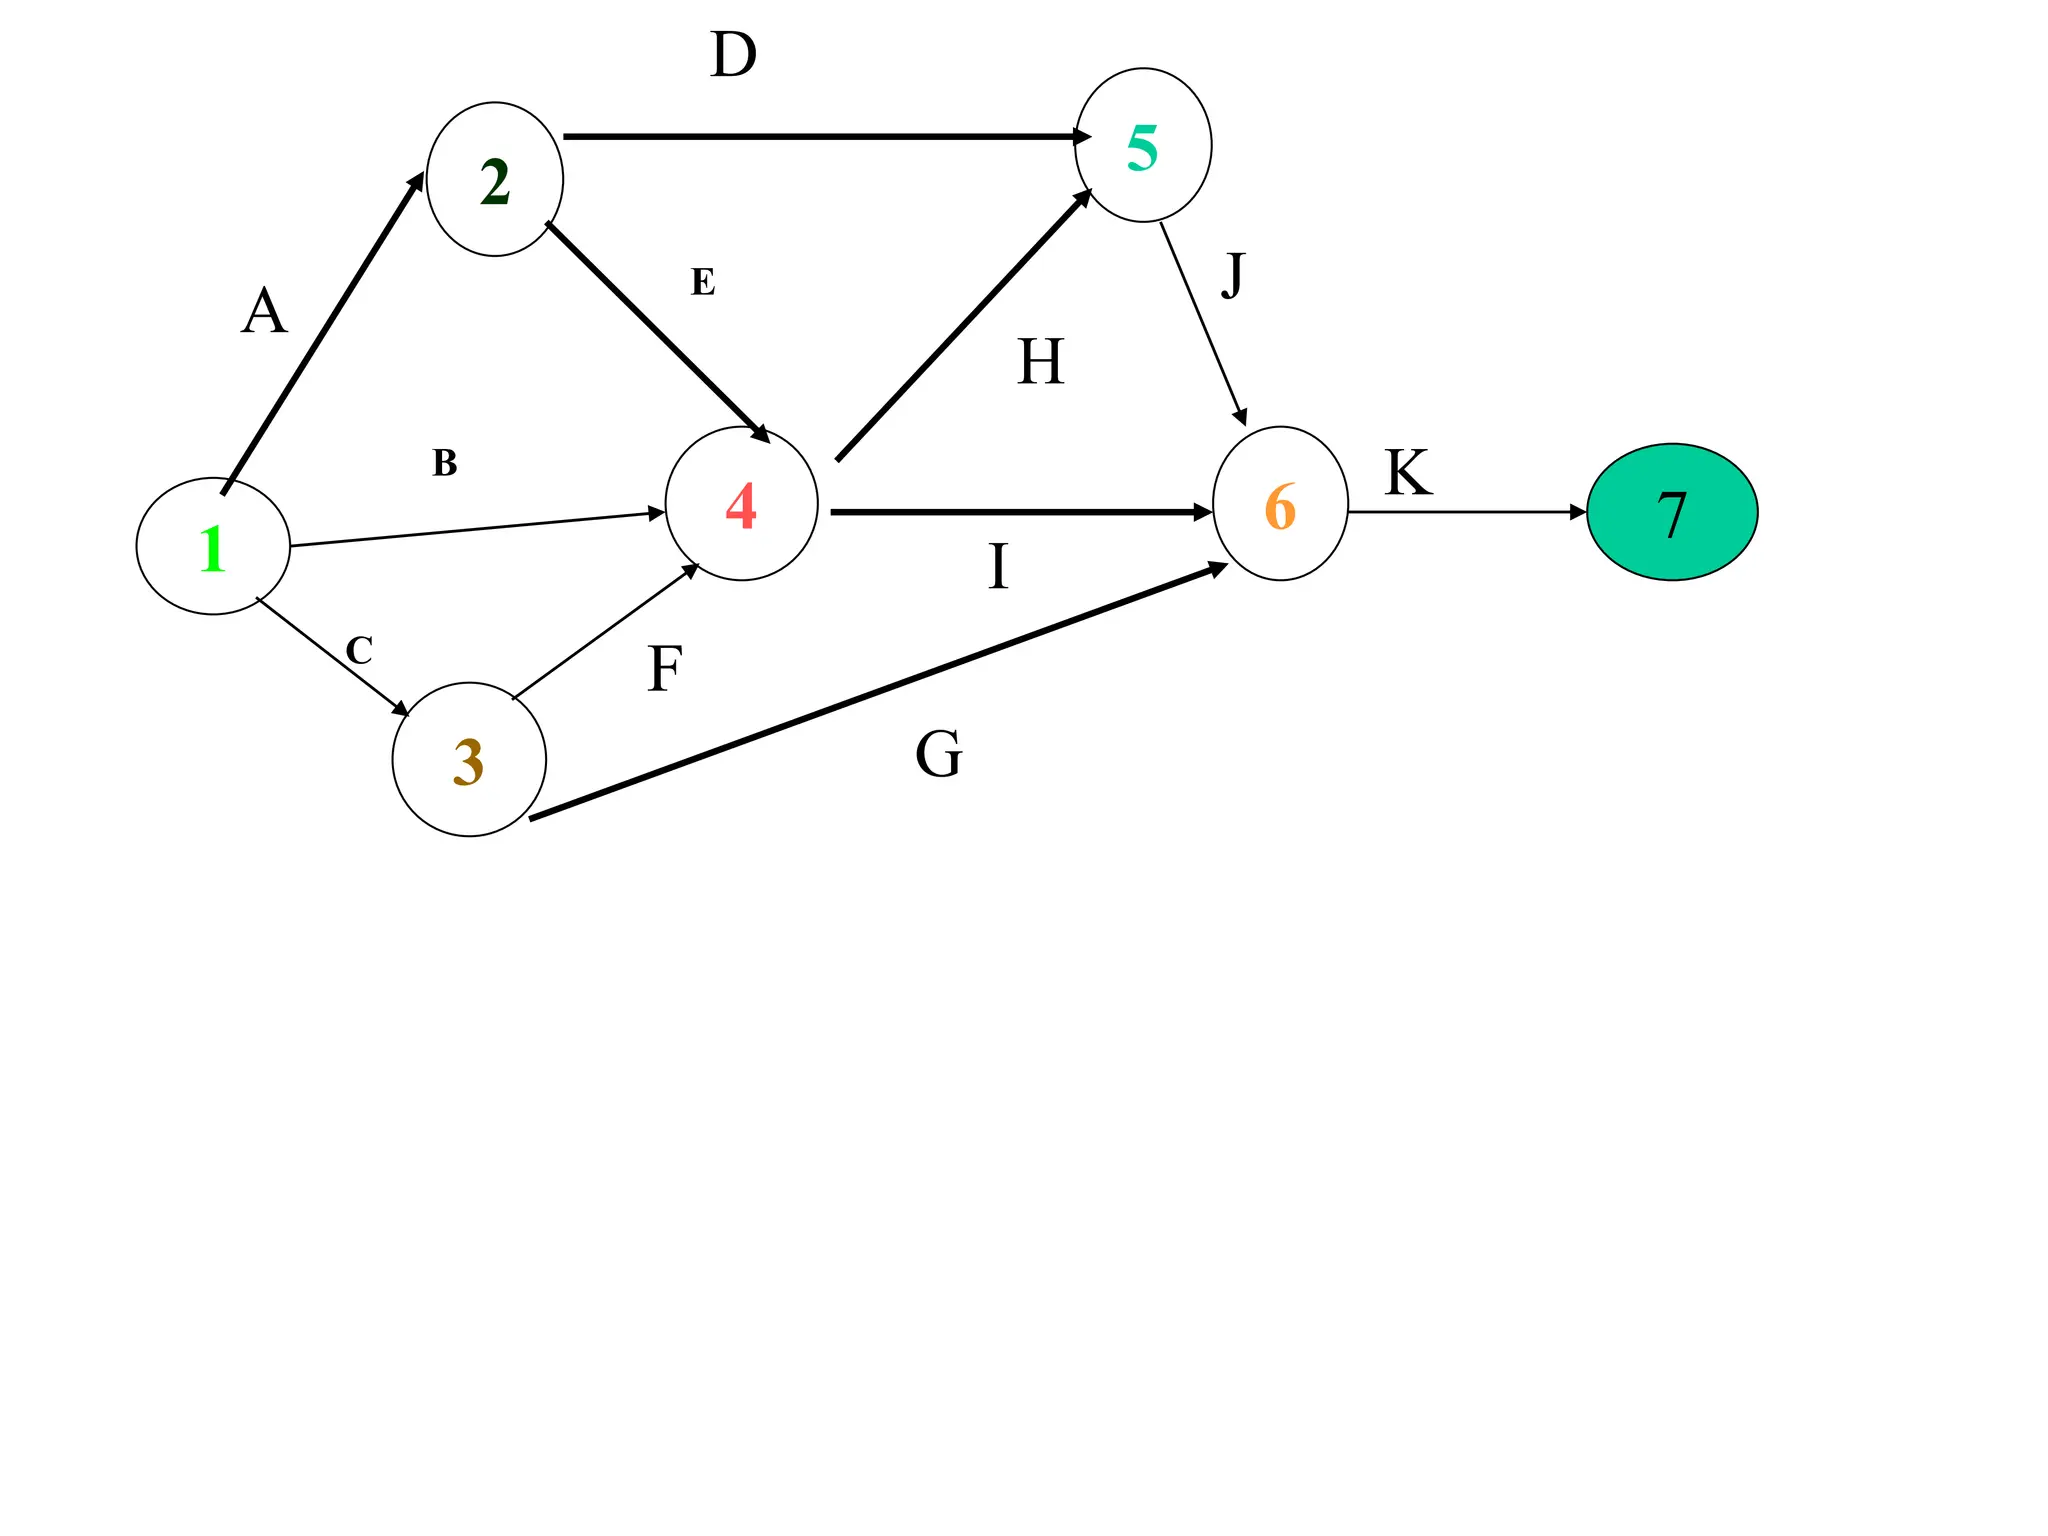
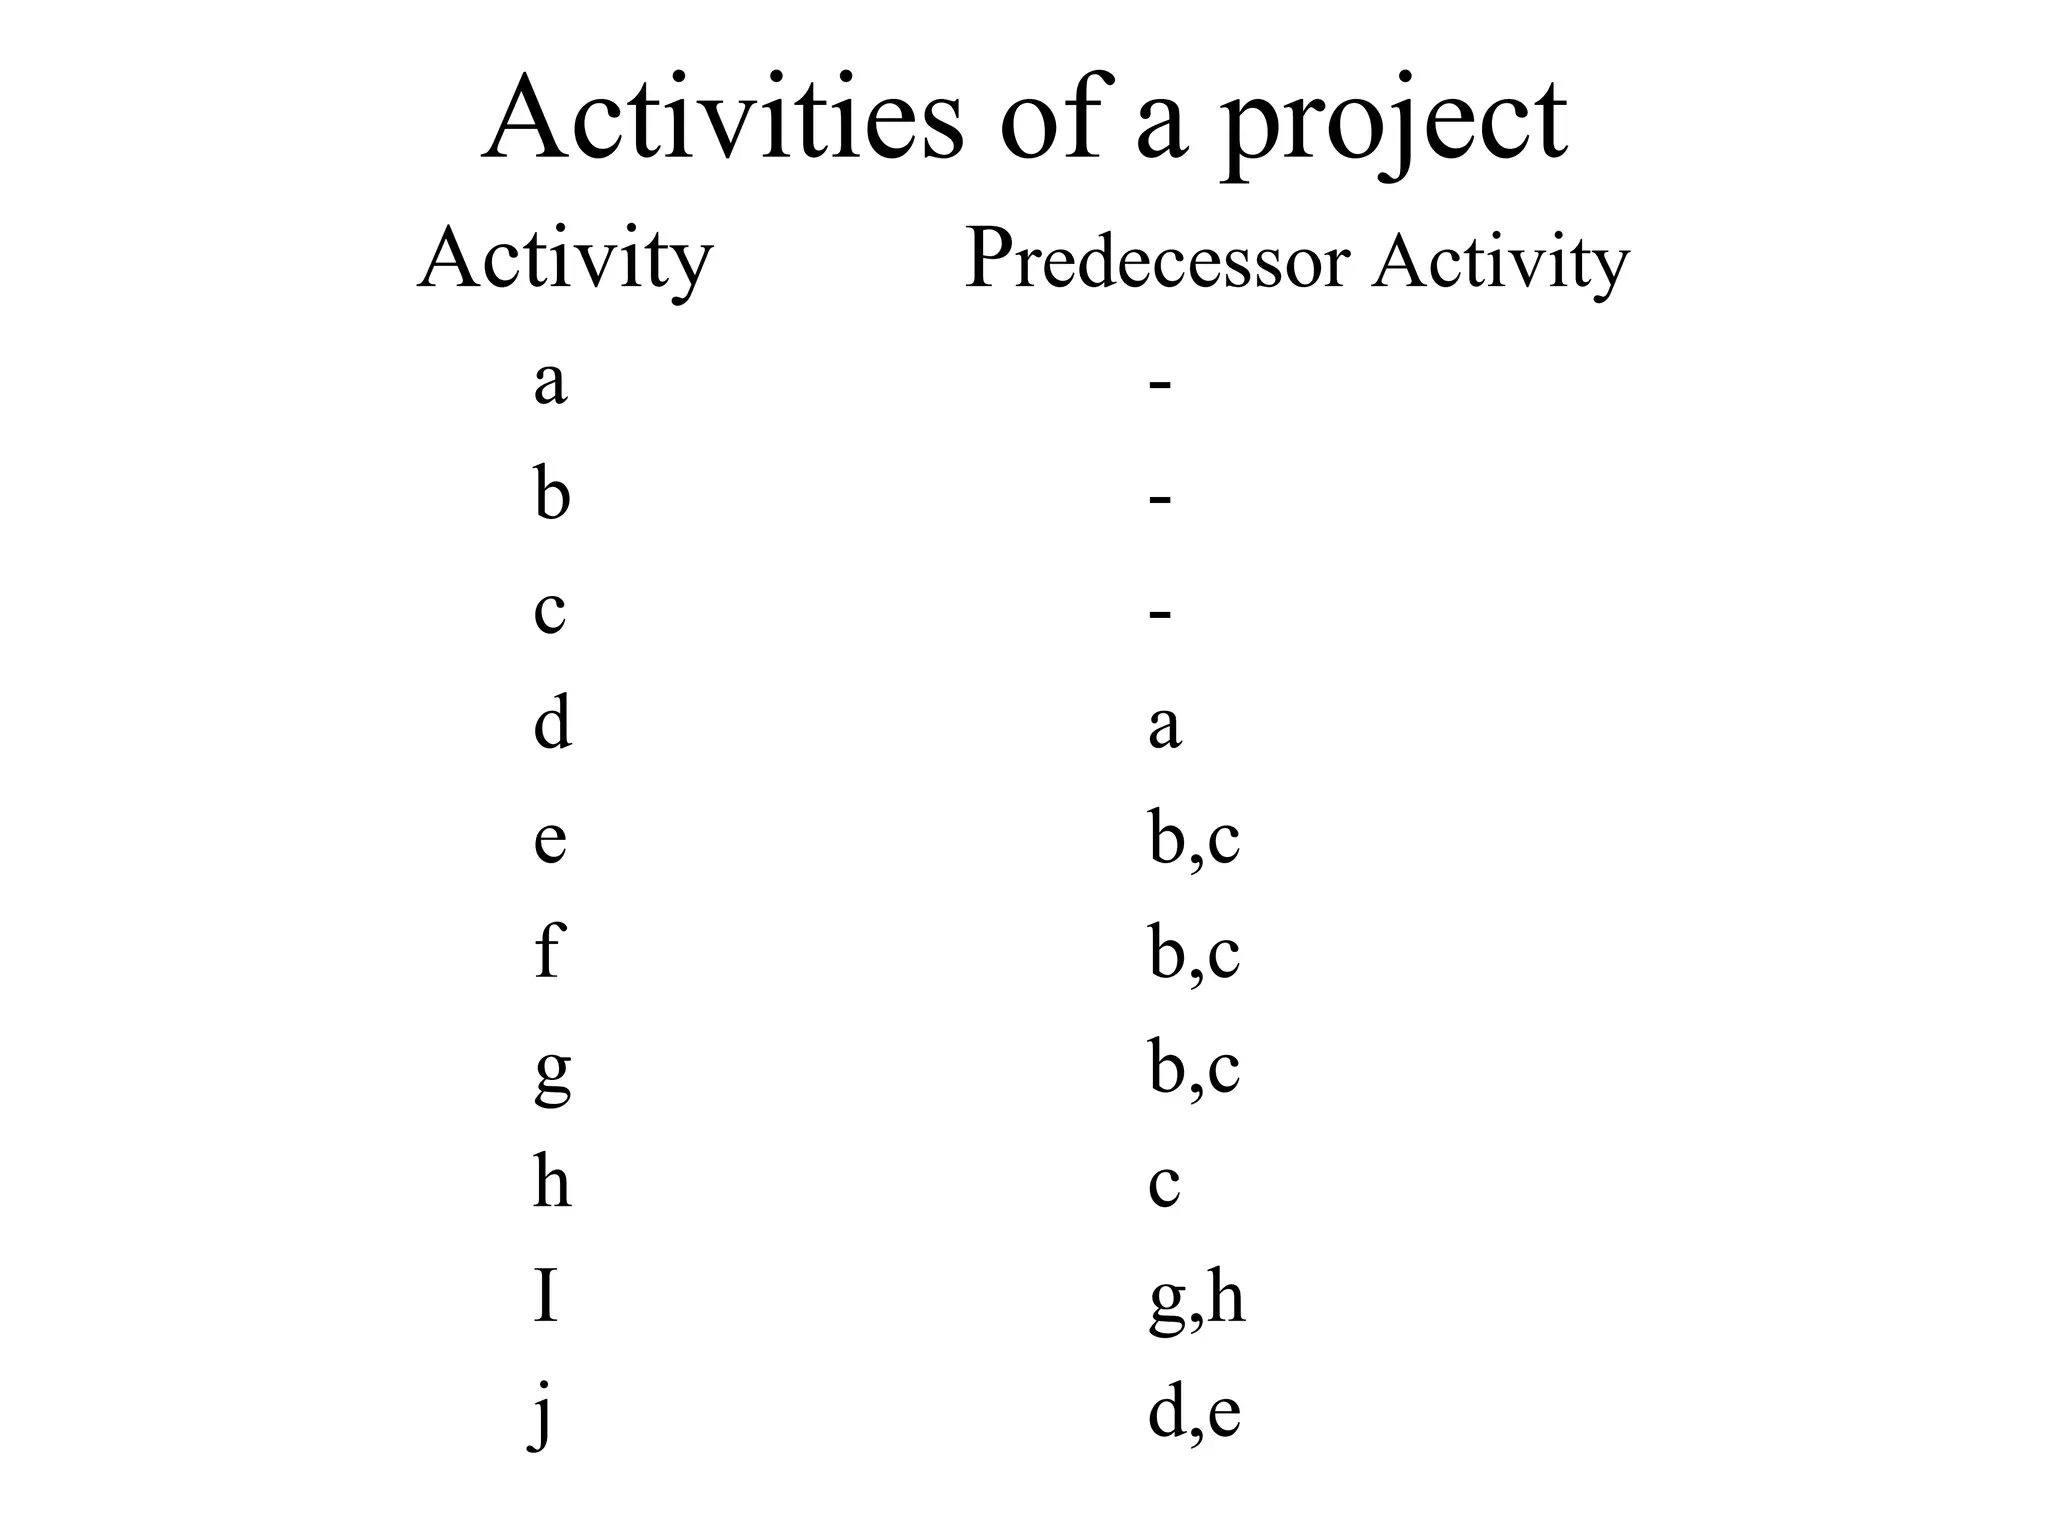
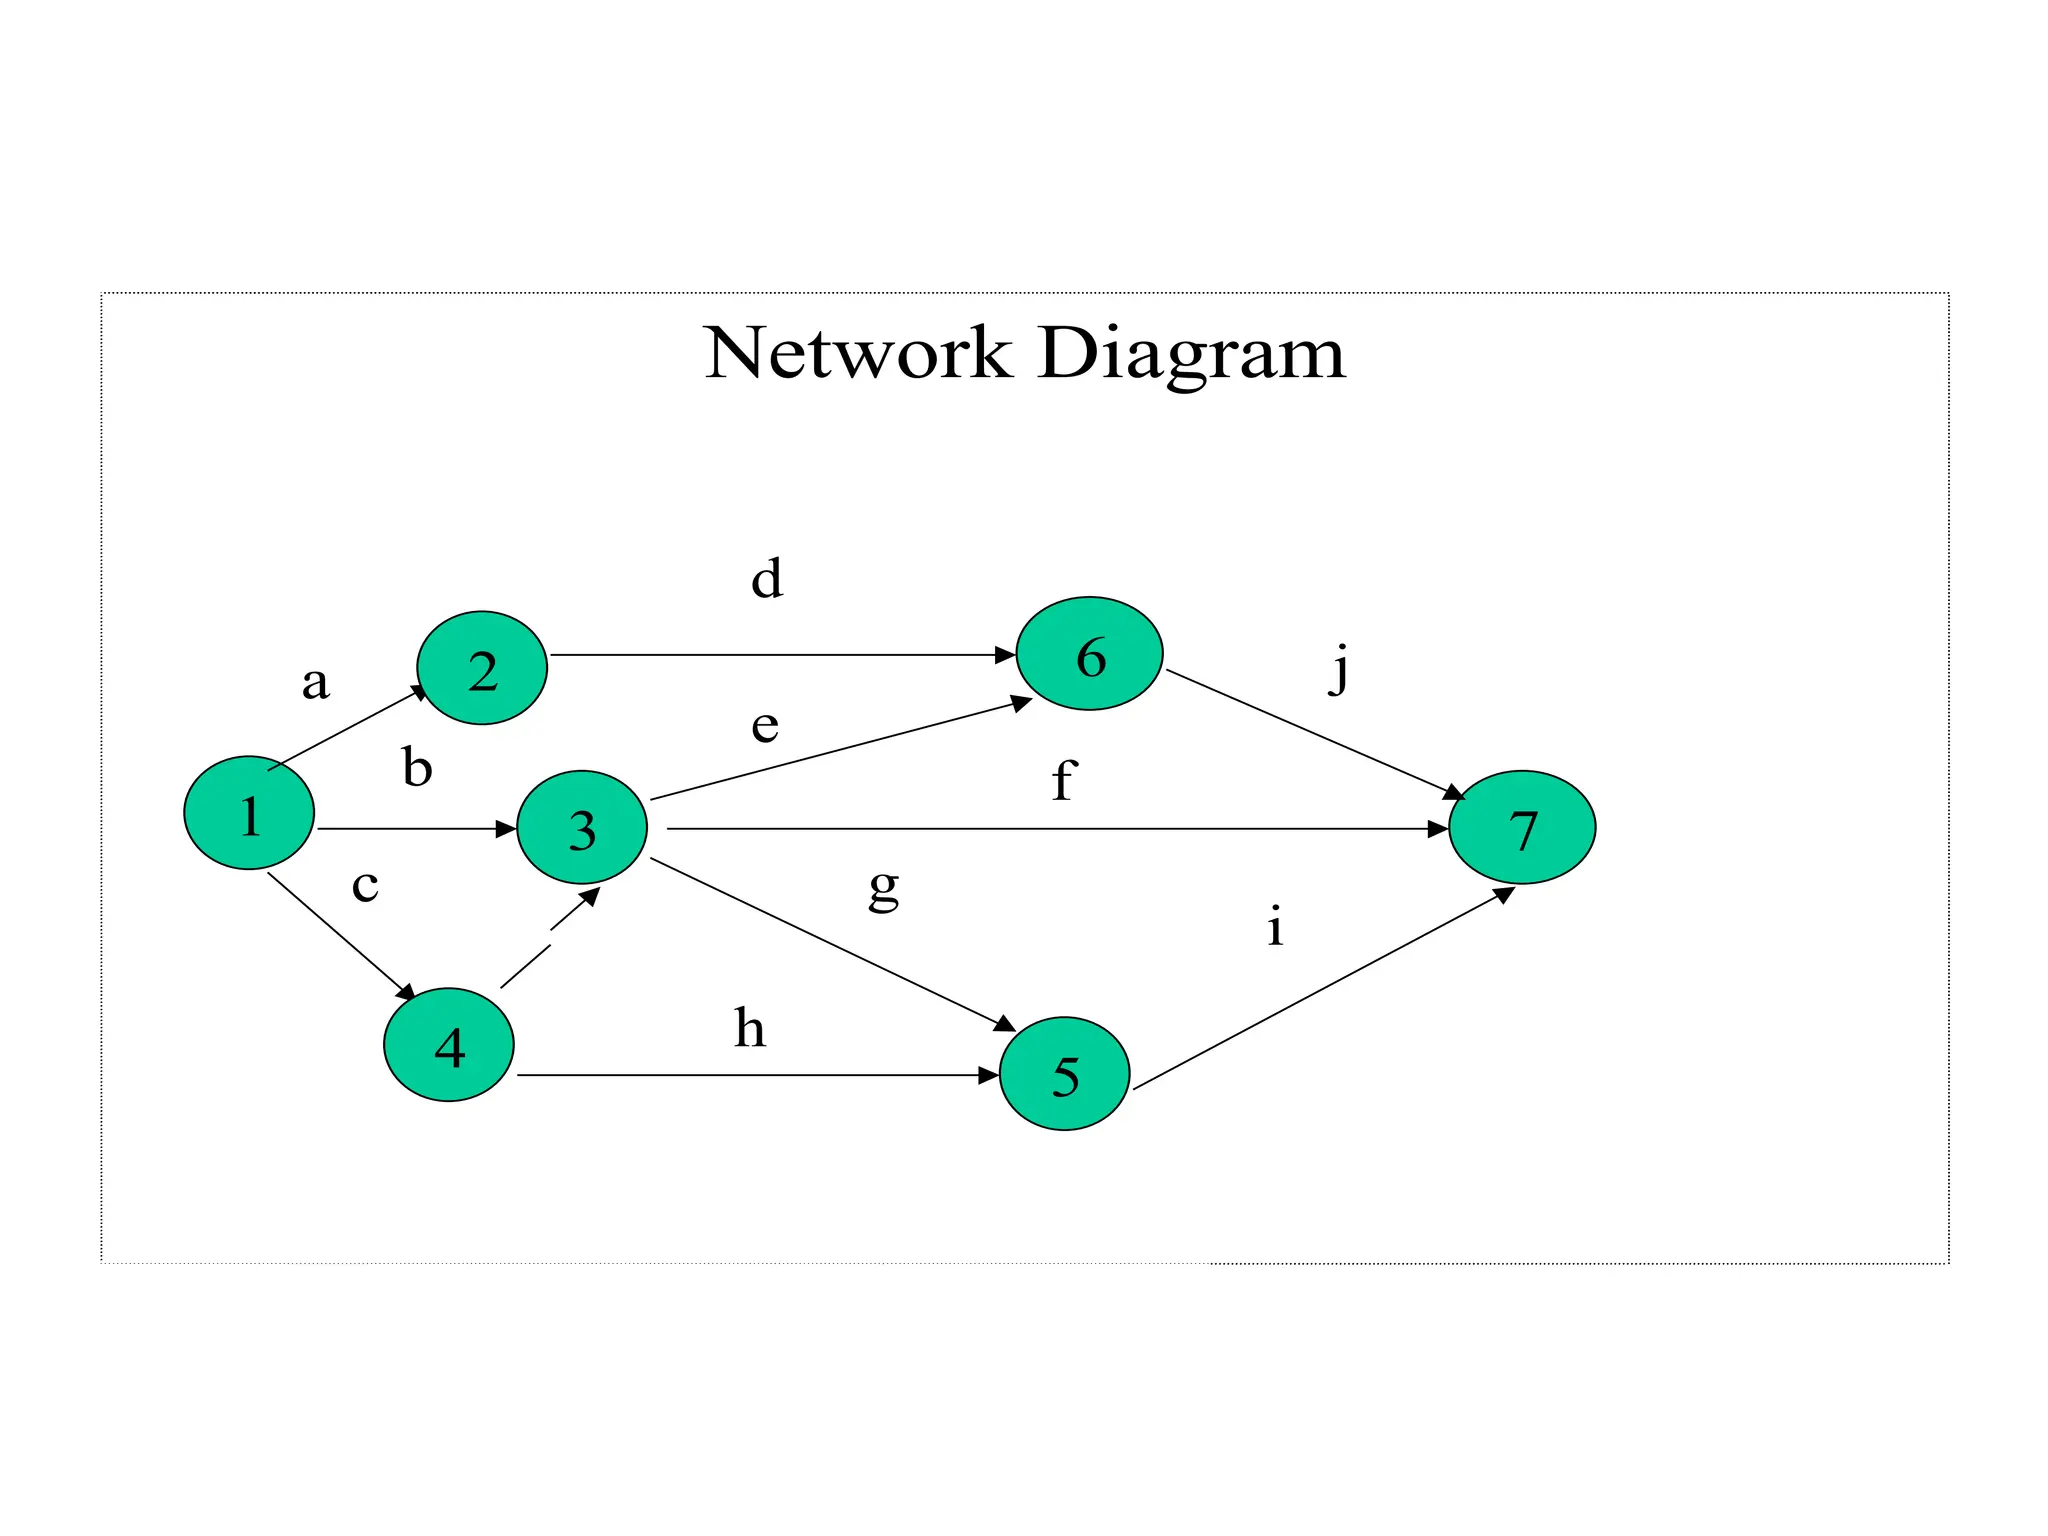
Project Management
Source: CASE material and online sources
Recap
 What is a Project
 Project Management
 Modern Tools and Techniques
 Project Selection Models
 Project Life Cycle
 Project manager and functional manager
 Project organizations
 Benefits of Project management
 Causes of failure of projects
Outline
 PERT and CPM
 Framework of PERT/CPM
 Terminology
 Drawing Network Diagrams
 Calculation of expected time
 Identification of critical path
 Gantt charts, Resource loading and leveling
 Work Breakdown Structures
 Linear Responsibility Charts
PERT AND CPM
• RERT (program evaluation and review
technique) and CPM (critical path method) are
two of the most widely used techniques for
planning and coordinating large scale projects.
• By using PERT or CPM managers are able to
obtain:
– A graphical display of the project activities
– An estimate of how long the project will take
– An indication of which activities are most critical
– An indication of how long an activity can be delayed
without lengthening the project
The framework of PERT and CPM
• For proceeding with PERT/CPM following
common six points have to be followed:
– Define the project with significant activities or tasks
– Develop relationship among the activities
– Draw network connecting all activities
– Assign time and/or cost estimates to each activity
– Compute the critical path
– Use network to help plan, schedule, monitor and
control the project
Terminology
• PERT: A technique for planning, scheduling and
controlling the activities
• Activity: A specific or set of tasks required by the
project. Actions taken to accomplish a task are
called activities which consumes time and other
organizational sources. Activities are represented by
arrows.
• Event: Outcome of one or more activities. The
starting and ending point of an activity is called
event. It is a statement of accomplished task from
where another activity starts. Events are represented
by circles called nodes.
Terminology
• Network: Combination of all activities and
events. A systematic diagram showing the
logical sequence and interrelationships
between events and activities.
• Path: Series of connected activities or events
• Critical path: Longest – Critical path is the
path which has longest total duration of the
project. Any delay would delay the project
• Slack/float: Allowable slippage for a path
A simple project network diagram
1
2
3
4
5 6
Locate
facilities
Interview
Order furniture
Remodel
Furniture setup
Hire & train
Move
in
Activity relationship
a
b
c
a
b
c
a
b
c
d
a
b
c
Dummy Activity
Activity Preceding Activity Time
A - 10
B - 12
C A 11
D B 16
E C, D 8
Expected time
Expected time = t = a + 4m + b
6
a = Optimistic time: Time taken if every thing
progress in an ideal manner with nothing going
wrong
m = Most probable time: This is most likely
activity time under the normal conditions
b = This is the pessimistic time if there are
abnormal conditions for any significant
breakdown or delay
Activity
Immediate
Predecessors
Time Estimates (Week)
Optimistic Most Probable Pessimistic
A - 4 5 12
B - 1 1.5 5
C A 2 3 4
D A 3 4 11
E A 2 3 4
F C 1.5 2 2.5
G D 1.5 3 4.5
H B, E 5 3.5 5
I H 1.5 2 2.5
J F, G, I 1 2 3
Activity
Immediate
Predecessor
Time Estimates (Week)
Expected time = t =(a + 4m + b)/6
A - 6
B - 2
C A 3
D A 5
E A 3
F C 2
G D 3
H B, E 4
I H 2
J F, G, I 2
2 5
7
1 4 8
3 6
Routing
(C)
Product
Design
(A)
Market
Research
Plan
(B)
Prototype
(D)
Marketing
Brochure
(E)
Cost
Estimates
(F)
Testing
(G)
Market
Survey
(H)
Pricing
and
Forecast
(I)
Final
Report
(J)
COMPLETION
Activity list for the Daugherty Porta-Vac Project
Activity Description Immediate
Predecessors
A R&D product design -
B Plan market research -
C Routing (manufacturing engineering) A
D Build prototype model A
E Prepare marketing brochure A
F Cost estimates (industrial engineering) C
G Preliminary product testing D
H Market survey B, E
I Pricing and forecast report H
J Final report F, G, I
2
4 5
1
3
(A) (B)
(C) (D)
(E)
Activity List for a Two-Machine Maintenance Project
Activity Description Expected Time
(in days)
A Overhaul machine I 7
B Adjust machine I 3
C Overhaul machine II 6
D Adjust machine II 3
E Test system 2
PERT Diagram
Activity Preceding Activity
A --
B --
C --
D A
E A
F C
G C
H E, B, F
I E, B, F
J D, H
K G, I, J
2
4 6
1
3
E
5
B
C
G
J
K
7
H
I
A
D
F
Activities of a project
Activity Predecessor Activity
a -
b -
c -
d a
e b,c
f b,c
g b,c
h c
I g,h
j d,e
•
Network Diagram
1
2
4
3
6
5
7
a
b
c
d
e
f
g
h
i
j
Make a Network Diagram
Activity Time
(days)
Preceding
Activity
A 6 --
B 2 --
C 2 --
D 3 --
E 8 A
F 5 B, E
G 9 C, F, D
H 3 --
I 2 P, H
J 3 B, E
K 10 G
L 1 D
M 10 I, J, K
N 3 L, Q
O 5 M, N
P 4 A
Q 5 G
1
3
4
2
6 7
5 8
9
10
11
A,6
H, 3
B, 2
C, 2
D, 3
L, 1
Q, 5
G, 9
N, 3
K,
10
J, 3
I, 2
O, 5
Dum1
P, 4
M, 10
E, 8
F, 5
Resource loading describes the amount of individual resource
an existing schedule requires during specific time periods.
The PERT/CPM network technique is well suited for the job of
generating time-phased resource requirements.
Resource Loading
Resource Leveling
Resource leveling aims to minimize the period-by-period
variations in resource lading by shifting tasks within their
slack allowances.
The Work Breakdown Structure & Linear
Responsibility Charts
 Pictures a project subdivided into hierarchical units of task,
subtasks, work packages, etc.
 The project management software actually creates WBSs
automatically, given that the action plans have been input.
 WBSs are usually in the form of outlines with the first level
tasks at the left, and successive levels appropriately indented.
230XZ3
Robot
(10.00.00)
Electronics
(12.00.00)
Contract
admin.
(13.00.00)
Install. &
service
(15.00.00)
Manufatrg.
(14.00.00)
Systems
design
(11.00.00)
Syst.
engr.
(11.01.00)
Prof.
test
(11.02.00)
Equip.
(12.01.00)
Sftwr.
(12.03.00)
Prod.
cntrl.
Mfg.
engr.
Personnel
Data
Site
prep.
Logistics
Cntrl
(12.02.00)
Vrtl.
(12.02.01)
Elbow
(12.02.02)
Wrist
(12.02.03)
Engrs.
(12.02.04)
Trans.
(12.02.05)
Work Breakdown Structure
(account numbers shown)
Cont.
 It may illustrate:
 How each project contributes to the whole in terms performance,
responsibility, budget, schedule.
 List the vendors and sub contractors associated with specific
tasks.
 Documentation of that all parties have signed-off on their various
commitments to the projects.
 Any specifications for any work package, establish account
numbers, specify hardware/software to be used, and identify
resource needs.
 The basis for making cost estimates.
Procedure for designing and using the
WBS
1. Using information from the action plan, list the task
breakdown in successively finer levels of detail. Continue
until all meaningful tasks or work packages have been
identified and each task can be individually planned,
budgeted, scheduled, monitored, and controlled.
2. For each work package, identify the data relevant to the
WBS. List the personnel and organizations responsible for
each task.
Cont.
It is helpful to construct a linear responsibility chart
(sometimes called a responsibility matrix) to show who is
responsible for what. This chart also shows critical interfaces
between units that may require special managerial
coordination. With it, the PM can keep track of who must
approve what and who must report to whom.
Linear Responsibility Chart
Legend:
 Responsible
 Support
 Notification
 Approval
Subproject Task
Project
Manager
Contract
Admin.
Project
Eng.
Industrial
Eng.
Determine
Need
A1
A2
  
   
Solicit
Quotations B1
   
Write Approp.
Request C1
   
C2
  
C3
   
“
“
“
“
“
“
WBS
Responsibility
Project Office Field Oper.
Field
Manager
Simplified Linear
Responsibility Chart
Vice-president
General
manager
Project
manager
Manager
engineering
Manager
software
Manager
manfrg
Manager
mrktg
Subprogram
manager
mafrg
Subprogram
Manager
software
Subprogram
Manager
hardware
Subprogram
Manager
services
Establish project plan 6 2 1 3 3 3 3 4 4 4 4
Define WBS 5 1 3 3 3 3 3 3 3 3
Establish hardware specs 2 3 1 4 4 4
Establish software specs 2 3 4 1 4
Establish interface specs 2 3 1 4 4 4
Establish manufacturing specs 2 3 4 4 1 4
Define documentation 2 1 4 4 4 4
1 Actual responsibility, 2 General supervision, 3 Must be consulted,
4 May be consulted, 5 Must be noted, 6 Final Approach
Verbal Responsibility Chart
Legend:
IA, ILI, IHI: Product lines
LOB: Line of business
MC: Management committee
M-A Cttee: Marketing administration committee
S&S: Sales and service
MP&R: Marketing planning and research
Clear Action
with
Activities
Responsible Individuals
Work with
Initiate Action
Distribution System
And its Administration
1. Recommend distribution
system to be used.
Mktg Officer
Mktg Officer
Mktg Officer
LIL & IHI LOB
MCs
M-A Cttee
VP & Agcy Dir
Group LOB MC
M-A Cttee
VP & Agcy Dir
IA LOB MC
M-A Cttee
VP & Agcy Dir
Sr VP Mktg
Sr VP Mktg
Sr VP Mktg
Compensation
2. Determine provisions of
sales compensation programs
(e.g., commissions, subsidies,
fringes).
3. Ensure cost-effectiveness
testing of sales compensation
programs.
Compensation
Task Force
Compensation
Task Force
Compensation
Task Force
Compensation
Task Force
Mktg, S&S &
Eqty Prod Offrs
Mktg, S&S &
Eqty Prod Offrs
Mktg, S&S &
Eqty Prod Offrs
Mktg, S&S &
Eqty Prod Offrs
President
President
President
Territory
4. Establish territorial strategy
for our primary distribution
system.
VP & Agcy Dir Dir MP&R
M-A Cttee
Sr VP Mktg
Clear Action
with
Activities
Responsible Individuals
Work with
Initiate Action
Territory
5. Determine territories for
agency locations and establish
priorities for standing.
6. Determine agencies in
Which advanced sales
personnel
Are to operate.
VP & Agcy Dir
Dir Ret Pln
Sls
Dir Adv Sls
Dir MP&R
M-A Cttee
VP S&S
Sr VP Mktg
Sr VP Mktg

EO notes Lecture 27 Project Management 2.ppt

  • 1.
    Project Management Source: CASEmaterial and online sources
  • 2.
    Recap  What isa Project  Project Management  Modern Tools and Techniques  Project Selection Models  Project Life Cycle  Project manager and functional manager  Project organizations  Benefits of Project management  Causes of failure of projects
  • 3.
    Outline  PERT andCPM  Framework of PERT/CPM  Terminology  Drawing Network Diagrams  Calculation of expected time  Identification of critical path  Gantt charts, Resource loading and leveling  Work Breakdown Structures  Linear Responsibility Charts
  • 4.
    PERT AND CPM •RERT (program evaluation and review technique) and CPM (critical path method) are two of the most widely used techniques for planning and coordinating large scale projects. • By using PERT or CPM managers are able to obtain: – A graphical display of the project activities – An estimate of how long the project will take – An indication of which activities are most critical – An indication of how long an activity can be delayed without lengthening the project
  • 5.
    The framework ofPERT and CPM • For proceeding with PERT/CPM following common six points have to be followed: – Define the project with significant activities or tasks – Develop relationship among the activities – Draw network connecting all activities – Assign time and/or cost estimates to each activity – Compute the critical path – Use network to help plan, schedule, monitor and control the project
  • 6.
    Terminology • PERT: Atechnique for planning, scheduling and controlling the activities • Activity: A specific or set of tasks required by the project. Actions taken to accomplish a task are called activities which consumes time and other organizational sources. Activities are represented by arrows. • Event: Outcome of one or more activities. The starting and ending point of an activity is called event. It is a statement of accomplished task from where another activity starts. Events are represented by circles called nodes.
  • 7.
    Terminology • Network: Combinationof all activities and events. A systematic diagram showing the logical sequence and interrelationships between events and activities. • Path: Series of connected activities or events • Critical path: Longest – Critical path is the path which has longest total duration of the project. Any delay would delay the project • Slack/float: Allowable slippage for a path
  • 8.
    A simple projectnetwork diagram 1 2 3 4 5 6 Locate facilities Interview Order furniture Remodel Furniture setup Hire & train Move in
  • 9.
  • 10.
  • 11.
    Activity Preceding ActivityTime A - 10 B - 12 C A 11 D B 16 E C, D 8
  • 12.
    Expected time Expected time= t = a + 4m + b 6 a = Optimistic time: Time taken if every thing progress in an ideal manner with nothing going wrong m = Most probable time: This is most likely activity time under the normal conditions b = This is the pessimistic time if there are abnormal conditions for any significant breakdown or delay
  • 13.
    Activity Immediate Predecessors Time Estimates (Week) OptimisticMost Probable Pessimistic A - 4 5 12 B - 1 1.5 5 C A 2 3 4 D A 3 4 11 E A 2 3 4 F C 1.5 2 2.5 G D 1.5 3 4.5 H B, E 5 3.5 5 I H 1.5 2 2.5 J F, G, I 1 2 3
  • 14.
    Activity Immediate Predecessor Time Estimates (Week) Expectedtime = t =(a + 4m + b)/6 A - 6 B - 2 C A 3 D A 5 E A 3 F C 2 G D 3 H B, E 4 I H 2 J F, G, I 2
  • 16.
    2 5 7 1 48 3 6 Routing (C) Product Design (A) Market Research Plan (B) Prototype (D) Marketing Brochure (E) Cost Estimates (F) Testing (G) Market Survey (H) Pricing and Forecast (I) Final Report (J) COMPLETION Activity list for the Daugherty Porta-Vac Project Activity Description Immediate Predecessors A R&D product design - B Plan market research - C Routing (manufacturing engineering) A D Build prototype model A E Prepare marketing brochure A F Cost estimates (industrial engineering) C G Preliminary product testing D H Market survey B, E I Pricing and forecast report H J Final report F, G, I
  • 17.
    2 4 5 1 3 (A) (B) (C)(D) (E) Activity List for a Two-Machine Maintenance Project Activity Description Expected Time (in days) A Overhaul machine I 7 B Adjust machine I 3 C Overhaul machine II 6 D Adjust machine II 3 E Test system 2
  • 18.
    PERT Diagram Activity PrecedingActivity A -- B -- C -- D A E A F C G C H E, B, F I E, B, F J D, H K G, I, J
  • 19.
  • 20.
    Activities of aproject Activity Predecessor Activity a - b - c - d a e b,c f b,c g b,c h c I g,h j d,e
  • 21.
  • 22.
    Make a NetworkDiagram Activity Time (days) Preceding Activity A 6 -- B 2 -- C 2 -- D 3 -- E 8 A F 5 B, E G 9 C, F, D H 3 -- I 2 P, H J 3 B, E K 10 G L 1 D M 10 I, J, K N 3 L, Q O 5 M, N P 4 A Q 5 G
  • 23.
    1 3 4 2 6 7 5 8 9 10 11 A,6 H,3 B, 2 C, 2 D, 3 L, 1 Q, 5 G, 9 N, 3 K, 10 J, 3 I, 2 O, 5 Dum1 P, 4 M, 10 E, 8 F, 5
  • 27.
    Resource loading describesthe amount of individual resource an existing schedule requires during specific time periods. The PERT/CPM network technique is well suited for the job of generating time-phased resource requirements. Resource Loading Resource Leveling Resource leveling aims to minimize the period-by-period variations in resource lading by shifting tasks within their slack allowances.
  • 28.
    The Work BreakdownStructure & Linear Responsibility Charts  Pictures a project subdivided into hierarchical units of task, subtasks, work packages, etc.  The project management software actually creates WBSs automatically, given that the action plans have been input.  WBSs are usually in the form of outlines with the first level tasks at the left, and successive levels appropriately indented.
  • 29.
  • 30.
    Cont.  It mayillustrate:  How each project contributes to the whole in terms performance, responsibility, budget, schedule.  List the vendors and sub contractors associated with specific tasks.  Documentation of that all parties have signed-off on their various commitments to the projects.  Any specifications for any work package, establish account numbers, specify hardware/software to be used, and identify resource needs.  The basis for making cost estimates.
  • 31.
    Procedure for designingand using the WBS 1. Using information from the action plan, list the task breakdown in successively finer levels of detail. Continue until all meaningful tasks or work packages have been identified and each task can be individually planned, budgeted, scheduled, monitored, and controlled. 2. For each work package, identify the data relevant to the WBS. List the personnel and organizations responsible for each task.
  • 32.
    Cont. It is helpfulto construct a linear responsibility chart (sometimes called a responsibility matrix) to show who is responsible for what. This chart also shows critical interfaces between units that may require special managerial coordination. With it, the PM can keep track of who must approve what and who must report to whom.
  • 33.
    Linear Responsibility Chart Legend: Responsible  Support  Notification  Approval
  • 34.
    Subproject Task Project Manager Contract Admin. Project Eng. Industrial Eng. Determine Need A1 A2       Solicit Quotations B1     Write Approp. Request C1     C2    C3     “ “ “ “ “ “ WBS Responsibility Project Office Field Oper. Field Manager
  • 35.
  • 36.
    Vice-president General manager Project manager Manager engineering Manager software Manager manfrg Manager mrktg Subprogram manager mafrg Subprogram Manager software Subprogram Manager hardware Subprogram Manager services Establish project plan6 2 1 3 3 3 3 4 4 4 4 Define WBS 5 1 3 3 3 3 3 3 3 3 Establish hardware specs 2 3 1 4 4 4 Establish software specs 2 3 4 1 4 Establish interface specs 2 3 1 4 4 4 Establish manufacturing specs 2 3 4 4 1 4 Define documentation 2 1 4 4 4 4 1 Actual responsibility, 2 General supervision, 3 Must be consulted, 4 May be consulted, 5 Must be noted, 6 Final Approach
  • 37.
    Vice-president General manager Project manager Manager engineering Manager software Manager manfrg Manager mrktg Subprogram manager mafrg Subprogram Manager software Subprogram Manager hardware Subprogram Manager services Establish project plan6 2 1 3 3 3 3 4 4 4 4 Define WBS 5 1 3 3 3 3 3 3 3 3 Establish hardware specs 2 3 1 4 4 4 Establish software specs 2 3 4 1 4 Establish interface specs 2 3 1 4 4 4 Establish manufacturing specs 2 3 4 4 1 4 Define documentation 2 1 4 4 4 4 1 Actual responsibility, 2 General supervision, 3 Must be consulted, 4 May be consulted, 5 Must be noted, 6 Final Approach
  • 38.
    Verbal Responsibility Chart Legend: IA,ILI, IHI: Product lines LOB: Line of business MC: Management committee M-A Cttee: Marketing administration committee S&S: Sales and service MP&R: Marketing planning and research
  • 39.
    Clear Action with Activities Responsible Individuals Workwith Initiate Action Distribution System And its Administration 1. Recommend distribution system to be used. Mktg Officer Mktg Officer Mktg Officer LIL & IHI LOB MCs M-A Cttee VP & Agcy Dir Group LOB MC M-A Cttee VP & Agcy Dir IA LOB MC M-A Cttee VP & Agcy Dir Sr VP Mktg Sr VP Mktg Sr VP Mktg Compensation 2. Determine provisions of sales compensation programs (e.g., commissions, subsidies, fringes). 3. Ensure cost-effectiveness testing of sales compensation programs. Compensation Task Force Compensation Task Force Compensation Task Force Compensation Task Force Mktg, S&S & Eqty Prod Offrs Mktg, S&S & Eqty Prod Offrs Mktg, S&S & Eqty Prod Offrs Mktg, S&S & Eqty Prod Offrs President President President Territory 4. Establish territorial strategy for our primary distribution system. VP & Agcy Dir Dir MP&R M-A Cttee Sr VP Mktg
  • 40.
    Clear Action with Activities Responsible Individuals Workwith Initiate Action Territory 5. Determine territories for agency locations and establish priorities for standing. 6. Determine agencies in Which advanced sales personnel Are to operate. VP & Agcy Dir Dir Ret Pln Sls Dir Adv Sls Dir MP&R M-A Cttee VP S&S Sr VP Mktg Sr VP Mktg