Downloaded 7,372 times
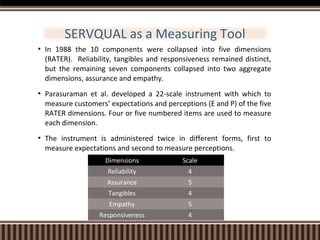

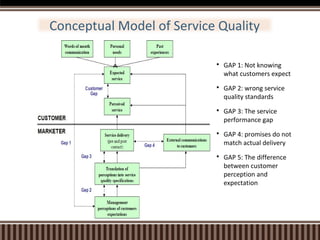


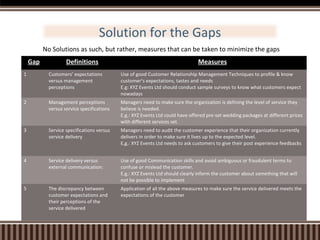
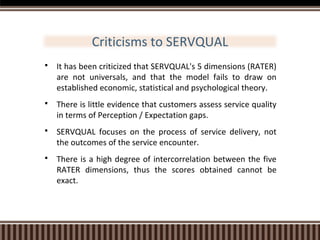
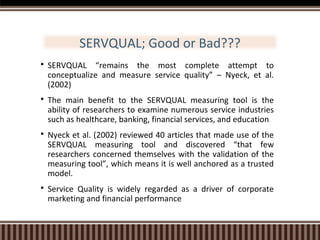
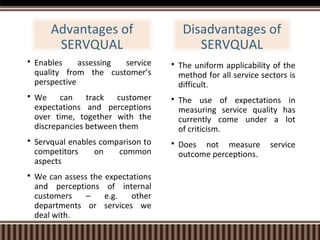


This document discusses the SERVQUAL model, which is a framework for measuring service quality. It was developed in the 1980s and measures service quality across five dimensions: reliability, assurance, tangibles, empathy, and responsiveness. The document explains the five gaps in service quality as identified by the SERVQUAL model and provides examples. It also discusses criticisms of the model and how organizations can use it to measure customer expectations and perceptions over time to improve service quality.


