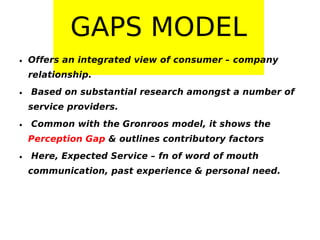
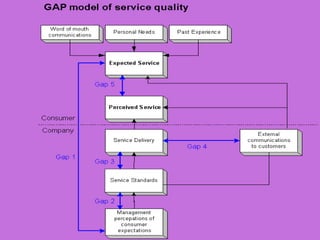
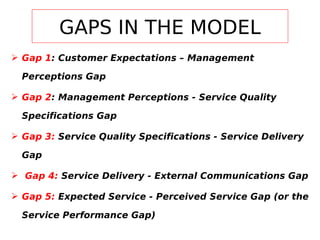
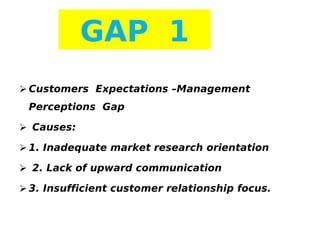
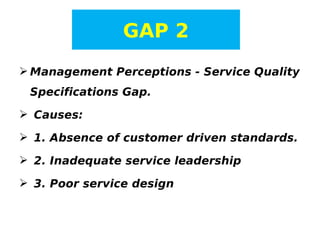
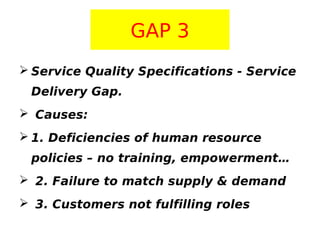
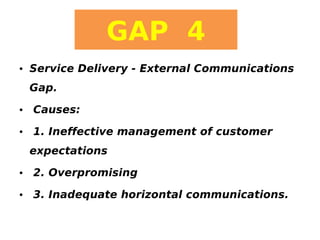
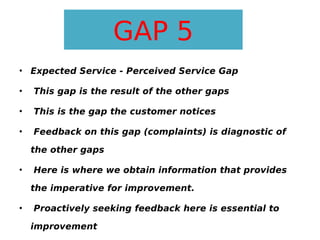
SERVICE QUALITY
MODEL
BY , GROUP 6
RASHMI.S
SHILPI ADHIKARY
SISIRA.S. SASI
RAHUL SHARMA
ABHILASH IYYAPAN
Facts !!!!!


Subject of study since 1980’s.

 Service quality is a challenging topic in contemporary
quality management theory & practice..


3 consistent findings:

 1. service quality is more difficult for the consumer to
evaluate than product quality;
 2.service quality perceptions result from a comparison of
consumer expectations with actual service performance;


3. quality evaluations are not based solely on the outcome
of a service but also involve evaluation of the delivery
process.
SERVICE
DIMENSIONS
 Reliability
 Responsiveness
 Competence
 Access
 Courtesy
 Communication
 Credibility
 Security
 Understanding/Knowing the customer
 Tangibles
SERVICE QUALITY
GAPS MODEL
GAPS MODEL
• Offers an integrated view of consumer – company
relationship.
• Based on substantial research amongst a number of
service providers.
• Common with the Gronroos model, it shows the
Perception Gap & outlines contributory factors
• Here, Expected Service – fn of word of mouth
communication, past experience & personal need.
• Perceived service – product of service delivery
& external communication to consumers.
• However the GAP model goes further in its
analysis of the key contributory factors.
• It provides a more rigorous description of the
contributory Gaps & lists key drivers for each
gap and generic breakdown of each of these
drivers.
GAPS IN THE MODEL
 Gap 1: Customer Expectations – Management
Perceptions Gap
 Gap 2: Management Perceptions - Service Quality
Specifications Gap
 Gap 3: Service Quality Specifications - Service Delivery
Gap
 Gap 4: Service Delivery - External Communications Gap
 Gap 5: Expected Service - Perceived Service Gap (or the
Service Performance Gap)
GAP 1
 Customers Expectations –Management
Perceptions Gap
 Causes:
 1. Inadequate market research orientation
 2. Lack of upward communication
 3. Insufficient customer relationship focus.
PREVENTION
MEASURES
 Collect Data On Customer Expectations
 Relate Customer Data To Overall Service Strategy
 Increase Management Contact With Customers
 Increase Internal Communications
 Track Performance On Satisfaction
GAP 2
 Management Perceptions - Service Quality
Specifications Gap.
 Causes:
 1. Absence of customer driven standards.
 2. Inadequate service leadership
 3. Poor service design
PREVENTION
MEASURES
 Leadership commitment
 “Can’t be done” - create possibilities
 Standardize tasks
 Goal setting - based on service goals
GAP 3
 Service Quality Specifications - Service
Delivery Gap.
 Causes:
 1. Deficiencies of human resource
policies – no training, empowerment…
 2. Failure to match supply & demand
 3. Customers not fulfilling roles
CONTD….
 Provide data on performance, on definition of standards
for excellent service
 Provide opportunity to change and to grow
 Provide training - educate employees about customers
 Harmonise roles - define in customer service terms
 Develop team environment - work together
 Empower people to solve problems
 Provide support to employees to create high performance
service
GAP 4
• Service Delivery - External Communications
Gap.
• Causes:
• 1. Ineffective management of customer
expectations
• 2. Overpromising
• 3. Inadequate horizontal communications.
CONTD…..
 Break down barriers between departments
 Communicate freely
 Understand and mentor internal customers
 Standardize and communicate policies and procedures
 Communicate standards, policies and procedures to
 Customers
 Emphasise primary characteristics
 Manage customer expectations
GAP 5
• Expected Service - Perceived Service Gap
•

This gap is the result of the other gaps

•

This is the gap the customer notices

•

Feedback on this gap (complaints) is diagnostic of
the other gaps

•

Here is where we obtain information that provides
the imperative for improvement.

•

Proactively seeking feedback here is essential to
improvement
THANK YOU

24909960 service-quality-model

  • 1.
    SERVICE QUALITY MODEL BY ,GROUP 6 RASHMI.S SHILPI ADHIKARY SISIRA.S. SASI RAHUL SHARMA ABHILASH IYYAPAN
  • 3.
    Facts !!!!!  Subject ofstudy since 1980’s.  Service quality is a challenging topic in contemporary quality management theory & practice..  3 consistent findings:  1. service quality is more difficult for the consumer to evaluate than product quality;  2.service quality perceptions result from a comparison of consumer expectations with actual service performance;  3. quality evaluations are not based solely on the outcome of a service but also involve evaluation of the delivery process.
  • 4.
    SERVICE DIMENSIONS  Reliability  Responsiveness Competence  Access  Courtesy  Communication  Credibility  Security  Understanding/Knowing the customer  Tangibles
  • 5.
  • 6.
    GAPS MODEL • Offersan integrated view of consumer – company relationship. • Based on substantial research amongst a number of service providers. • Common with the Gronroos model, it shows the Perception Gap & outlines contributory factors • Here, Expected Service – fn of word of mouth communication, past experience & personal need.
  • 7.
    • Perceived service– product of service delivery & external communication to consumers. • However the GAP model goes further in its analysis of the key contributory factors. • It provides a more rigorous description of the contributory Gaps & lists key drivers for each gap and generic breakdown of each of these drivers.
  • 9.
    GAPS IN THEMODEL  Gap 1: Customer Expectations – Management Perceptions Gap  Gap 2: Management Perceptions - Service Quality Specifications Gap  Gap 3: Service Quality Specifications - Service Delivery Gap  Gap 4: Service Delivery - External Communications Gap  Gap 5: Expected Service - Perceived Service Gap (or the Service Performance Gap)
  • 10.
    GAP 1  CustomersExpectations –Management Perceptions Gap  Causes:  1. Inadequate market research orientation  2. Lack of upward communication  3. Insufficient customer relationship focus.
  • 11.
    PREVENTION MEASURES  Collect DataOn Customer Expectations  Relate Customer Data To Overall Service Strategy  Increase Management Contact With Customers  Increase Internal Communications  Track Performance On Satisfaction
  • 12.
    GAP 2  ManagementPerceptions - Service Quality Specifications Gap.  Causes:  1. Absence of customer driven standards.  2. Inadequate service leadership  3. Poor service design
  • 13.
    PREVENTION MEASURES  Leadership commitment “Can’t be done” - create possibilities  Standardize tasks  Goal setting - based on service goals
  • 14.
    GAP 3  ServiceQuality Specifications - Service Delivery Gap.  Causes:  1. Deficiencies of human resource policies – no training, empowerment…  2. Failure to match supply & demand  3. Customers not fulfilling roles
  • 15.
    CONTD….  Provide dataon performance, on definition of standards for excellent service  Provide opportunity to change and to grow  Provide training - educate employees about customers  Harmonise roles - define in customer service terms  Develop team environment - work together  Empower people to solve problems  Provide support to employees to create high performance service
  • 16.
    GAP 4 • ServiceDelivery - External Communications Gap. • Causes: • 1. Ineffective management of customer expectations • 2. Overpromising • 3. Inadequate horizontal communications.
  • 17.
    CONTD…..  Break downbarriers between departments  Communicate freely  Understand and mentor internal customers  Standardize and communicate policies and procedures  Communicate standards, policies and procedures to  Customers  Emphasise primary characteristics  Manage customer expectations
  • 18.
    GAP 5 • ExpectedService - Perceived Service Gap • This gap is the result of the other gaps • This is the gap the customer notices • Feedback on this gap (complaints) is diagnostic of the other gaps • Here is where we obtain information that provides the imperative for improvement. • Proactively seeking feedback here is essential to improvement
  • 19.