More Related Content
Similar to Philadelphia Housing Market Trends
Similar to Philadelphia Housing Market Trends (17)
More from Prudential Fox & Roach, Realtors
More from Prudential Fox & Roach, Realtors (20)
Philadelphia Housing Market Trends
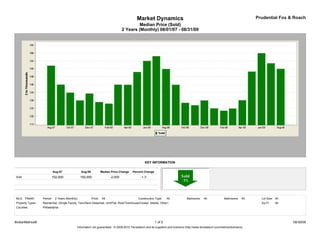
- 1. Market Dynamics Prudential Fox & Roach
Median Price (Sold)
2 Years (Monthly) 08/01/07 - 08/31/09
KEY INFORMATION
Aug-07 Aug-09 Median Price Change Percent Change
Sold 152,000 150,000 -2,000 -1.3
MLS: TReND Period: 2 Years (Monthly) Price: All Construction Type: All Bedrooms: All Bathrooms: All Lot Size: All
Property Types: Residential: (Single Family, Twin/Semi-Detached, Unit/Flat, Row/Townhouse/Cluster, Mobile, Other) Sq Ft: All
Counties: Philadelphia
BrokerMetrics® 1 of 2 09/30/09
Information not guaranteed. © 2009-2010 Terradatum and its suppliers and licensors (http://www.terradatum.com/metrics/licensors).
- 2. Market Dynamics Prudential Fox & Roach
Median Price (Sold)
2 Years (Monthly) 08/01/07 - 08/31/09
FOR SALE UNDER CONTRACT SOLD EXPIRED NEW LISTINGS
Time Period Median $ # Properties Median $ # Properties Median $ # Properties Median $ # Properties Median $ # Properties
Aug-09 144,900 11,263 149,900 1,089 150,000 1,117 139,400 1,214 135,000 2,013
Jul-09 149,000 11,704 149,900 1,127 153,500 1,130 145,000 1,327 139,900 2,077
Jun-09 149,900 12,135 152,500 1,136 159,900 1,105 149,900 1,372 149,900 2,383
May-09 150,000 12,128 160,000 1,091 148,250 1,034 148,999 1,285 149,000 2,277
Apr-09 152,000 12,014 167,950 1,110 130,150 892 144,500 1,053 159,900 2,340
Mar-09 149,900 11,953 139,900 1,052 124,900 801 139,900 1,227 154,975 2,349
Feb-09 145,000 11,395 134,900 806 123,500 624 139,900 985 142,500 2,089
Jan-09 149,900 11,234 139,900 728 125,000 633 159,000 1,200 134,450 1,986
Dec-08 149,900 11,391 129,900 648 130,000 783 140,000 1,495 129,900 1,366
Nov-08 149,900 11,837 129,900 717 127,000 755 155,000 1,095 139,900 1,706
Oct-08 149,900 12,365 129,900 755 128,500 931 139,900 1,479 139,900 2,034
Sep-08 149,900 12,832 134,900 935 139,900 1,021 159,000 1,566 154,900 2,647
Aug-08 149,900 12,751 140,450 1,004 149,900 1,164 149,900 1,562 135,000 2,280
Jul-08 152,000 13,073 149,900 1,092 158,000 1,208 158,500 1,511 145,000 2,704
Jun-08 154,999 12,988 152,825 1,132 155,000 1,277 154,400 1,486 150,000 2,627
May-08 154,900 13,077 159,900 1,196 148,000 1,221 149,900 1,347 154,900 2,524
Apr-08 155,000 13,174 159,900 1,271 139,900 1,135 150,000 1,517 159,900 3,012
Mar-08 152,000 12,849 145,000 1,241 140,000 1,077 149,000 1,591 159,000 2,881
Feb-08 149,900 12,504 149,000 1,121 128,000 892 143,900 1,411 146,500 2,489
Jan-08 149,900 12,600 139,900 1,015 129,000 879 164,900 1,544 149,900 2,867
Dec-07 149,900 12,385 130,900 759 134,400 1,060 149,000 1,870 129,900 1,630
Nov-07 149,900 13,247 130,000 1,013 130,000 1,095 151,000 1,474 139,900 2,231
Oct-07 149,900 14,062 129,900 1,211 134,950 1,172 155,000 1,816 139,900 3,023
Sep-07 155,000 13,873 140,000 1,032 140,000 1,115 164,900 1,792 149,900 3,018
Aug-07 154,900 13,653 142,000 1,184 152,000 1,521 149,900 1,601 140,000 2,941
BrokerMetrics® 2 of 2 09/30/09
Information not guaranteed. © 2009-2010 Terradatum and its suppliers and licensors (http://www.terradatum.com/metrics/licensors).