More Related Content
Similar to July 2010 Chester County Basic Supply and Demand
Similar to July 2010 Chester County Basic Supply and Demand (15)
More from Prudential Fox & Roach, Realtors
More from Prudential Fox & Roach, Realtors (20)
July 2010 Chester County Basic Supply and Demand
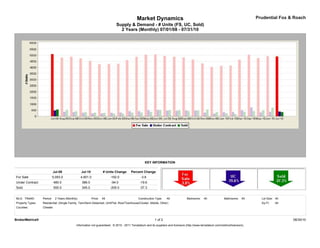
- 1. Market Dynamics Prudential Fox & Roach
Supply & Demand - # Units (FS, UC, Sold)
2 Years (Monthly) 07/01/08 - 07/31/10
KEY INFORMATION
Jul-08 Jul-10 # Units Change Percent Change
For Sale 5,093.0 4,901.0 -192.0 -3.8
Under Contract 480.0 386.0 -94.0 -19.6
Sold 550.0 345.0 -205.0 -37.3
MLS: TReND Period: 2 Years (Monthly) Price: All Construction Type: All Bedrooms: All Bathrooms: All Lot Size: All
Property Types: Residential: (Single Family, Twin/Semi-Detached, Unit/Flat, Row/Townhouse/Cluster, Mobile, Other) Sq Ft: All
Counties: Chester
BrokerMetrics® 1 of 2 08/30/10
Information not guaranteed. © 2010 - 2011 Terradatum and its suppliers and licensors (http://www.terradatum.com/metrics/licensors).
- 2. Market Dynamics Prudential Fox & Roach
Supply & Demand - # Units (FS, UC, Sold)
2 Years (Monthly) 07/01/08 - 07/31/10
FOR SALE UNDER CONTRACT SOLD EXPIRED NEW LISTINGS
Time Period # Properties Average DOM # Properties Average DOM # Properties Average DOM # Properties Average DOM # Properties
Jul-10 4,901 149 386 88 345 87 459 181 779
Jun-10 4,924 149 371 95 701 79 431 214 842
May-10 4,771 148 320 73 482 76 369 209 861
Apr-10 5,045 147 730 80 420 90 405 254 1,270
Mar-10 4,628 161 506 87 367 89 347 223 1,088
Feb-10 4,158 175 365 85 197 103 253 261 693
Jan-10 4,128 178 334 99 248 87 329 219 791
Dec-09 4,046 185 225 91 341 86 484 203 400
Nov-09 4,326 171 308 78 555 81 372 207 567
Oct-09 4,648 162 476 84 478 82 413 206 748
Sep-09 4,820 158 479 81 430 91 441 207 803
Aug-09 4,877 155 448 81 507 76 412 198 804
Jul-09 4,945 151 471 83 511 79 401 193 837
Jun-09 5,081 148 529 85 530 84 444 194 911
May-09 5,054 148 508 81 366 92 376 224 973
Apr-09 4,865 150 420 86 317 102 364 197 1,015
Mar-09 4,604 157 413 99 297 104 341 217 936
Feb-09 4,311 165 318 94 238 91 325 229 745
Jan-09 4,290 169 290 106 225 92 434 190 707
Dec-08 4,273 168 239 96 282 87 451 186 403
Nov-08 4,541 153 246 85 305 86 425 174 518
Oct-08 4,747 144 293 81 343 79 431 186 719
Sep-08 4,879 137 349 79 411 73 502 172 907
Aug-08 4,810 136 371 76 521 76 467 158 714
Jul-08 5,093 128 480 77 550 69 517 169 889
BrokerMetrics® 2 of 2 08/30/10
Information not guaranteed. © 2010 - 2011 Terradatum and its suppliers and licensors (http://www.terradatum.com/metrics/licensors).