SlideShare a Scribd company logo
1 of 2
Download to read offline
Market Dynamics                                                                         Prudential Fox & Roach
                                                                             Supply & Demand - # Units (FS, UC, Sold)
                                                                               2 Years (Monthly) 02/01/08 - 02/28/10


                                                                                                  KEY INFORMATION

                            Feb-08               Feb-10            # Units Change      Percent Change
For Sale                    12,670               10,549                  -2,121               -16.7
Under Contract              1,121                 993                    -128                 -11.4
Sold                         894                  614                    -280                 -31.3


MLS: TReND        Period:    2 Years (Monthly)            Price:   All                       Construction Type:    All             Bedrooms:    All             Bathrooms:    All     Lot Size: All
Property Types:   Residential: (Single Family, Twin/Semi-Detached, Unit/Flat, Row/Townhouse/Cluster, Mobile, Other)                                                                   Sq Ft:    All
Counties:         Philadelphia


BrokerMetrics®                                                                                            1 of 2                                                                                      03/28/10
                                             Information not guaranteed. © 2010 - 2011 Terradatum and its suppliers and licensors (http://www.terradatum.com/metrics/licensors).
Market Dynamics                                                                              Prudential Fox & Roach
                                                                 Supply & Demand - # Units (FS, UC, Sold)
                                                                   2 Years (Monthly) 02/01/08 - 02/28/10


                       FOR SALE                       UNDER CONTRACT                                   SOLD                                   EXPIRED                           NEW LISTINGS
 Time Period     # Properties Average DOM           # Properties Average DOM                  # Properties  Average DOM                 # Properties Average DOM                        # Properties
Feb-10               10,549            172                   993                   80                   614                  82                 1,008                   185                   1,752
Jan-10               10,753            189                   852                   80                   670                  72                 1,104                   183                   2,302
Dec-09               10,727            212                   721                   74                   875                  73                 1,555                   198                   1,346
Nov-09               11,139            216                   810                   71                1,328                   74                   948                   181                   1,681
Oct-09               11,792            216                 1,222                   73                1,141                   73                 1,112                   182                   2,268
Sep-09               11,944            222                 1,263                   75                1,032                   72                 1,157                   197                   2,326
Aug-09               11,781            230                 1,053                   78                1,136                   75                 1,110                   189                   2,042
Jul-09               12,067            233                 1,098                   73                1,131                   76                 1,230                   190                   2,086
Jun-09               12,403            235                 1,119                   73                1,111                   83                 1,303                   197                   2,393
May-09               12,336            240                 1,092                   82                1,039                   75                 1,234                   183                   2,286
Apr-09               12,175            240                 1,102                   77                   895                  82                 1,023                   180                   2,347
Mar-09               12,066            242                 1,042                   77                   803                  83                 1,196                   184                   2,352
Feb-09               11,476            250                   799                   84                   629                  75                   963                   181                   2,088
Jan-09               11,299            254                   724                   83                   635                  80                 1,187                   185                   1,993
Dec-08               11,445            256                   648                   78                   784                  75                 1,491                   187                   1,368
Nov-08               11,886            249                   717                   69                   755                  71                 1,092                   159                   1,709
Oct-08               12,404            241                   752                   72                   933                  64                 1,475                   158                   2,035
Sep-08               12,869            235                   933                   68                1,021                   68                 1,567                   172                   2,647
Aug-08               12,787            231                 1,003                   72                1,165                   70                 1,562                   166                   2,281
Jul-08               13,110            226                 1,092                   68                1,208                   68                 1,512                   173                   2,703
Jun-08               13,026            227                 1,132                   69                1,277                   67                 1,487                   187                   2,627
May-08               12,939            222                 1,193                   67                1,223                   74                 1,347                   151                   2,524
Apr-08               13,201            217                 1,268                   73                1,136                   76                 1,518                   153                   3,012
Mar-08               13,018            216                 1,238                   74                1,076                   77                 1,591                   154                   2,881
Feb-08               12,670            222                 1,121                   73                   894                  74                 1,412                   193                   2,489


BrokerMetrics®                                                                                 2 of 2                                                                                                  03/28/10
                                  Information not guaranteed. © 2010 - 2011 Terradatum and its suppliers and licensors (http://www.terradatum.com/metrics/licensors).

More Related Content

What's hot

1 1 09 Supply And Demand Listings
1 1 09 Supply And Demand Listings1 1 09 Supply And Demand Listings
1 1 09 Supply And Demand Listings
tjovanovski
 
1 1 09 Months Supply Of Inventory
1 1 09 Months Supply Of Inventory1 1 09 Months Supply Of Inventory
1 1 09 Months Supply Of Inventory
tjovanovski
 

What's hot (15)

July 2010 Philadelphia County Basic Supply And Demand
July 2010 Philadelphia County Basic Supply And DemandJuly 2010 Philadelphia County Basic Supply And Demand
July 2010 Philadelphia County Basic Supply And Demand
 
1 1 09 Supply And Demand Listings
1 1 09 Supply And Demand Listings1 1 09 Supply And Demand Listings
1 1 09 Supply And Demand Listings
 
December 2009 Philadelphia County Msi And Avg Dom
December 2009 Philadelphia County Msi And Avg DomDecember 2009 Philadelphia County Msi And Avg Dom
December 2009 Philadelphia County Msi And Avg Dom
 
January 2010 Philadelphia County Msi And Avg Dom
January 2010 Philadelphia County Msi And Avg DomJanuary 2010 Philadelphia County Msi And Avg Dom
January 2010 Philadelphia County Msi And Avg Dom
 
December 2009 Delaware County Basic Supply And Demand
December 2009 Delaware County Basic Supply And DemandDecember 2009 Delaware County Basic Supply And Demand
December 2009 Delaware County Basic Supply And Demand
 
1 1 09 Months Supply Of Inventory
1 1 09 Months Supply Of Inventory1 1 09 Months Supply Of Inventory
1 1 09 Months Supply Of Inventory
 
Montgomery county basic supply and demand
Montgomery county basic supply and demandMontgomery county basic supply and demand
Montgomery county basic supply and demand
 
January Bucks County MSI And Avg Dom
January Bucks County MSI And Avg DomJanuary Bucks County MSI And Avg Dom
January Bucks County MSI And Avg Dom
 
Montgomery County Basic Supply And Demand
Montgomery County Basic Supply And DemandMontgomery County Basic Supply And Demand
Montgomery County Basic Supply And Demand
 
Montgomery county basic supply and demand
Montgomery county basic supply and demandMontgomery county basic supply and demand
Montgomery county basic supply and demand
 
December 2009 Chester County Msi And Avg Dom
December 2009 Chester County Msi And Avg DomDecember 2009 Chester County Msi And Avg Dom
December 2009 Chester County Msi And Avg Dom
 
July 2009 Bucks County MSI And Avg Dom
July 2009 Bucks County MSI And Avg DomJuly 2009 Bucks County MSI And Avg Dom
July 2009 Bucks County MSI And Avg Dom
 
December 2009 Chester County Basic Supply And Demand
December 2009 Chester County Basic Supply And DemandDecember 2009 Chester County Basic Supply And Demand
December 2009 Chester County Basic Supply And Demand
 
December 2009 Delaware County Msi And Avg Dom
December 2009 Delaware County Msi And Avg DomDecember 2009 Delaware County Msi And Avg Dom
December 2009 Delaware County Msi And Avg Dom
 
January 2010 Chester County Basic Supply And Demand
January 2010 Chester County Basic Supply And DemandJanuary 2010 Chester County Basic Supply And Demand
January 2010 Chester County Basic Supply And Demand
 

Similar to 2010 February Philadelphia County Basic Supply And Demand

Similar to 2010 February Philadelphia County Basic Supply And Demand (20)

Philadelphia County Basic Supply and Demand
Philadelphia County Basic Supply and DemandPhiladelphia County Basic Supply and Demand
Philadelphia County Basic Supply and Demand
 
Philadelphia county basic supply and demand
Philadelphia county basic supply and demandPhiladelphia county basic supply and demand
Philadelphia county basic supply and demand
 
September 2010 Montgomery County Basic Supply And Demand
September 2010 Montgomery County Basic Supply And DemandSeptember 2010 Montgomery County Basic Supply And Demand
September 2010 Montgomery County Basic Supply And Demand
 
Philadelphia County MSI And Avg Dom
Philadelphia County MSI And Avg DomPhiladelphia County MSI And Avg Dom
Philadelphia County MSI And Avg Dom
 
Philadelphia County MSI And Avg Dom
Philadelphia County MSI And Avg DomPhiladelphia County MSI And Avg Dom
Philadelphia County MSI And Avg Dom
 
December 2009 Montgomery County Basic Supply And Demand
December 2009 Montgomery County Basic Supply And DemandDecember 2009 Montgomery County Basic Supply And Demand
December 2009 Montgomery County Basic Supply And Demand
 
2010 February Chester County Basic Supply And Demand
2010 February Chester County Basic Supply And Demand2010 February Chester County Basic Supply And Demand
2010 February Chester County Basic Supply And Demand
 
January 2010 Chester County Msi And Avg Dom
January 2010 Chester County Msi And Avg DomJanuary 2010 Chester County Msi And Avg Dom
January 2010 Chester County Msi And Avg Dom
 
January 2010 Chester County M S I And Avg D O M
January 2010 Chester  County  M S I And  Avg  D O MJanuary 2010 Chester  County  M S I And  Avg  D O M
January 2010 Chester County M S I And Avg D O M
 
December 2009 Bucks County MSI And Avg Dom
December 2009 Bucks County MSI And Avg DomDecember 2009 Bucks County MSI And Avg Dom
December 2009 Bucks County MSI And Avg Dom
 
May 2010 Philadelphia County MSI And Avg Days on Market
May 2010 Philadelphia County MSI And Avg Days on Market May 2010 Philadelphia County MSI And Avg Days on Market
May 2010 Philadelphia County MSI And Avg Days on Market
 
January 2010 Chester County Basic Supply And Demand
January 2010 Chester  County  Basic  Supply And  DemandJanuary 2010 Chester  County  Basic  Supply And  Demand
January 2010 Chester County Basic Supply And Demand
 
July 2009 Philadelphia County Msi And Avg Dom
July 2009 Philadelphia County Msi And Avg DomJuly 2009 Philadelphia County Msi And Avg Dom
July 2009 Philadelphia County Msi And Avg Dom
 
Montgomery County Basic Supply And Demand
Montgomery County Basic Supply And DemandMontgomery County Basic Supply And Demand
Montgomery County Basic Supply And Demand
 
Delaware county basic supply and demand
Delaware county basic supply and demandDelaware county basic supply and demand
Delaware county basic supply and demand
 
December 2009 Philadelphia County Sold Median Price
December 2009 Philadelphia County Sold Median PriceDecember 2009 Philadelphia County Sold Median Price
December 2009 Philadelphia County Sold Median Price
 
Chester County MSI And Avg Dom
Chester County MSI And Avg DomChester County MSI And Avg Dom
Chester County MSI And Avg Dom
 
2010 February Philadelphia County Sold Median Price
2010 February Philadelphia County Sold Median Price2010 February Philadelphia County Sold Median Price
2010 February Philadelphia County Sold Median Price
 
2010 February Bucks County Basic Supply And Demand
2010 February Bucks County Basic Supply And Demand2010 February Bucks County Basic Supply And Demand
2010 February Bucks County Basic Supply And Demand
 
Philadelphia County Sold Median Price Analysis
Philadelphia County Sold Median Price AnalysisPhiladelphia County Sold Median Price Analysis
Philadelphia County Sold Median Price Analysis
 

More from Prudential Fox & Roach, Realtors

September 2010 Montgomery County Month Supply of Inventory and Average Days o...
September 2010 Montgomery County Month Supply of Inventory and Average Days o...September 2010 Montgomery County Month Supply of Inventory and Average Days o...
September 2010 Montgomery County Month Supply of Inventory and Average Days o...
Prudential Fox & Roach, Realtors
 
July 2010 Montgomery County Month Supply of Inventory and Average Days on Market
July 2010 Montgomery County Month Supply of Inventory and Average Days on MarketJuly 2010 Montgomery County Month Supply of Inventory and Average Days on Market
July 2010 Montgomery County Month Supply of Inventory and Average Days on Market
Prudential Fox & Roach, Realtors
 

More from Prudential Fox & Roach, Realtors (20)

Bucks county market share
Bucks county market shareBucks county market share
Bucks county market share
 
Bucks county market share
Bucks county market shareBucks county market share
Bucks county market share
 
Bucks county market share
Bucks county market shareBucks county market share
Bucks county market share
 
September 2010 Bucks County Market Share
September 2010 Bucks County Market ShareSeptember 2010 Bucks County Market Share
September 2010 Bucks County Market Share
 
Bucks County Basic Supply and Demand
Bucks County Basic Supply and DemandBucks County Basic Supply and Demand
Bucks County Basic Supply and Demand
 
Montgomery county sold median price
Montgomery county sold median priceMontgomery county sold median price
Montgomery county sold median price
 
September 2010 Montgomery County Month Supply of Inventory and Average Days o...
September 2010 Montgomery County Month Supply of Inventory and Average Days o...September 2010 Montgomery County Month Supply of Inventory and Average Days o...
September 2010 Montgomery County Month Supply of Inventory and Average Days o...
 
September 2010 Montgomery county Market Share
September 2010 Montgomery county Market ShareSeptember 2010 Montgomery county Market Share
September 2010 Montgomery county Market Share
 
September 2010 Montgomery County Sold Median Price
September 2010 Montgomery County Sold Median PriceSeptember 2010 Montgomery County Sold Median Price
September 2010 Montgomery County Sold Median Price
 
July 2010 Philadelphia County Market Share
July 2010 Philadelphia County Market ShareJuly 2010 Philadelphia County Market Share
July 2010 Philadelphia County Market Share
 
July 2010 Montgomery County Month Supply of Inventory and Average Days on Market
July 2010 Montgomery County Month Supply of Inventory and Average Days on MarketJuly 2010 Montgomery County Month Supply of Inventory and Average Days on Market
July 2010 Montgomery County Month Supply of Inventory and Average Days on Market
 
July 2010 Montgomery County Sold Median Price
July 2010 Montgomery County Sold Median PriceJuly 2010 Montgomery County Sold Median Price
July 2010 Montgomery County Sold Median Price
 
July 2010 Montgomery County Basic Supply and Demand
July 2010 Montgomery County Basic Supply and DemandJuly 2010 Montgomery County Basic Supply and Demand
July 2010 Montgomery County Basic Supply and Demand
 
July 2010 Montgomery County Market Share
July 2010 Montgomery County Market ShareJuly 2010 Montgomery County Market Share
July 2010 Montgomery County Market Share
 
Philadelphia county sold median price
Philadelphia county sold median pricePhiladelphia county sold median price
Philadelphia county sold median price
 
Montgomery county msi and avg dom
Montgomery county msi and avg domMontgomery county msi and avg dom
Montgomery county msi and avg dom
 
Montgomery county market share
Montgomery county market shareMontgomery county market share
Montgomery county market share
 
Montgomery county sold median price
Montgomery county sold median priceMontgomery county sold median price
Montgomery county sold median price
 
Delaware county msi and avg dom
Delaware county msi and avg domDelaware county msi and avg dom
Delaware county msi and avg dom
 
Delaware county market share
Delaware county market shareDelaware county market share
Delaware county market share
 

Recently uploaded

The Superior Living Batisehir - Listing Turkey
The Superior Living Batisehir - Listing TurkeyThe Superior Living Batisehir - Listing Turkey
The Superior Living Batisehir - Listing Turkey
Listing Turkey
 
MEQ Mainstreet Equity Corp Q2 2024 Investor Presentation
MEQ Mainstreet Equity Corp Q2 2024 Investor PresentationMEQ Mainstreet Equity Corp Q2 2024 Investor Presentation
MEQ Mainstreet Equity Corp Q2 2024 Investor Presentation
MEQ - Mainstreet Equity Corp.
 

Recently uploaded (20)

Vanam At Purva Soukhyam Guduvanchery.pdf.pdf
Vanam At Purva Soukhyam Guduvanchery.pdf.pdfVanam At Purva Soukhyam Guduvanchery.pdf.pdf
Vanam At Purva Soukhyam Guduvanchery.pdf.pdf
 
Kohinoor Viva Pixel Dhanori Pune Brochure.pdf
Kohinoor Viva Pixel Dhanori Pune Brochure.pdfKohinoor Viva Pixel Dhanori Pune Brochure.pdf
Kohinoor Viva Pixel Dhanori Pune Brochure.pdf
 
Madhugiri Boucher Managed Farmland (knx)
Madhugiri Boucher Managed Farmland (knx)Madhugiri Boucher Managed Farmland (knx)
Madhugiri Boucher Managed Farmland (knx)
 
Rohan Harita Tathawade Pune Brochure.pdf
Rohan Harita Tathawade Pune Brochure.pdfRohan Harita Tathawade Pune Brochure.pdf
Rohan Harita Tathawade Pune Brochure.pdf
 
Lodha Baner Flat In Pune E-Brochure.pdf
Lodha Baner Flat In Pune  E-Brochure.pdfLodha Baner Flat In Pune  E-Brochure.pdf
Lodha Baner Flat In Pune E-Brochure.pdf
 
Retail Space for Lease - 1221 W. Main St., Sun Prairie, WI
Retail Space for Lease - 1221 W. Main St., Sun Prairie, WIRetail Space for Lease - 1221 W. Main St., Sun Prairie, WI
Retail Space for Lease - 1221 W. Main St., Sun Prairie, WI
 
Lodha Baner Flat In Pune E-Brochure.pdf
Lodha Baner  Flat In Pune  E-Brochure.pdfLodha Baner  Flat In Pune  E-Brochure.pdf
Lodha Baner Flat In Pune E-Brochure.pdf
 
M3M Sector 72 Noida E-Brochure.pdf NEW.
M3M Sector 72 Noida  E-Brochure.pdf NEW.M3M Sector 72 Noida  E-Brochure.pdf NEW.
M3M Sector 72 Noida E-Brochure.pdf NEW.
 
The Superior Living Batisehir - Listing Turkey
The Superior Living Batisehir - Listing TurkeyThe Superior Living Batisehir - Listing Turkey
The Superior Living Batisehir - Listing Turkey
 
Yashone Eternitee Mann-Hinjawadi Pune | E-Brochure
Yashone Eternitee Mann-Hinjawadi Pune | E-BrochureYashone Eternitee Mann-Hinjawadi Pune | E-Brochure
Yashone Eternitee Mann-Hinjawadi Pune | E-Brochure
 
MEQ Mainstreet Equity Corp Q2 2024 Investor Presentation
MEQ Mainstreet Equity Corp Q2 2024 Investor PresentationMEQ Mainstreet Equity Corp Q2 2024 Investor Presentation
MEQ Mainstreet Equity Corp Q2 2024 Investor Presentation
 
Housing Price Regulation Thesis Defense by Slidesgo.pptx
Housing Price Regulation Thesis Defense by Slidesgo.pptxHousing Price Regulation Thesis Defense by Slidesgo.pptx
Housing Price Regulation Thesis Defense by Slidesgo.pptx
 
Bridge & Elliot Ladner Floor Plans May 2024.pdf
Bridge & Elliot Ladner Floor Plans May 2024.pdfBridge & Elliot Ladner Floor Plans May 2024.pdf
Bridge & Elliot Ladner Floor Plans May 2024.pdf
 
Explore Dual Citizenship in Africa | Citizenship Benefits & Requirements
Explore Dual Citizenship in Africa | Citizenship Benefits & RequirementsExplore Dual Citizenship in Africa | Citizenship Benefits & Requirements
Explore Dual Citizenship in Africa | Citizenship Benefits & Requirements
 
Are You Thinking About Buying a Home | KM Realty Group LLC
Are You Thinking About Buying a Home | KM Realty Group LLCAre You Thinking About Buying a Home | KM Realty Group LLC
Are You Thinking About Buying a Home | KM Realty Group LLC
 
A Guide to NRI Investment in India for Real Estate
A Guide to NRI Investment in India for Real EstateA Guide to NRI Investment in India for Real Estate
A Guide to NRI Investment in India for Real Estate
 
Kalpataru Exquisite Wakad Pune E-Brochure.pdf
Kalpataru Exquisite Wakad Pune  E-Brochure.pdfKalpataru Exquisite Wakad Pune  E-Brochure.pdf
Kalpataru Exquisite Wakad Pune E-Brochure.pdf
 
Unique NIBM Flat In Pune E-Brochure.pdf
Unique NIBM Flat In Pune  E-Brochure.pdfUnique NIBM Flat In Pune  E-Brochure.pdf
Unique NIBM Flat In Pune E-Brochure.pdf
 
Kohinoor Courtyard One Wakad Pune | Elegant Living Spaces
Kohinoor Courtyard One Wakad Pune | Elegant Living SpacesKohinoor Courtyard One Wakad Pune | Elegant Living Spaces
Kohinoor Courtyard One Wakad Pune | Elegant Living Spaces
 
SVN Live 5.13.24 Weekly Property Broadcast
SVN Live 5.13.24 Weekly Property BroadcastSVN Live 5.13.24 Weekly Property Broadcast
SVN Live 5.13.24 Weekly Property Broadcast
 

2010 February Philadelphia County Basic Supply And Demand

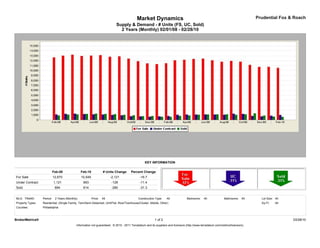
  • 1. Market Dynamics Prudential Fox & Roach Supply & Demand - # Units (FS, UC, Sold) 2 Years (Monthly) 02/01/08 - 02/28/10 KEY INFORMATION Feb-08 Feb-10 # Units Change Percent Change For Sale 12,670 10,549 -2,121 -16.7 Under Contract 1,121 993 -128 -11.4 Sold 894 614 -280 -31.3 MLS: TReND Period: 2 Years (Monthly) Price: All Construction Type: All Bedrooms: All Bathrooms: All Lot Size: All Property Types: Residential: (Single Family, Twin/Semi-Detached, Unit/Flat, Row/Townhouse/Cluster, Mobile, Other) Sq Ft: All Counties: Philadelphia BrokerMetrics® 1 of 2 03/28/10 Information not guaranteed. © 2010 - 2011 Terradatum and its suppliers and licensors (http://www.terradatum.com/metrics/licensors).
  • 2. Market Dynamics Prudential Fox & Roach Supply & Demand - # Units (FS, UC, Sold) 2 Years (Monthly) 02/01/08 - 02/28/10 FOR SALE UNDER CONTRACT SOLD EXPIRED NEW LISTINGS Time Period # Properties Average DOM # Properties Average DOM # Properties Average DOM # Properties Average DOM # Properties Feb-10 10,549 172 993 80 614 82 1,008 185 1,752 Jan-10 10,753 189 852 80 670 72 1,104 183 2,302 Dec-09 10,727 212 721 74 875 73 1,555 198 1,346 Nov-09 11,139 216 810 71 1,328 74 948 181 1,681 Oct-09 11,792 216 1,222 73 1,141 73 1,112 182 2,268 Sep-09 11,944 222 1,263 75 1,032 72 1,157 197 2,326 Aug-09 11,781 230 1,053 78 1,136 75 1,110 189 2,042 Jul-09 12,067 233 1,098 73 1,131 76 1,230 190 2,086 Jun-09 12,403 235 1,119 73 1,111 83 1,303 197 2,393 May-09 12,336 240 1,092 82 1,039 75 1,234 183 2,286 Apr-09 12,175 240 1,102 77 895 82 1,023 180 2,347 Mar-09 12,066 242 1,042 77 803 83 1,196 184 2,352 Feb-09 11,476 250 799 84 629 75 963 181 2,088 Jan-09 11,299 254 724 83 635 80 1,187 185 1,993 Dec-08 11,445 256 648 78 784 75 1,491 187 1,368 Nov-08 11,886 249 717 69 755 71 1,092 159 1,709 Oct-08 12,404 241 752 72 933 64 1,475 158 2,035 Sep-08 12,869 235 933 68 1,021 68 1,567 172 2,647 Aug-08 12,787 231 1,003 72 1,165 70 1,562 166 2,281 Jul-08 13,110 226 1,092 68 1,208 68 1,512 173 2,703 Jun-08 13,026 227 1,132 69 1,277 67 1,487 187 2,627 May-08 12,939 222 1,193 67 1,223 74 1,347 151 2,524 Apr-08 13,201 217 1,268 73 1,136 76 1,518 153 3,012 Mar-08 13,018 216 1,238 74 1,076 77 1,591 154 2,881 Feb-08 12,670 222 1,121 73 894 74 1,412 193 2,489 BrokerMetrics® 2 of 2 03/28/10 Information not guaranteed. © 2010 - 2011 Terradatum and its suppliers and licensors (http://www.terradatum.com/metrics/licensors).