More Related Content
Similar to Philadelphia County Basic Supply And Demand
Similar to Philadelphia County Basic Supply And Demand (20)
More from Prudential Fox & Roach, Realtors
More from Prudential Fox & Roach, Realtors (20)
Philadelphia County Basic Supply And Demand
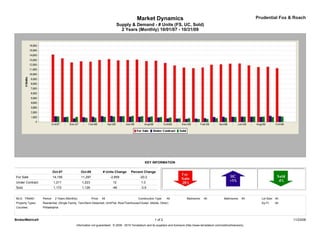
- 1. Market Dynamics Prudential Fox & Roach
Supply & Demand - # Units (FS, UC, Sold)
2 Years (Monthly) 10/01/07 - 10/31/09
KEY INFORMATION
Oct-07 Oct-09 # Units Change Percent Change
For Sale 14,156 11,297 -2,859 -20.2
Under Contract 1,211 1,223 12 1.0
Sold 1,172 1,126 -46 -3.9
MLS: TReND Period: 2 Years (Monthly) Price: All Construction Type: All Bedrooms: All Bathrooms: All Lot Size: All
Property Types: Residential: (Single Family, Twin/Semi-Detached, Unit/Flat, Row/Townhouse/Cluster, Mobile, Other) Sq Ft: All
Counties: Philadelphia
BrokerMetrics® 1 of 2 11/23/09
Information not guaranteed. © 2009 - 2010 Terradatum and its suppliers and licensors (http://www.terradatum.com/metrics/licensors).
- 2. Market Dynamics Prudential Fox & Roach
Supply & Demand - # Units (FS, UC, Sold)
2 Years (Monthly) 10/01/07 - 10/31/09
FOR SALE UNDER CONTRACT SOLD EXPIRED NEW LISTINGS
Time Period # Properties Average DOM # Properties Average DOM # Properties Average DOM # Properties Average DOM # Properties
Oct-09 11,297 157 1,223 73 1,126 73 1,223 178 2,239
Sep-09 11,594 176 1,297 75 1,032 72 1,239 194 2,306
Aug-09 11,524 193 1,064 77 1,127 75 1,172 187 2,028
Jul-09 11,889 203 1,121 74 1,135 76 1,272 189 2,081
Jun-09 12,279 211 1,130 73 1,108 83 1,341 197 2,386
May-09 12,241 220 1,091 82 1,038 75 1,257 184 2,280
Apr-09 12,100 224 1,105 76 893 82 1,034 181 2,346
Mar-09 12,019 229 1,046 77 799 83 1,219 186 2,351
Feb-09 11,447 240 806 84 628 75 973 182 2,089
Jan-09 11,277 245 727 84 634 80 1,192 186 1,987
Dec-08 11,430 249 649 78 784 75 1,491 186 1,365
Nov-08 11,874 243 717 69 755 71 1,092 159 1,709
Oct-08 12,397 236 755 72 932 64 1,477 158 2,035
Sep-08 12,861 230 933 68 1,021 68 1,566 171 2,647
Aug-08 12,780 227 1,004 72 1,164 70 1,562 166 2,281
Jul-08 13,102 222 1,092 68 1,208 68 1,511 173 2,703
Jun-08 13,017 223 1,132 69 1,277 67 1,486 187 2,627
May-08 12,932 219 1,195 67 1,221 74 1,347 151 2,524
Apr-08 13,197 215 1,272 73 1,135 76 1,517 152 3,012
Mar-08 13,017 213 1,241 74 1,076 77 1,591 154 2,881
Feb-08 12,668 219 1,121 73 893 74 1,411 193 2,489
Jan-08 12,738 219 1,015 75 879 73 1,544 153 2,867
Dec-07 12,501 223 759 77 1,060 69 1,871 167 1,630
Nov-07 13,361 215 1,012 70 1,095 65 1,478 149 2,232
Oct-07 14,156 205 1,211 64 1,172 61 1,816 132 3,023
BrokerMetrics® 2 of 2 11/23/09
Information not guaranteed. © 2009 - 2010 Terradatum and its suppliers and licensors (http://www.terradatum.com/metrics/licensors).