More Related Content
Similar to Delaware County Sold Median Price (20)
More from Prudential Fox & Roach, Realtors (20)
Delaware County Sold Median Price
- 1. Market Dynamics Prudential Fox & Roach
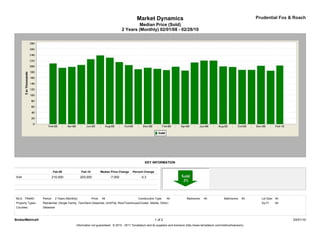
Median Price (Sold)
2 Years (Monthly) 02/01/08 - 02/28/10
KEY INFORMATION
Feb-08 Feb-10 Median Price Change Percent Change
Sold 210,000 203,000 -7,000 -3.3
MLS: TReND Period: 2 Years (Monthly) Price: All Construction Type: All Bedrooms: All Bathrooms: All Lot Size: All
Property Types: Residential: (Single Family, Twin/Semi-Detached, Unit/Flat, Row/Townhouse/Cluster, Mobile, Other) Sq Ft: All
Counties: Delaware
BrokerMetrics® 1 of 2 03/01/10
Information not guaranteed. © 2010 - 2011 Terradatum and its suppliers and licensors (http://www.terradatum.com/metrics/licensors).
- 2. Market Dynamics Prudential Fox & Roach
Median Price (Sold)
2 Years (Monthly) 02/01/08 - 02/28/10
FOR SALE UNDER CONTRACT SOLD EXPIRED NEW LISTINGS
Time Period Median $ # Properties Median $ # Properties Median $ # Properties Median $ # Properties Median $ # Properties
Feb-10 210,000 3,787 179,000 267 203,000 194 189,900 311 224,250 666
Jan-10 209,000 3,760 199,877 337 185,000 245 218,662 302 198,500 757
Dec-09 208,500 3,717 188,250 260 202,000 330 179,900 454 179,700 408
Nov-09 214,795 3,950 212,000 313 187,850 580 218,900 328 184,950 554
Oct-09 215,000 4,254 199,250 510 187,750 514 232,400 348 196,500 736
Sep-09 215,900 4,400 194,900 510 197,900 431 219,950 372 204,950 904
Aug-09 217,996 4,286 199,900 467 199,900 512 214,900 323 179,900 728
Jul-09 224,990 4,359 201,250 474 220,000 568 254,900 327 209,000 788
Jun-09 225,000 4,404 199,900 494 220,000 569 227,000 339 214,950 748
May-09 228,600 4,508 224,950 552 213,500 403 229,700 300 221,450 826
Apr-09 229,000 4,474 219,900 500 185,450 360 246,950 292 229,427 959
Mar-09 225,000 4,215 224,900 413 198,900 337 219,500 287 224,950 874
Feb-09 224,900 3,979 199,919 393 187,000 233 225,000 245 229,900 741
Jan-09 219,935 3,920 189,900 316 191,500 236 225,000 366 199,900 640
Dec-08 224,899 3,935 199,899 253 195,250 350 220,000 402 179,250 402
Nov-08 225,000 4,173 193,750 256 190,000 286 223,400 384 205,000 505
Oct-08 228,000 4,393 200,000 307 204,500 392 242,400 418 216,950 706
Sep-08 225,000 4,551 189,900 362 215,000 421 224,900 502 224,900 934
Aug-08 224,900 4,380 214,900 383 229,950 513 219,000 380 199,900 739
Jul-08 229,900 4,509 220,000 462 238,000 503 232,450 406 219,395 904
Jun-08 235,000 4,556 234,950 498 225,000 594 249,900 453 224,900 1,005
May-08 239,000 4,452 229,900 509 205,000 517 234,250 392 234,900 999
Apr-08 235,000 4,395 218,450 574 198,250 470 238,900 368 229,900 1,153
Mar-08 231,963 4,152 217,450 512 195,000 443 222,750 398 228,700 1,019
Feb-08 229,900 4,005 220,000 504 210,000 369 230,000 368 234,950 916
BrokerMetrics® 2 of 2 03/01/10
Information not guaranteed. © 2010 - 2011 Terradatum and its suppliers and licensors (http://www.terradatum.com/metrics/licensors).