Downloaded 20 times


![R
add.smooth <- function(m) {
r <- nrow(m)
ms <- sapply(m, function(y) {
ave(coredata(y),
seq.int(r) %/% max(3, r %/% 150),
FUN=function(x) {mean(x, na.rm=T)})
})
df <- data.frame(index(m)[rep.int(1:r, ncol(m))],
factor(rep(1:ncol(m), each = r), levels = 1:ncol(m)),
as.vector(coredata(m)),
as.vector(coredata(ms)))
names(df) <- c("Index", "Series", "Value", "Smooth")
df
}](https://image.slidesharecdn.com/9-131107074942-phpapp01/85/slide-43-320.jpg)

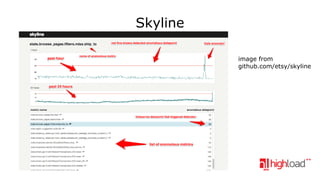


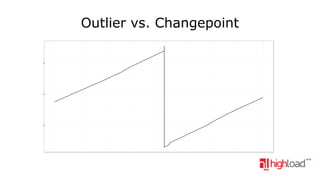
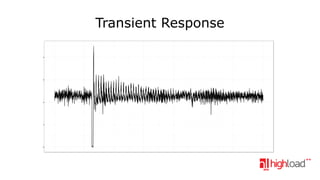
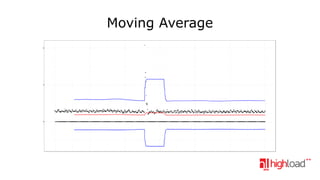
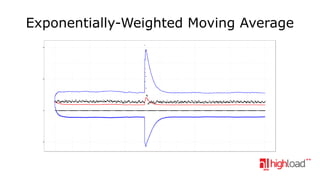
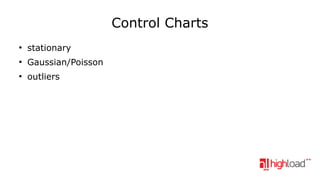
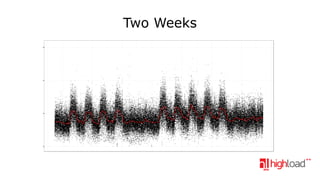
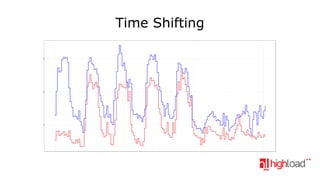
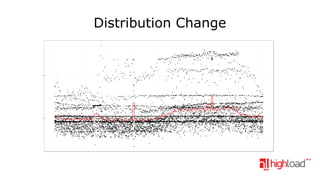
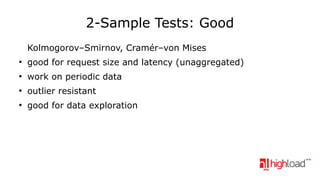
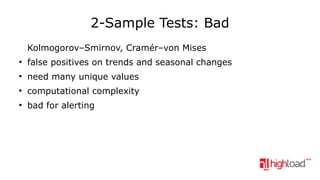
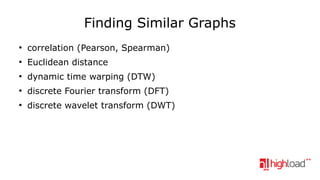
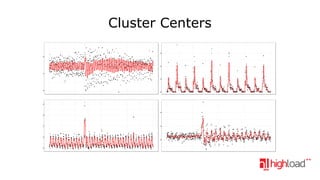
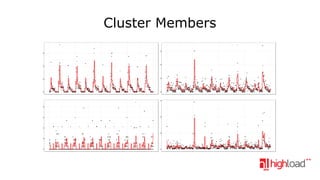
The document discusses using statistics for anomaly detection in load testing and production monitoring. It covers topics like distinguishing outliers from changepoints, dealing with noise and resolution in real data, and filtering techniques. Methods discussed for load testing include moving averages, exponentially weighted averages, and control charts. For production monitoring, autocorrelation, distribution testing, and clustering techniques are presented. Open-source tools like CollectD, Graphite, Skyline, and Oculus are introduced for gathering and analyzing metrics data.


![5G Explained! A High Level Overview [Introduction]](https://cdn.slidesharecdn.com/ss_thumbnails/5gexplainedahighleveloverview-260119165306-cc137a3e-thumbnail.jpg?width=640&height=640&fit=bounds)


