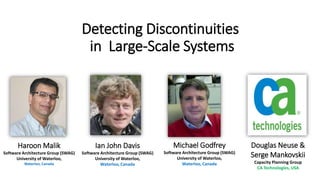
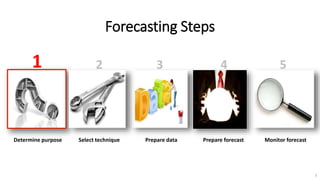
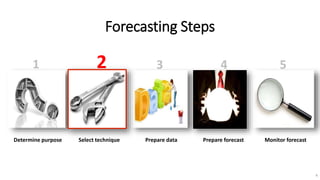
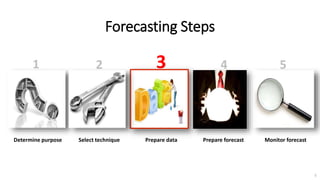
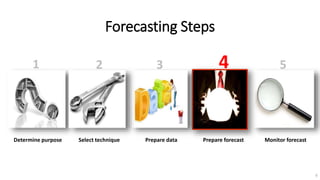
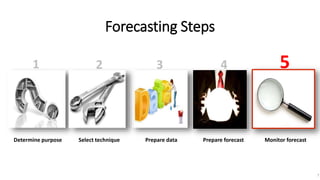
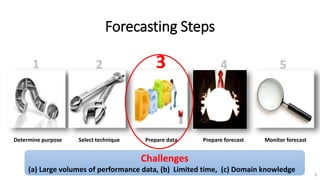
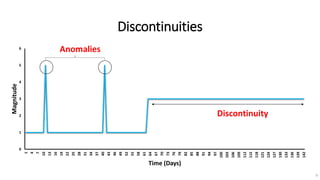
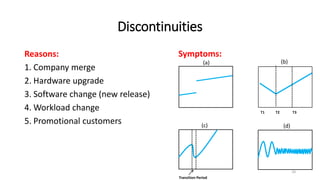
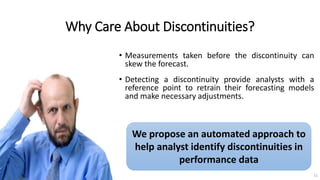
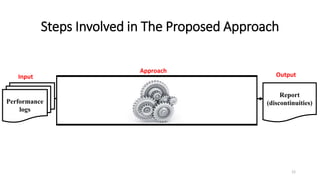
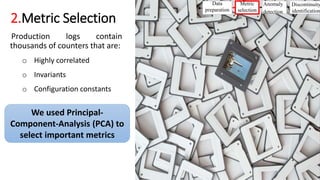
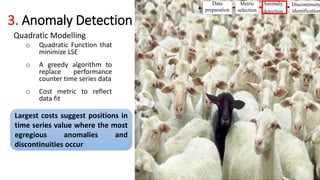
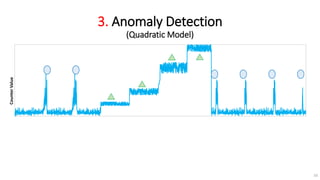
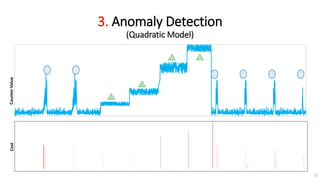
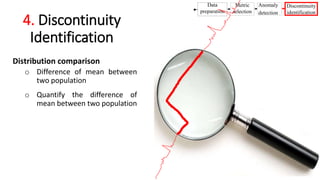
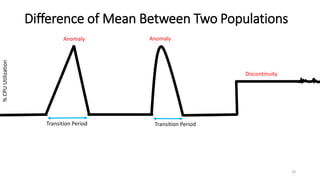
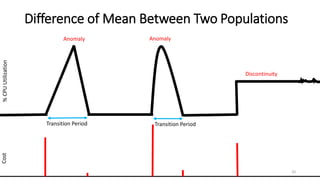
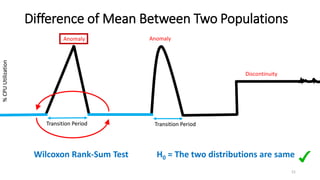
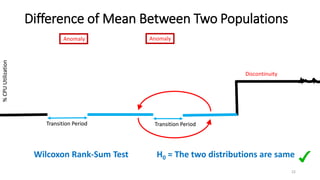
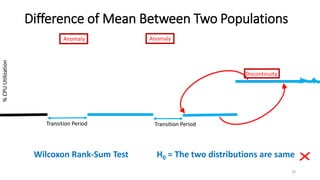
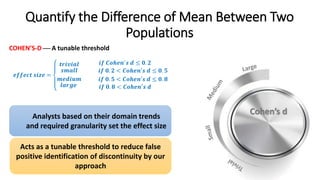
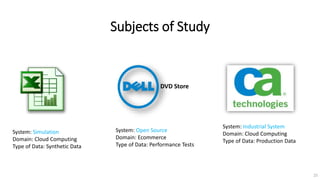
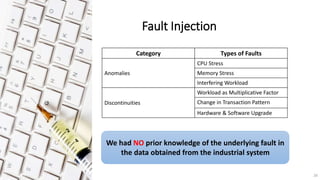
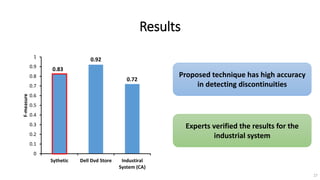
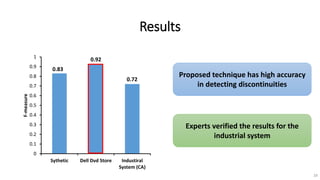
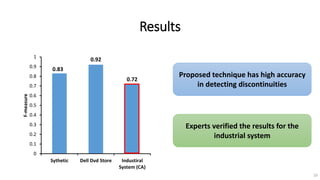
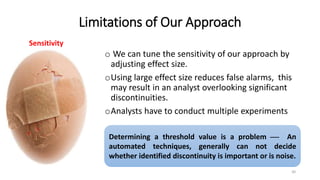
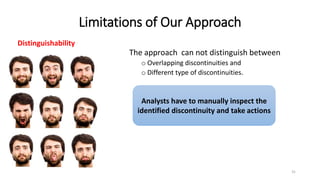
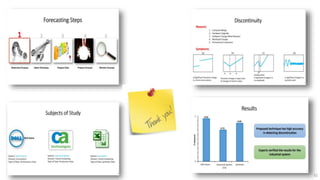
Detecting Discontinuities
in Large-Scale Systems
Haroon Malik
Software Architecture Group (SWAG)
University of Waterloo,
Waterloo, Canada
Ian John Davis
Software Architecture Group (SWAG)
University of Waterloo,
Waterloo, Canada
Michael Godfrey
Software Architecture Group (SWAG)
University of Waterloo,
Waterloo, Canada
Douglas Neuse &
Serge Mankovskii
Capacity Planning Group
CA Technologies, USA
2
Datacenters Require Good Forecasts
Forecasting Steps
1 2 3 4 5
Determine purpose Select technique Prepare data Prepare forecast Monitor forecast
3
Forecasting Steps
1 2 3 4 5
Determine purpose Select technique Prepare data Prepare forecast Monitor forecast
4
Forecasting Steps
1 2 3 4 5
Determine purpose Select technique Prepare data Prepare forecast Monitor forecast
5
Forecasting Steps
1 2 3 4 5
Determine purpose Select technique Prepare data Prepare forecast Monitor forecast
6
Forecasting Steps
1 2 3 4 5
Determine purpose Select technique Prepare data Prepare forecast Monitor forecast
7
Forecasting Steps
1 2 3 4 5
Determine purpose Select technique Prepare data Prepare forecast Monitor forecast
Challenges
(a) Large volumes of performance data, (b) Limited time, (c) Domain knowledge
8
Discontinuities
0
1
2
3
4
5
6
1
4
7
10
13
16
19
22
25
28
31
34
37
40
43
46
49
52
55
58
61
64
67
70
73
76
79
82
85
88
91
94
97
100
103
106
109
112
115
118
121
124
127
130
133
136
139
142
Magnitude
Time (Days)
Discontinuity
Anomalies
9
Discontinuities
Reasons:
1. Company merge
2. Hardware upgrade
3. Software change (new release)
4. Workload change
5. Promotional customers
10
(a)
T1 T2 T3
(b)
Transition Period
(c) (d)
Symptoms:
Why Care About Discontinuities?
• Measurements taken before the discontinuity can
skew the forecast.
• Detecting a discontinuity provide analysts with a
reference point to retrain their forecasting models
and make necessary adjustments.
We propose an automated approach to
help analyst identify discontinuities in
performance data
11
Steps Involved in The Proposed Approach
12
Performance
logs
Report
(discontinuities)
Data
preparation
Metric
selection
Anomaly
detection
Discontinuity
identification
1 2 3 4
Input
Approach
Output
1. Data Preparation
The performance logs from the
production have noise:
o Missing counters
o Empty counters
o Different numerical ranges
13
We used statistical techniques
to filter noise in the data
Data
preparation
Metric
selection
Anomaly
detection
Discontinuity
identification
2.Metric Selection
Production logs contain
thousands of counters that are:
o Highly correlated
o Invariants
o Configuration constants
14
We used Principal-
Component-Analysis (PCA) to
select important metrics
Data
preparation
Metric
selection
Anomaly
detection
Discontinuity
identification
3. Anomaly Detection
Quadratic Modelling
o Quadratic Function that
minimize LSE
o A greedy algorithm to
replace performance
counter time series data
o Cost metric to reflect
data fit
15
Largest costs suggest positions in
time series value where the most
egregious anomalies and
discontinuities occur
Data
preparation
Metric
selection
Anomaly
detection
Discontinuity
identification
3. Anomaly Detection
(Quadratic Model)
CounterValue
16
3. Anomaly Detection
(Quadratic Model)
CounterValue
17
Cost
4. Discontinuity
Identification
Distribution comparison
o Difference of mean between
two population
o Quantify the difference of
mean between two population
18
Data
preparation
Metric
selection
Anomaly
detection
Discontinuity
identification
19
Transition Period Transition Period
Anomaly Anomaly
Discontinuity
%CPUUtilization
Difference of Mean Between Two Populations
20
Transition Period Transition Period
Anomaly Anomaly
Discontinuity
%CPUUtilizationCost
Difference of Mean Between Two Populations
21
Transition Period Transition Period
Anomaly Anomaly
Discontinuity
%CPUUtilization
21
Transition Period Transition Period
%CPUUtilization
Wilcoxon Rank-Sum Test H0 = The two distributions are same
Difference of Mean Between Two Populations
22
Transition Period Transition Period
Anomaly Anomaly
Discontinuity
%CPUUtilization
22
Transition Period Transition Period
%CPUUtilization
Wilcoxon Rank-Sum Test H0 = The two distributions are same
Difference of Mean Between Two Populations
23
Transition Period Transition Period
Anomaly Anomaly
Discontinuity
%CPUUtilization
23
Transition Period Transition Period
%CPUUtilization
Wilcoxon Rank-Sum Test H0 = The two distributions are same
Quantify the Difference of Mean Between Two
Populations
COHEN’S-D  A tunable threshold
𝒆𝒇𝒇𝒆𝒄𝒕 𝒔𝒊𝒛𝒆 =
𝒕𝒓𝒊𝒗𝒊𝒂𝒍
𝒔𝒎𝒂𝒍𝒍
𝒎𝒆𝒅𝒊𝒖𝒎
𝒍𝒂𝒓𝒈𝒆
𝒊𝒇 𝑪𝒐𝒉𝒆𝒏′ 𝒔 𝒅 ≤ 𝟎. 𝟐
𝒊𝒇 𝟎. 𝟐 < 𝑪𝒐𝒉𝒆𝒏′𝒔 𝒅 ≤ 𝟎. 𝟓
𝒊𝒇 𝟎. 𝟓 < 𝑪𝒐𝒉𝒆𝒏′𝒔 𝒅 ≤ 𝟎. 𝟖
𝒊𝒇 𝟎. 𝟖 < 𝑪𝒐𝒉𝒆𝒏′ 𝒔 𝒅
24
Analysts based on their domain trends
and required granularity set the effect size
Acts as a tunable threshold to reduce false
positive identification of discontinuity by our
approach
Cohen’s d
Subjects of Study
DVD Store
System: Open Source
Domain: Ecommerce
Type of Data: Performance Tests
System: Simulation
Domain: Cloud Computing
Type of Data: Synthetic Data
25
System: Industrial System
Domain: Cloud Computing
Type of Data: Production Data
Fault Injection
Category Types of Faults
Anomalies
CPU Stress
Memory Stress
Interfering Workload
Discontinuities
Workload as Multiplicative Factor
Change in Transaction Pattern
Hardware & Software Upgrade
26
We had NO prior knowledge of the underlying fault in
the data obtained from the industrial system
Results
0.92
0.72
Proposed technique has high accuracy
in detecting discontinuities
Experts verified the results for the
industrial system
27
0.83
0
0.1
0.2
0.3
0.4
0.5
0.6
0.7
0.8
0.9
1
Sythetic Dell Dvd Store Industiral
System (CA)
F-measure
Results
0.92
0.72
Proposed technique has high accuracy
in detecting discontinuities
Experts verified the results for the
industrial system
28
0.83
0
0.1
0.2
0.3
0.4
0.5
0.6
0.7
0.8
0.9
1
Sythetic Dell Dvd Store Industiral
System (CA)
F-measure
Results
0.92
0.72
Proposed technique has high accuracy
in detecting discontinuities
Experts verified the results for the
industrial system
29
0.83
0
0.1
0.2
0.3
0.4
0.5
0.6
0.7
0.8
0.9
1
Sythetic Dell Dvd Store Industiral
System (CA)
F-measure
Limitations of Our Approach
o We can tune the sensitivity of our approach by
adjusting effect size.
oUsing large effect size reduces false alarms, this
may result in an analyst overlooking significant
discontinuities.
oAnalysts have to conduct multiple experiments
30
Sensitivity
Determining a threshold value is a problem  An
automated techniques, generally can not decide
whether identified discontinuity is important or is noise.
Limitations of Our Approach
The approach can not distinguish between
o Overlapping discontinuities and
o Different type of discontinuities.
31
Distinguisibility
Analysts have to manually inspect the
identified discontinuity and take actions
Distinguishability
32
33
QUESTIONS……

Detecting Discontinuties in Large Scale Systems

  • 1.
    Detecting Discontinuities in Large-ScaleSystems Haroon Malik Software Architecture Group (SWAG) University of Waterloo, Waterloo, Canada Ian John Davis Software Architecture Group (SWAG) University of Waterloo, Waterloo, Canada Michael Godfrey Software Architecture Group (SWAG) University of Waterloo, Waterloo, Canada Douglas Neuse & Serge Mankovskii Capacity Planning Group CA Technologies, USA
  • 2.
  • 3.
    Forecasting Steps 1 23 4 5 Determine purpose Select technique Prepare data Prepare forecast Monitor forecast 3
  • 4.
    Forecasting Steps 1 23 4 5 Determine purpose Select technique Prepare data Prepare forecast Monitor forecast 4
  • 5.
    Forecasting Steps 1 23 4 5 Determine purpose Select technique Prepare data Prepare forecast Monitor forecast 5
  • 6.
    Forecasting Steps 1 23 4 5 Determine purpose Select technique Prepare data Prepare forecast Monitor forecast 6
  • 7.
    Forecasting Steps 1 23 4 5 Determine purpose Select technique Prepare data Prepare forecast Monitor forecast 7
  • 8.
    Forecasting Steps 1 23 4 5 Determine purpose Select technique Prepare data Prepare forecast Monitor forecast Challenges (a) Large volumes of performance data, (b) Limited time, (c) Domain knowledge 8
  • 9.
  • 10.
    Discontinuities Reasons: 1. Company merge 2.Hardware upgrade 3. Software change (new release) 4. Workload change 5. Promotional customers 10 (a) T1 T2 T3 (b) Transition Period (c) (d) Symptoms:
  • 11.
    Why Care AboutDiscontinuities? • Measurements taken before the discontinuity can skew the forecast. • Detecting a discontinuity provide analysts with a reference point to retrain their forecasting models and make necessary adjustments. We propose an automated approach to help analyst identify discontinuities in performance data 11
  • 12.
    Steps Involved inThe Proposed Approach 12 Performance logs Report (discontinuities) Data preparation Metric selection Anomaly detection Discontinuity identification 1 2 3 4 Input Approach Output
  • 13.
    1. Data Preparation Theperformance logs from the production have noise: o Missing counters o Empty counters o Different numerical ranges 13 We used statistical techniques to filter noise in the data Data preparation Metric selection Anomaly detection Discontinuity identification
  • 14.
    2.Metric Selection Production logscontain thousands of counters that are: o Highly correlated o Invariants o Configuration constants 14 We used Principal- Component-Analysis (PCA) to select important metrics Data preparation Metric selection Anomaly detection Discontinuity identification
  • 15.
    3. Anomaly Detection QuadraticModelling o Quadratic Function that minimize LSE o A greedy algorithm to replace performance counter time series data o Cost metric to reflect data fit 15 Largest costs suggest positions in time series value where the most egregious anomalies and discontinuities occur Data preparation Metric selection Anomaly detection Discontinuity identification
  • 16.
    3. Anomaly Detection (QuadraticModel) CounterValue 16
  • 17.
    3. Anomaly Detection (QuadraticModel) CounterValue 17 Cost
  • 18.
    4. Discontinuity Identification Distribution comparison oDifference of mean between two population o Quantify the difference of mean between two population 18 Data preparation Metric selection Anomaly detection Discontinuity identification
  • 19.
    19 Transition Period TransitionPeriod Anomaly Anomaly Discontinuity %CPUUtilization Difference of Mean Between Two Populations
  • 20.
    Difference of MeanBetween Two Populations 20 Transition Period Transition Period Anomaly Anomaly Discontinuity %CPUUtilizationCost
  • 21.
    Difference of MeanBetween Two Populations 21 Transition Period Transition Period Anomaly Anomaly Discontinuity %CPUUtilization 21 Transition Period Transition Period %CPUUtilization Wilcoxon Rank-Sum Test H0 = The two distributions are same
  • 22.
    Difference of MeanBetween Two Populations 22 Transition Period Transition Period Anomaly Anomaly Discontinuity %CPUUtilization 22 Transition Period Transition Period %CPUUtilization Wilcoxon Rank-Sum Test H0 = The two distributions are same
  • 23.
    Difference of MeanBetween Two Populations 23 Transition Period Transition Period Anomaly Anomaly Discontinuity %CPUUtilization 23 Transition Period Transition Period %CPUUtilization Wilcoxon Rank-Sum Test H0 = The two distributions are same
  • 24.
    Quantify the Differenceof Mean Between Two Populations COHEN’S-D  A tunable threshold 𝒆𝒇𝒇𝒆𝒄𝒕 𝒔𝒊𝒛𝒆 = 𝒕𝒓𝒊𝒗𝒊𝒂𝒍 𝒔𝒎𝒂𝒍𝒍 𝒎𝒆𝒅𝒊𝒖𝒎 𝒍𝒂𝒓𝒈𝒆 𝒊𝒇 𝑪𝒐𝒉𝒆𝒏′ 𝒔 𝒅 ≤ 𝟎. 𝟐 𝒊𝒇 𝟎. 𝟐 < 𝑪𝒐𝒉𝒆𝒏′𝒔 𝒅 ≤ 𝟎. 𝟓 𝒊𝒇 𝟎. 𝟓 < 𝑪𝒐𝒉𝒆𝒏′𝒔 𝒅 ≤ 𝟎. 𝟖 𝒊𝒇 𝟎. 𝟖 < 𝑪𝒐𝒉𝒆𝒏′ 𝒔 𝒅 24 Analysts based on their domain trends and required granularity set the effect size Acts as a tunable threshold to reduce false positive identification of discontinuity by our approach Cohen’s d
  • 25.
    Subjects of Study DVDStore System: Open Source Domain: Ecommerce Type of Data: Performance Tests System: Simulation Domain: Cloud Computing Type of Data: Synthetic Data 25 System: Industrial System Domain: Cloud Computing Type of Data: Production Data
  • 26.
    Fault Injection Category Typesof Faults Anomalies CPU Stress Memory Stress Interfering Workload Discontinuities Workload as Multiplicative Factor Change in Transaction Pattern Hardware & Software Upgrade 26 We had NO prior knowledge of the underlying fault in the data obtained from the industrial system
  • 27.
    Results 0.92 0.72 Proposed technique hashigh accuracy in detecting discontinuities Experts verified the results for the industrial system 27 0.83 0 0.1 0.2 0.3 0.4 0.5 0.6 0.7 0.8 0.9 1 Sythetic Dell Dvd Store Industiral System (CA) F-measure
  • 28.
    Results 0.92 0.72 Proposed technique hashigh accuracy in detecting discontinuities Experts verified the results for the industrial system 28 0.83 0 0.1 0.2 0.3 0.4 0.5 0.6 0.7 0.8 0.9 1 Sythetic Dell Dvd Store Industiral System (CA) F-measure
  • 29.
    Results 0.92 0.72 Proposed technique hashigh accuracy in detecting discontinuities Experts verified the results for the industrial system 29 0.83 0 0.1 0.2 0.3 0.4 0.5 0.6 0.7 0.8 0.9 1 Sythetic Dell Dvd Store Industiral System (CA) F-measure
  • 30.
    Limitations of OurApproach o We can tune the sensitivity of our approach by adjusting effect size. oUsing large effect size reduces false alarms, this may result in an analyst overlooking significant discontinuities. oAnalysts have to conduct multiple experiments 30 Sensitivity Determining a threshold value is a problem  An automated techniques, generally can not decide whether identified discontinuity is important or is noise.
  • 31.
    Limitations of OurApproach The approach can not distinguish between o Overlapping discontinuities and o Different type of discontinuities. 31 Distinguisibility Analysts have to manually inspect the identified discontinuity and take actions Distinguishability
  • 32.
  • 33.

Editor's Notes

  • #3 To ensure SLAs are met, while minimizing infrastructure costs, data center operators need to know ahead of time, (i.e., short and long-term forecasts) the expected workload. Operators use short-term forecast (based on a week to a month of data centers recent performance history) for dynamic provisioning and placement of tasks in a data center, especially for load balancing to avoid performance bottlenecks. Where as long-term forecasting of the workload is necessary for capacity planning to ensure that the cloud infrastructure supports growth and evolution of client requirements. The accuracy of forecasting results depends on the quality of the performance data (i.e., performance counters; such as CPU utilization, bandwidth consumption, network traffic and Disk IOPS) fed to the forecasting algorithms. In next 20 minutes, I will walk you through forecasting steps for typical data center, describe the challenge face by the data center to derive quality data for forcast distributed across thousands of machines, expalin our proposed methodology to over coem the challenge and share some obtaiend resutls.
  • #4 Initially a department, team or a stockholder requests a forecast. Usually, a dedicated group or team of analysts is responsible for handling the forecast requisition. The analysts gather preliminary information from the requestor, i.e., a) forecast purpose (e.g., operations are interested to know expected workload volume on a daily to weekly basis for load balancing and dynamic placement of machines, whereas, marketing and sales are more concerned about growth in customers and for scheduling and purchases) and b) a time horizon for a forecast (seconds, hours, days, months, quarters or years).
  • #5 Initially a department, team or a stockholder requests a forecast. Usually, a dedicated group or team of analysts is responsible for handling the forecast requisition. The analysts gather preliminary information from the requestor, i.e., a) forecast purpose (e.g., operations are interested to know expected workload volume on a daily to weekly basis for load balancing and dynamic placement of machines, whereas, marketing and sales are more concerned about growth in customers and for scheduling and purchases) and b) a time horizon for a forecast (seconds, hours, days, months, quarters or years).
  • #6 Initially a department, team or a stockholder requests a forecast. Usually, a dedicated group or team of analysts is responsible for handling the forecast requisition. The analysts gather preliminary information from the requestor, i.e., a) forecast purpose (e.g., operations are interested to know expected workload volume on a daily to weekly basis for load balancing and dynamic placement of machines, whereas, marketing and sales are more concerned about growth in customers and for scheduling and purchases) and b) a time horizon for a forecast (seconds, hours, days, months, quarters or years).
  • #7 In this step, the analyst uses prepared time series training data and the selected forecast technique to create a forecast model that has minimum error rate, i.e., its predicted values are close to the actual time series value, without either underfitting or overfitting. Analyst tune the parameters of the forecast techniques several times to find the best form of the model that satisfies the requestor’s forecast objective.
  • #8 Initially a department, team or a stockholder requests a forecast. Usually, a dedicated group or team of analysts is responsible for handling the forecast requisition. The analysts gather preliminary information from the requestor, i.e., a) forecast purpose (e.g., operations are interested to know expected workload volume on a daily to weekly basis for load balancing and dynamic placement of machines, whereas, marketing and sales are more concerned about growth in customers and for scheduling and purchases) and b) a time horizon for a forecast (seconds, hours, days, months, quarters or years).
  • #9 Initially a department, team or a stockholder requests a forecast. Usually, a dedicated group or team of analysts is responsible for handling the forecast requisition. The analysts gather preliminary information from the requestor, i.e., a) forecast purpose (e.g., operations are interested to know expected workload volume on a daily to weekly basis for load balancing and dynamic placement of machines, whereas, marketing and sales are more concerned about growth in customers and for scheduling and purchases) and b) a time horizon for a forecast (seconds, hours, days, months, quarters or years).