Download as PDF, PPTX


![©2023 F5
27
Deeper dive: Weibull
• Usually used for time-to-failure
• Defined by a Shape and a Scale
parameter
• This can be challenging
• Don’t ask the math
• F(t)=1−e−(t/λ)β
• R does it for you!
Component Time-to-Failure
Spinning Rust 500 hours
Memory 1000 hours
Power Supply 1500 hours
CPU 2000 hours
SSD 2500 hours
library(fitdistrplus)
data <- c(500, 1000, 1500, 2000, 2500)
fit.weib <- fitdist(data, "weibull")
summary(fit.weib)
Fitting of the distribution ' weibull ' by maximum likelihood
Parameters : shape 1.0624082 scale 2158.256
p.failure <- pweibull(300, shape = fit.weib$estimate[1],
scale = fit.weib$estimate[2])
1 - p.failure
Failure (disk, memory) = 64.81%
Failure (entire system) = 75.52%
Fdisk(300)≈1−e−0.6918≈0.50025
Fmemory(300)≈1− −0.3490≈0.2959Fmemory(300)≈1−e−0.3490≈0.2959
Fpower(300)≈1− −0.2327≈0.2092Fpower(300)≈1−e−0.2327≈0.2092
FCPU(300)≈1− −0.1745≈0.1593FCPU(300)≈1−e−0.1745≈0.1593
FSSD(300)≈1− −0.1396≈0.1298FSSD(300)≈1−e−0.1396≈0.1298](https://image.slidesharecdn.com/ato2023statsbehindthealerts-231019171655-b470c0b6/85/Know-Your-Data-The-stats-behind-your-alerts-26-320.jpg)


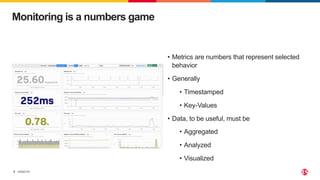
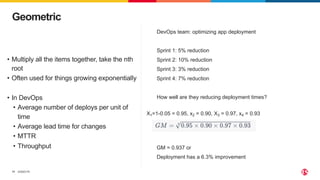
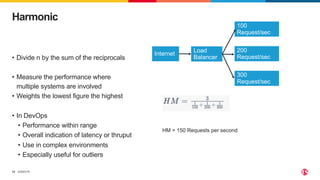
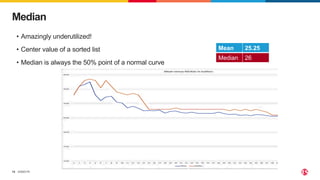
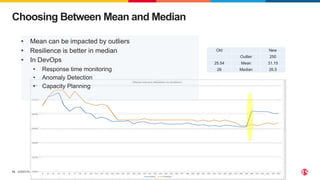
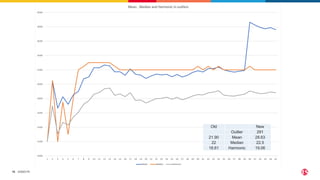
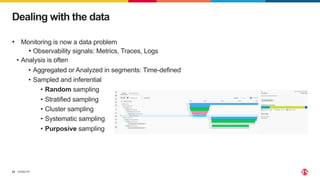
The document provides an overview of statistical measures such as mean, median, and mode, and their applications in monitoring and analyzing data in a DevOps context. It discusses various forms of averages, including arithmetic, geometric, and harmonic means, and how they can be influenced by outliers and sampling methods. Additionally, the document emphasizes the importance of understanding variability and probability theory, particularly in troubleshooting and predictive monitoring scenarios.


![Getting Started with Apache Spark: Big Data Made Simple [Free Meetup]](https://cdn.slidesharecdn.com/ss_thumbnails/apachesparkgettingstarted-260203175547-8361bcc3-thumbnail.jpg?width=640&height=640&fit=bounds)


