Download to read offline
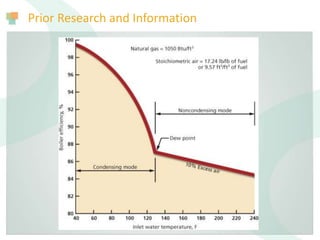
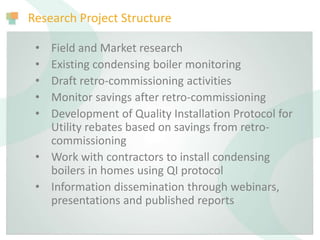
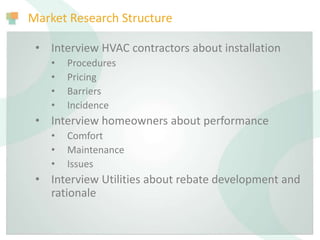
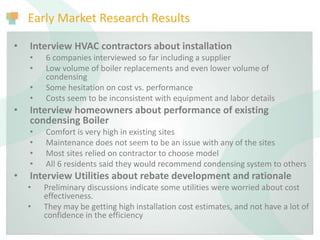
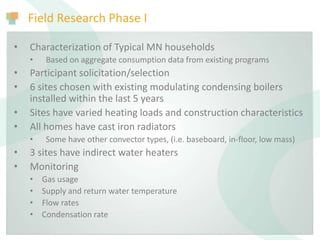
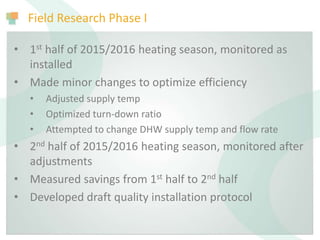
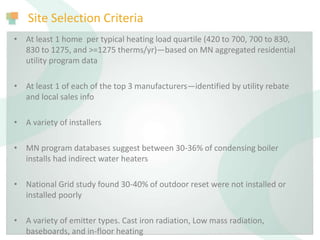
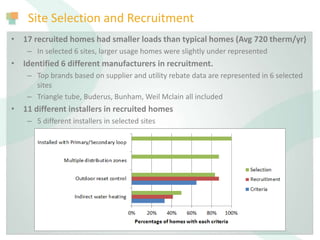
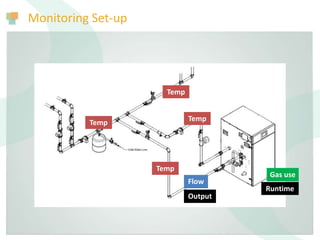
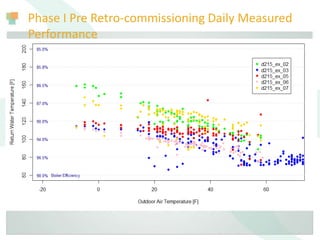

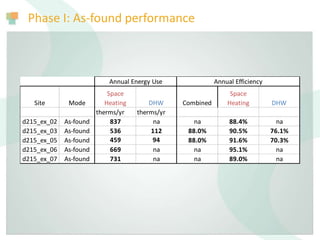
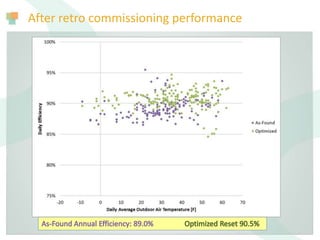
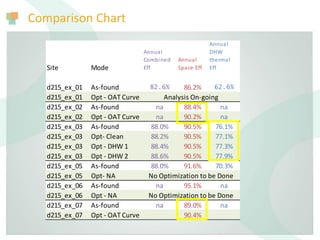
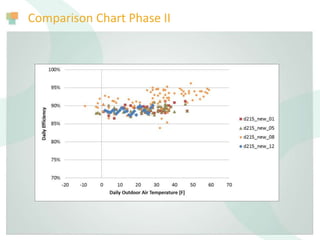
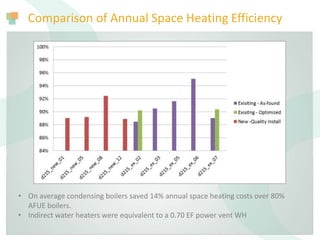

The document summarizes research on improving the efficiency of hydronic heating systems through retro-commissioning of condensing boilers. Researchers monitored the performance of 6 homes with existing condensing boilers, identified opportunities to optimize settings, and measured efficiency gains after adjusting the outdoor reset curve, supply water temperature, and domestic hot water settings. The research aims to develop best practice installation and operation guidelines to improve contractor confidence and consumer savings from condensing boiler upgrades.


